
#o
o
210,468 views
1,467 Discussing
Hot
Latest

·
--
$O +5.43% | $CHECK +5.13% | $ESPORTS +4.96%
#O on BSC nudged to $0.5671, up +5.43% with $314.1K volume and a $90.7M market cap.
CHECK on Base rose to $0.00753262, up +5.13% on $596.6K volume, sitting at a $3.4M market cap.
ESPORTS on BSC ticked up to $0.0104, gaining +4.96% with $142.1K traded and a $9.3M cap.
Keep an eye on the sub‑$5 M market caps; a modest shift in order flow could erase today’s gains quickly.
#BinanceAlpha #TopGainers #Write2Earn #Binance
$O +5.43% | $CHECK +5.13% | $ESPORTS +4.96%
#O on BSC nudged to $0.5671, up +5.43% with $314.1K volume and a $90.7M market cap.
CHECK on Base rose to $0.00753262, up +5.13% on $596.6K volume, sitting at a $3.4M market cap.
ESPORTS on BSC ticked up to $0.0104, gaining +4.96% with $142.1K traded and a $9.3M cap.
Keep an eye on the sub‑$5 M market caps; a modest shift in order flow could erase today’s gains quickly.
#BinanceAlpha #TopGainers #Write2Earn #Binance
#O on BSC nudged to $0.5671, up +5.43% with $314.1K volume and a $90.7M market cap.
CHECK on Base rose to $0.00753262, up +5.13% on $596.6K volume, sitting at a $3.4M market cap.
ESPORTS on BSC ticked up to $0.0104, gaining +4.96% with $142.1K traded and a $9.3M cap.
Keep an eye on the sub‑$5 M market caps; a modest shift in order flow could erase today’s gains quickly.
#BinanceAlpha #TopGainers #Write2Earn #Binance

·
--
Article
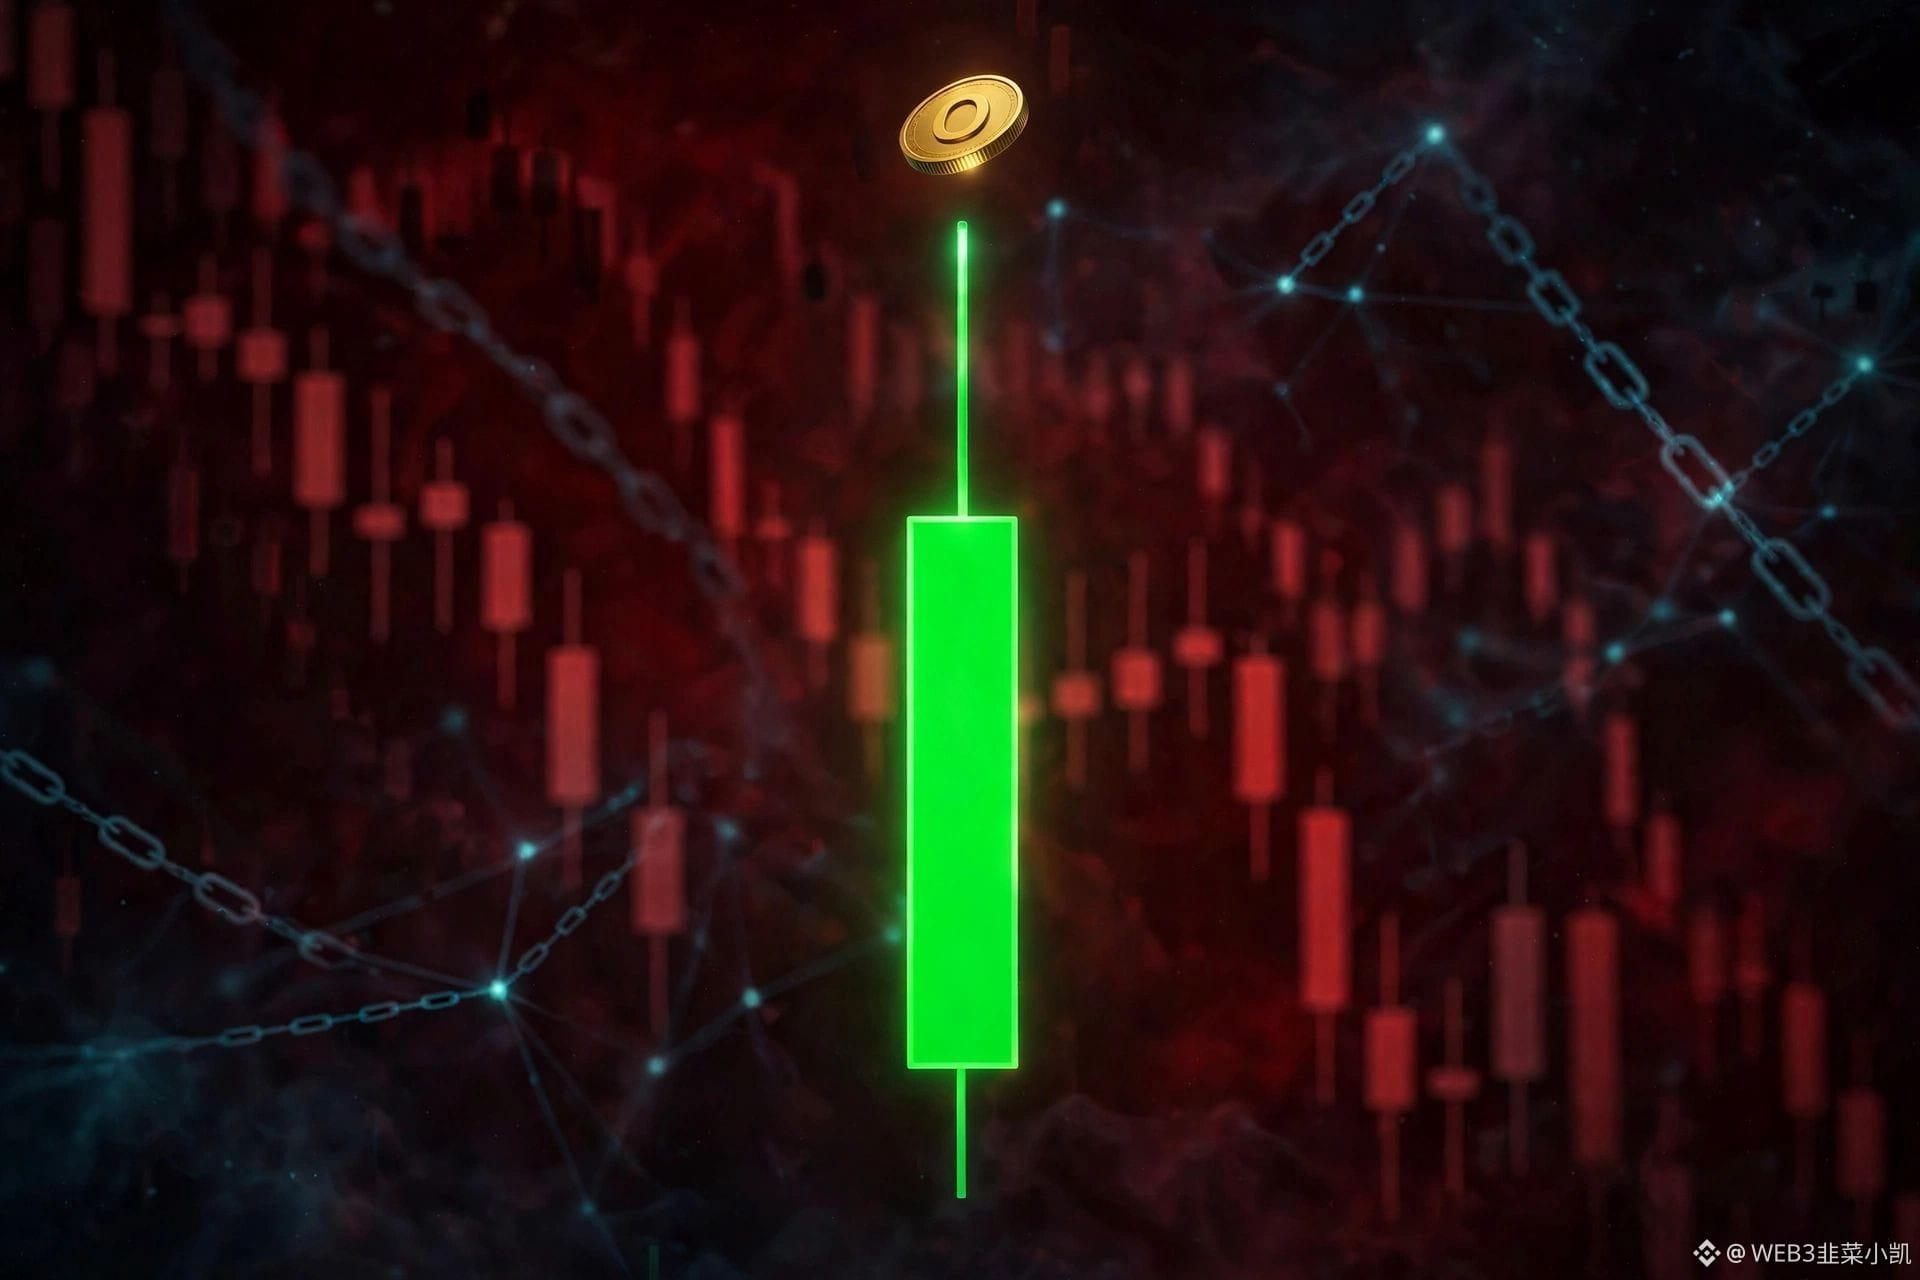
O rises 4.5% in a day, outperforming Bitcoin by over 60 percentage points in 30 daysUp 30.8% in 30 days, while Bitcoin fell about 30% over the same period. O is up another 4.5% today.
O is currently at $0.556, up 4.45% in 24 hours, with $2.84 million in daily trading volume and a market cap of $89 million, ranking 250th. It is up 10.5% over seven days and 33.1% over 14 days, and is still 41% below its June 20 high of $0.94. The data is from CoinGecko’s global market figures, retrieved today, November 21, at 12:47. At the same time, Bitcoin was at $57,043, down 8.19% in 24 hours, and the broader market was still falling.
I went through the messages from the past two days and didn’t see anything new that could explain today’s move. CoinMarketCap’s analysis also says there was no verifiable news catalyst; the main driver was increased trading volume. Most of the seven-day gain came on November 16, when it rose 12% in a single day. It moved only one or two points a day over the following days, so today’s 4.5% rise looks more like funds moving in a thin market than a reaction to new fundamentals.
O rises 4.5% in a day, outperforming Bitcoin by over 60 percentage points in 30 days
Up 30.8% in 30 days, while Bitcoin fell about 30% over the same period. O is up another 4.5% today.
O is currently at $0.556, up 4.45% in 24 hours, with $2.84 million in daily trading volume and a market cap of $89 million, ranking 250th. It is up 10.5% over seven days and 33.1% over 14 days, and is still 41% below its June 20 high of $0.94. The data is from CoinGecko’s global market figures, retrieved today, November 21, at 12:47. At the same time, Bitcoin was at $57,043, down 8.19% in 24 hours, and the broader market was still falling.
I went through the messages from the past two days and didn’t see anything new that could explain today’s move. CoinMarketCap’s analysis also says there was no verifiable news catalyst; the main driver was increased trading volume. Most of the seven-day gain came on November 16, when it rose 12% in a single day. It moved only one or two points a day over the following days, so today’s 4.5% rise looks more like funds moving in a thin market than a reaction to new fundamentals.
O is currently at $0.556, up 4.45% in 24 hours, with $2.84 million in daily trading volume and a market cap of $89 million, ranking 250th. It is up 10.5% over seven days and 33.1% over 14 days, and is still 41% below its June 20 high of $0.94. The data is from CoinGecko’s global market figures, retrieved today, November 21, at 12:47. At the same time, Bitcoin was at $57,043, down 8.19% in 24 hours, and the broader market was still falling.
I went through the messages from the past two days and didn’t see anything new that could explain today’s move. CoinMarketCap’s analysis also says there was no verifiable news catalyst; the main driver was increased trading volume. Most of the seven-day gain came on November 16, when it rose 12% in a single day. It moved only one or two points a day over the following days, so today’s 4.5% rise looks more like funds moving in a thin market than a reaction to new fundamentals.
10

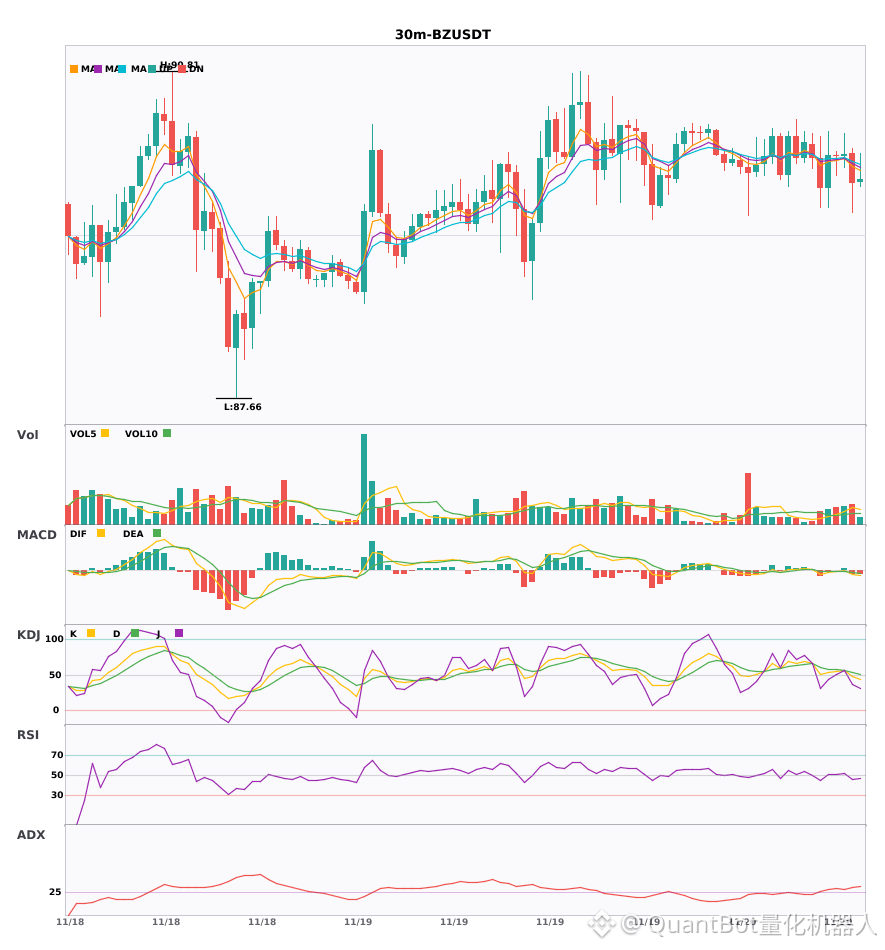
$O / $BZ 30-minute bearish signals, short-term pressure ahead
📉 $O | 30-minute Bearish Signal
━━━━━━━━━━━━━━━━━━
Technical analysis: ADX(27) trend forming|MACD DIF turns bearish after crossing zero|Moving averages converging|KDJ weak at 40.8/36.9|Volume up 3.2x
Price change: -0.3000%
📉 $BZ | 30-minute Bearish Signal
━━━━━━━━━━━━━━━━━━
Technical analysis: ADX(31) trend confirmed | MACD death cross below zero, bearish momentum strengthening | EMA5 crosses below EMA8, short-term bearish bias | Trading volume up 1.8x
Price change: -0.3100%
━━━━━━━━━━━━━━━━━━
#技术分析 #O #BZ
📌 The above content is for reference only and does not constitute investment advice
$O / $BZ 30-minute bearish signals, short-term pressure ahead
📉 $O | 30-minute Bearish Signal
━━━━━━━━━━━━━━━━━━
Technical analysis: ADX(27) trend forming|MACD DIF turns bearish after crossing zero|Moving averages converging|KDJ weak at 40.8/36.9|Volume up 3.2x
Price change: -0.3000%
📉 $BZ | 30-minute Bearish Signal
━━━━━━━━━━━━━━━━━━
Technical analysis: ADX(31) trend confirmed | MACD death cross below zero, bearish momentum strengthening | EMA5 crosses below EMA8, short-term bearish bias | Trading volume up 1.8x
Price change: -0.3100%
━━━━━━━━━━━━━━━━━━
#技术分析 #O #BZ
📌 The above content is for reference only and does not constitute investment advice
📉 $O | 30-minute Bearish Signal
━━━━━━━━━━━━━━━━━━
Technical analysis: ADX(27) trend forming|MACD DIF turns bearish after crossing zero|Moving averages converging|KDJ weak at 40.8/36.9|Volume up 3.2x
Price change: -0.3000%
📉 $BZ | 30-minute Bearish Signal
━━━━━━━━━━━━━━━━━━
Technical analysis: ADX(31) trend confirmed | MACD death cross below zero, bearish momentum strengthening | EMA5 crosses below EMA8, short-term bearish bias | Trading volume up 1.8x
Price change: -0.3100%
━━━━━━━━━━━━━━━━━━
#技术分析 #O #BZ
📌 The above content is for reference only and does not constitute investment advice
5

·
--
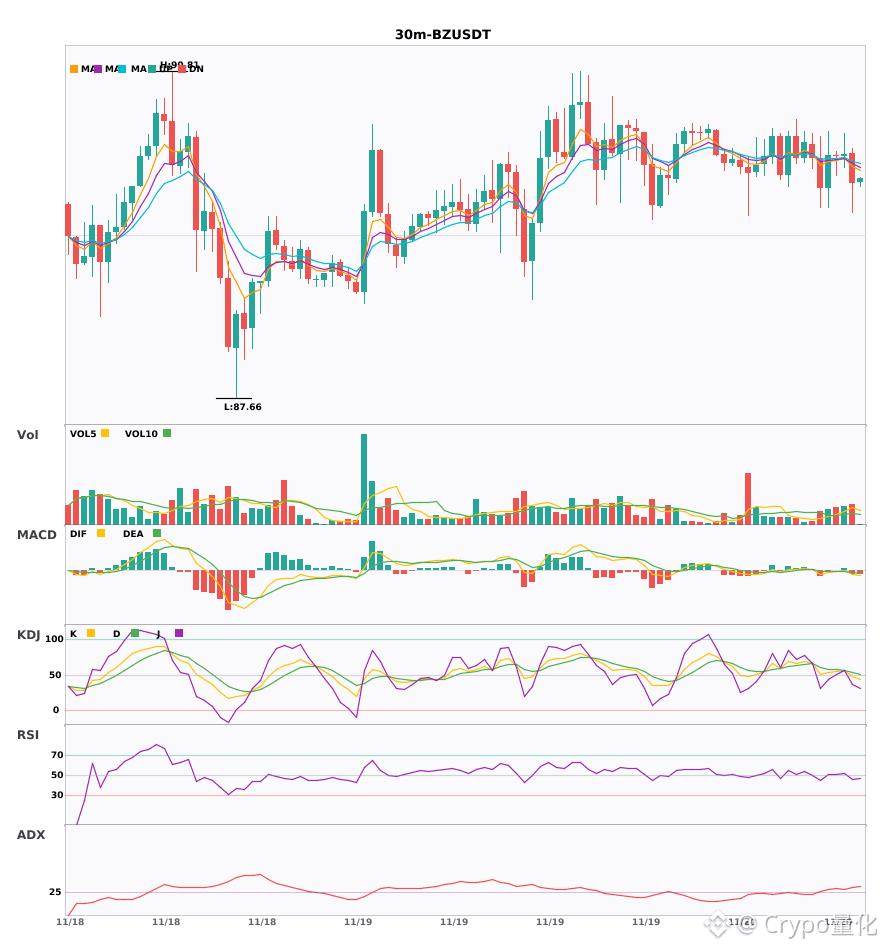
$O $BZ 30-minute charts have all weakened; watch for short-term pullback risk 🔥
════════════════════
🟢 $O 30-minute bearish signal
⚠️Technical analysis: ADX trend is forming; follow the trend. MACD has crossed below the zero line, turning bearish. Moving averages are converging; direction is yet to be determined. KDJ is weakening, with bears in control (K40.8/D36.9). Volume has surged 3.2x.
════════════════════
🟢 $BZ 30-minute bearish signal
⚠️Technical analysis: ADX is high, indicating a strong trend. MACD has formed a bearish cross below zero on rising volume; the histogram has turned from red to green, accelerating the decline. EMA5 has just crossed below EMA8, turning bearish in the short term. Trading volume has increased 1.8x.
════════════════════
🔔 Follow for first-hand market alerts 🔔
#技术分析 #O #BZ
📌 When trading, check whether the candlestick pattern matches
$O $BZ 30-minute charts have all weakened; watch for short-term pullback risk 🔥
════════════════════
🟢 $O 30-minute bearish signal
⚠️Technical analysis: ADX trend is forming; follow the trend. MACD has crossed below the zero line, turning bearish. Moving averages are converging; direction is yet to be determined. KDJ is weakening, with bears in control (K40.8/D36.9). Volume has surged 3.2x.
════════════════════
🟢 $BZ 30-minute bearish signal
⚠️Technical analysis: ADX is high, indicating a strong trend. MACD has formed a bearish cross below zero on rising volume; the histogram has turned from red to green, accelerating the decline. EMA5 has just crossed below EMA8, turning bearish in the short term. Trading volume has increased 1.8x.
════════════════════
🔔 Follow for first-hand market alerts 🔔
#技术分析 #O #BZ
📌 When trading, check whether the candlestick pattern matches
════════════════════
🟢 $O 30-minute bearish signal
⚠️Technical analysis: ADX trend is forming; follow the trend. MACD has crossed below the zero line, turning bearish. Moving averages are converging; direction is yet to be determined. KDJ is weakening, with bears in control (K40.8/D36.9). Volume has surged 3.2x.
════════════════════
🟢 $BZ 30-minute bearish signal
⚠️Technical analysis: ADX is high, indicating a strong trend. MACD has formed a bearish cross below zero on rising volume; the histogram has turned from red to green, accelerating the decline. EMA5 has just crossed below EMA8, turning bearish in the short term. Trading volume has increased 1.8x.
════════════════════
🔔 Follow for first-hand market alerts 🔔
#技术分析 #O #BZ
📌 When trading, check whether the candlestick pattern matches
5
·
--
$O 30-minute golden cross with rising volume and strengthening momentum—has a short-term opportunity arrived? 🔥
════════════════════
🔴 $O 30-minute bullish signal
⚠️ Technical analysis: ADX indicates a clear trend. The MACD DIF has surged above the zero line and is starting to turn bullish. The moving averages are nearly converged, so a direction may be chosen soon. KDJ is currently weak, with bears in control (K37.5 D32.2). Volume has surged to 3.9 times its previous level.
════════════════════
🔔 Follow for the latest market movements 🔔
#技术分析 #O
📌 When trading, check whether the candlestick pattern meets your criteria
$O 30-minute golden cross with rising volume and strengthening momentum—has a short-term opportunity arrived? 🔥
════════════════════
🔴 $O 30-minute bullish signal
⚠️ Technical analysis: ADX indicates a clear trend. The MACD DIF has surged above the zero line and is starting to turn bullish. The moving averages are nearly converged, so a direction may be chosen soon. KDJ is currently weak, with bears in control (K37.5 D32.2). Volume has surged to 3.9 times its previous level.
════════════════════
🔔 Follow for the latest market movements 🔔
#技术分析 #O
📌 When trading, check whether the candlestick pattern meets your criteria
════════════════════
🔴 $O 30-minute bullish signal
⚠️ Technical analysis: ADX indicates a clear trend. The MACD DIF has surged above the zero line and is starting to turn bullish. The moving averages are nearly converged, so a direction may be chosen soon. KDJ is currently weak, with bears in control (K37.5 D32.2). Volume has surged to 3.9 times its previous level.
════════════════════
🔔 Follow for the latest market movements 🔔
#技术分析 #O
📌 When trading, check whether the candlestick pattern meets your criteria
5
$O 30-minute bullish signal confirmation analysis
📈 $O | 30-minute bullish signal
━━━━━━━━━━━━━━━━━━
Technical analysis: ADX (31) indicates a strong trend; MACD DIF crosses above the zero line, signaling a shift to bullish; moving averages are converging, building momentum for a potential change; KDJ is bearish (K37.5 D32.2); volume increased 3.9-fold.
Price change: 0.0900%
━━━━━━━━━━━━━━━━━━
#技术分析 #O
📌 The above is for reference only and does not constitute investment advice
$O 30-minute bullish signal confirmation analysis
📈 $O | 30-minute bullish signal
━━━━━━━━━━━━━━━━━━
Technical analysis: ADX (31) indicates a strong trend; MACD DIF crosses above the zero line, signaling a shift to bullish; moving averages are converging, building momentum for a potential change; KDJ is bearish (K37.5 D32.2); volume increased 3.9-fold.
Price change: 0.0900%
━━━━━━━━━━━━━━━━━━
#技术分析 #O
📌 The above is for reference only and does not constitute investment advice
📈 $O | 30-minute bullish signal
━━━━━━━━━━━━━━━━━━
Technical analysis: ADX (31) indicates a strong trend; MACD DIF crosses above the zero line, signaling a shift to bullish; moving averages are converging, building momentum for a potential change; KDJ is bearish (K37.5 D32.2); volume increased 3.9-fold.
Price change: 0.0900%
━━━━━━━━━━━━━━━━━━
#技术分析 #O
📌 The above is for reference only and does not constitute investment advice
9

·
--
This afternoon, I came across $O 5 minutes and it had jumped 2.14%, with the price now at 0.5418.
My first reaction wasn’t to get carried away, but to check the trading volume (24h: $6.4 million): is this rally driven by capital, or by sentiment?
I’ll wait for a pullback that holds before making a move. Like if you think that makes sense, or leave a comment if you disagree.
#O
This afternoon, I came across $O 5 minutes and it had jumped 2.14%, with the price now at 0.5418.
My first reaction wasn’t to get carried away, but to check the trading volume (24h: $6.4 million): is this rally driven by capital, or by sentiment?
I’ll wait for a pullback that holds before making a move. Like if you think that makes sense, or leave a comment if you disagree.
#O
My first reaction wasn’t to get carried away, but to check the trading volume (24h: $6.4 million): is this rally driven by capital, or by sentiment?
I’ll wait for a pullback that holds before making a move. Like if you think that makes sense, or leave a comment if you disagree.
#O
4

·
--
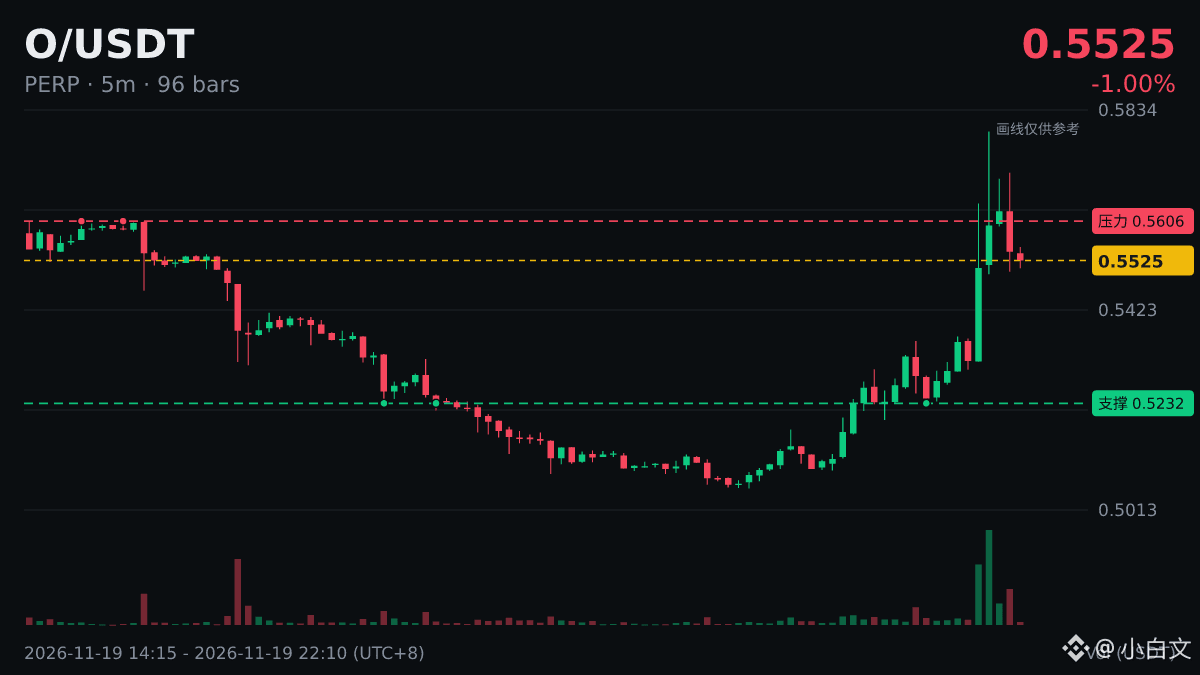
🐋 A 2.21% sell-off over $O 5 minutes, with 24-hour trading volume of $6.6 million.
When large orders cluster, it usually means that some capital is making a statement. Before following, first figure out whether they’re buying or selling.
If the price can hold steady after the drop, that says more than any rebound.
#O
🐋 A 2.21% sell-off over $O 5 minutes, with 24-hour trading volume of $6.6 million.
When large orders cluster, it usually means that some capital is making a statement. Before following, first figure out whether they’re buying or selling.
If the price can hold steady after the drop, that says more than any rebound.
#O
When large orders cluster, it usually means that some capital is making a statement. Before following, first figure out whether they’re buying or selling.
If the price can hold steady after the drop, that says more than any rebound.
#O
14


·
--
Things to note when tracking funds
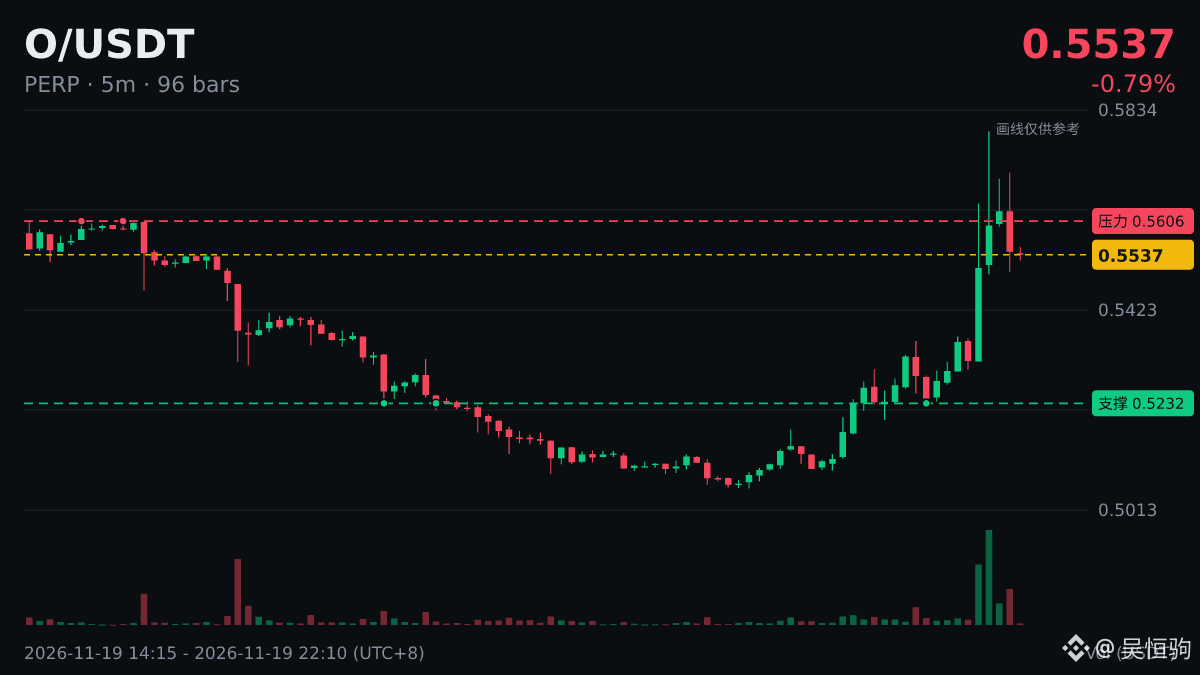
$O A sharp 2.21% drop within 5 minutes; current price: 0.5528.
Down just 2.11% over 24 hours. This looks like a bout of pulse selling; the overall trend hasn't turned bad.
Those with large positions, please be mindful of the risks. Staying in the game is what matters most. Let time tell the rest.
#O
Things to note when tracking funds
$O A sharp 2.21% drop within 5 minutes; current price: 0.5528.
Down just 2.11% over 24 hours. This looks like a bout of pulse selling; the overall trend hasn't turned bad.
Those with large positions, please be mindful of the risks. Staying in the game is what matters most. Let time tell the rest.
#O
$O A sharp 2.21% drop within 5 minutes; current price: 0.5528.
Down just 2.11% over 24 hours. This looks like a bout of pulse selling; the overall trend hasn't turned bad.
Those with large positions, please be mindful of the risks. Staying in the game is what matters most. Let time tell the rest.
#O
209

·
--
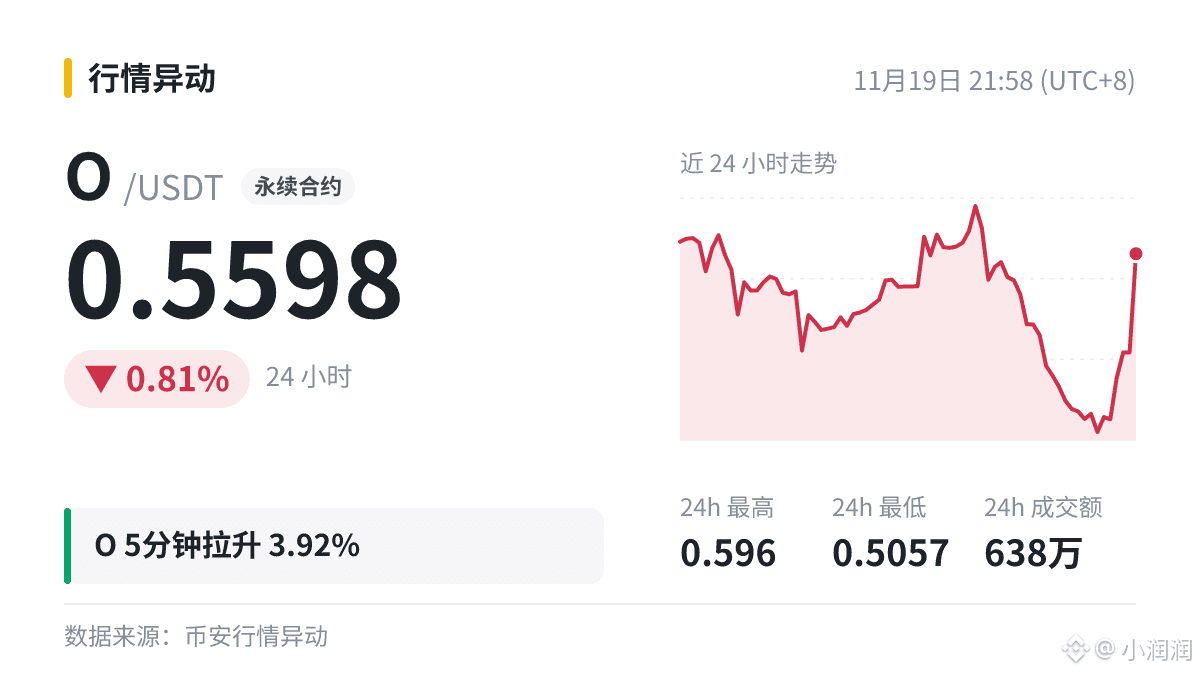
🐋 For the brothers keeping an eye on the money flow: $O 5-minute surge of 3.92%
To judge the quality of buying pressure, I usually watch two details first:
· Are there consecutive aggressive buy orders during the surge?
· Are large orders selling after the price reaches a high?
For reference: 24h trading volume is $6.38 million, 24h change is -0.81%. Only when the first is present and the second is absent can this surge be considered backed by real money.
#O
🐋 For the brothers keeping an eye on the money flow: $O 5-minute surge of 3.92%
To judge the quality of buying pressure, I usually watch two details first:
· Are there consecutive aggressive buy orders during the surge?
· Are large orders selling after the price reaches a high?
For reference: 24h trading volume is $6.38 million, 24h change is -0.81%. Only when the first is present and the second is absent can this surge be considered backed by real money.
#O
To judge the quality of buying pressure, I usually watch two details first:
· Are there consecutive aggressive buy orders during the surge?
· Are large orders selling after the price reaches a high?
For reference: 24h trading volume is $6.38 million, 24h change is -0.81%. Only when the first is present and the second is absent can this surge be considered backed by real money.
#O

·
--
🐳 Capital flow perspective:
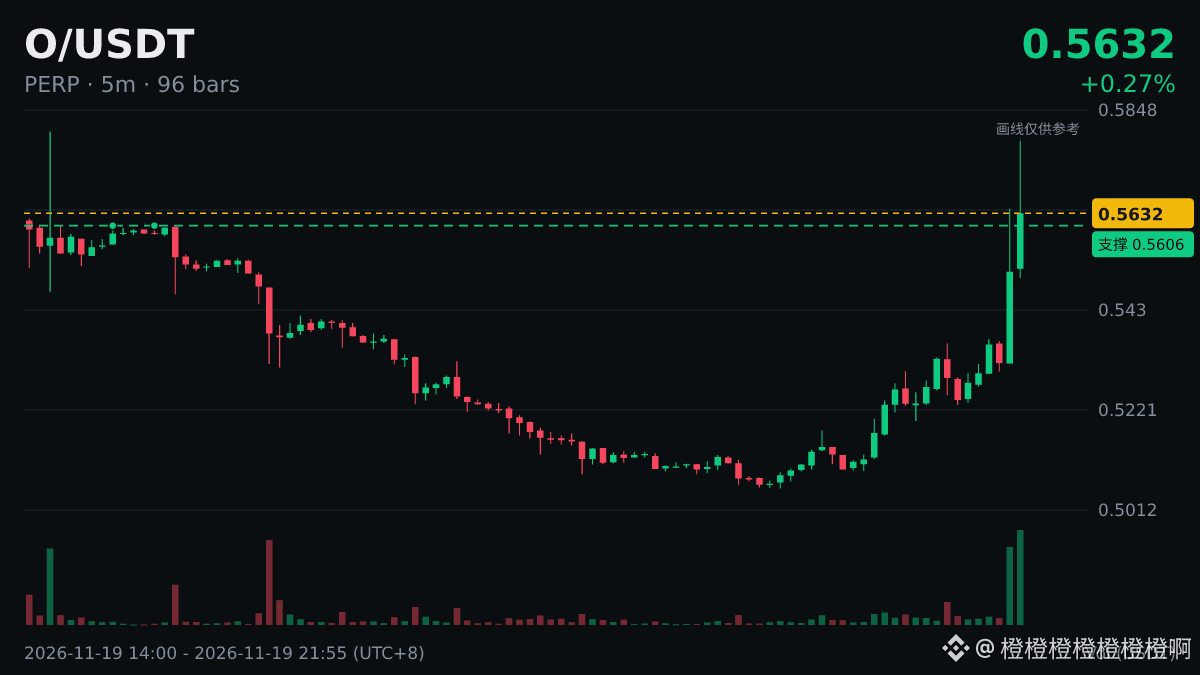
$O surged +6.64% in 5 minutes, with the current price at 0.5634 and 24-hour trading volume of $6.36 million.
A closer look at capital flows:
· The gains were concentrated in a brief 5-minute period, suggesting urgent buying pressure
· The 24-hour change is still -0.14%, pointing to short-term capital
· Next, watch whether aggressive buy orders continue; if they don't, gains could easily be given back
If you find this insightful, give it a like. If you disagree, share your thoughts in the comments.
#O
🐳 Capital flow perspective:
$O surged +6.64% in 5 minutes, with the current price at 0.5634 and 24-hour trading volume of $6.36 million.
A closer look at capital flows:
· The gains were concentrated in a brief 5-minute period, suggesting urgent buying pressure
· The 24-hour change is still -0.14%, pointing to short-term capital
· Next, watch whether aggressive buy orders continue; if they don't, gains could easily be given back
If you find this insightful, give it a like. If you disagree, share your thoughts in the comments.
#O
$O surged +6.64% in 5 minutes, with the current price at 0.5634 and 24-hour trading volume of $6.36 million.
A closer look at capital flows:
· The gains were concentrated in a brief 5-minute period, suggesting urgent buying pressure
· The 24-hour change is still -0.14%, pointing to short-term capital
· Next, watch whether aggressive buy orders continue; if they don't, gains could easily be given back
If you find this insightful, give it a like. If you disagree, share your thoughts in the comments.
#O

·
--
Watch the money, not the talk:
$O 5-minute rally of +6.64%, current price 0.5604, 24h trading volume of $6.35 million.
A breakdown of the capital flows:
The gains were concentrated in just 5 minutes, which means buying was highly concentrated.
The 24h change is still -0.67%, suggesting short-term capital is at play.
Watch whether aggressive buy orders continue; if they stop, gains could easily be given back.
Keep an eye on it—we’ll share updates as soon as anything unusual happens.
#O
Just sharing my thoughts; this is not investment advice.
Watch the money, not the talk:
$O 5-minute rally of +6.64%, current price 0.5604, 24h trading volume of $6.35 million.
A breakdown of the capital flows:
The gains were concentrated in just 5 minutes, which means buying was highly concentrated.
The 24h change is still -0.67%, suggesting short-term capital is at play.
Watch whether aggressive buy orders continue; if they stop, gains could easily be given back.
Keep an eye on it—we’ll share updates as soon as anything unusual happens.
#O
Just sharing my thoughts; this is not investment advice.
$O 5-minute rally of +6.64%, current price 0.5604, 24h trading volume of $6.35 million.
A breakdown of the capital flows:
The gains were concentrated in just 5 minutes, which means buying was highly concentrated.
The 24h change is still -0.67%, suggesting short-term capital is at play.
Watch whether aggressive buy orders continue; if they stop, gains could easily be given back.
Keep an eye on it—we’ll share updates as soon as anything unusual happens.
#O
Just sharing my thoughts; this is not investment advice.

·
--
【$O Short-Term Rally Review】
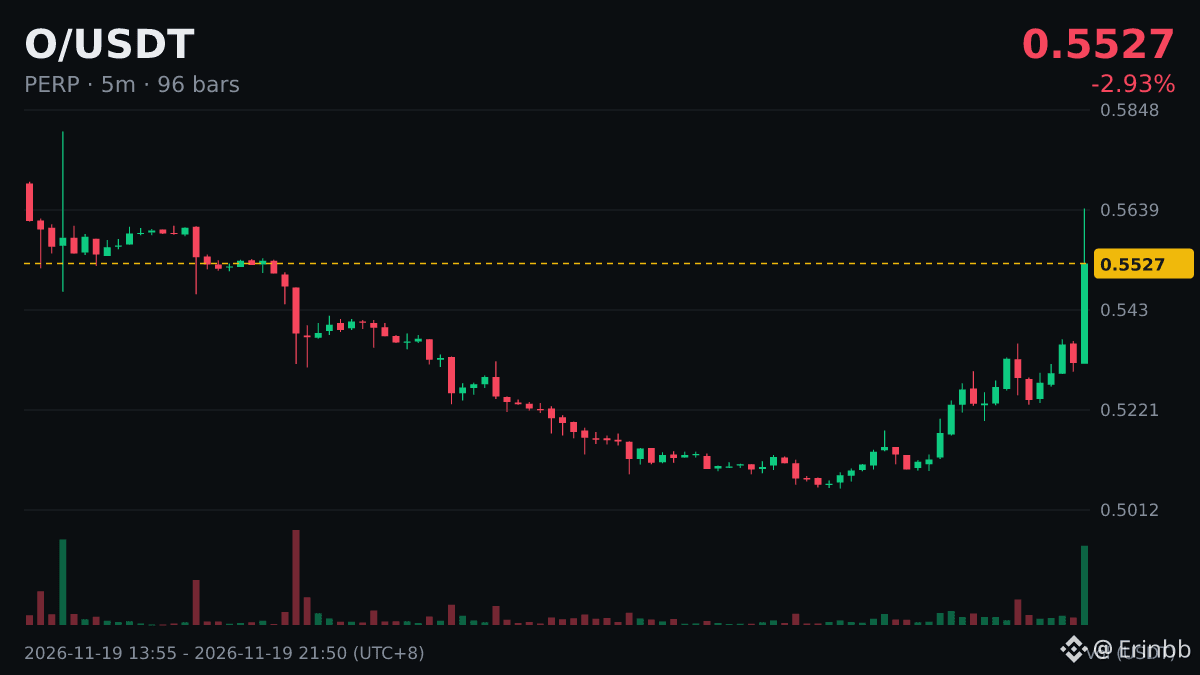
1) Up 6.64% in 5 minutes; current price 0.5676, up 0.58% over 24 hours.
2) The 24-hour high of 0.596 is the nearest resistance. Avoid being too aggressive until the price breaks above it.
3) 24-hour trading volume is $6.3 million. A rally is more credible when accompanied by sustained increases in volume; be wary of a pullback if prices surge on low volume.
Summary: The outlook leans bullish, but don't chase a sudden rally. It's safer to wait for a pullback that holds support.
Which way do you think it'll go? Share your thoughts in the comments.
#O
【$O Short-Term Rally Review】
1) Up 6.64% in 5 minutes; current price 0.5676, up 0.58% over 24 hours.
2) The 24-hour high of 0.596 is the nearest resistance. Avoid being too aggressive until the price breaks above it.
3) 24-hour trading volume is $6.3 million. A rally is more credible when accompanied by sustained increases in volume; be wary of a pullback if prices surge on low volume.
Summary: The outlook leans bullish, but don't chase a sudden rally. It's safer to wait for a pullback that holds support.
Which way do you think it'll go? Share your thoughts in the comments.
#O
1) Up 6.64% in 5 minutes; current price 0.5676, up 0.58% over 24 hours.
2) The 24-hour high of 0.596 is the nearest resistance. Avoid being too aggressive until the price breaks above it.
3) 24-hour trading volume is $6.3 million. A rally is more credible when accompanied by sustained increases in volume; be wary of a pullback if prices surge on low volume.
Summary: The outlook leans bullish, but don't chase a sudden rally. It's safer to wait for a pullback that holds support.
Which way do you think it'll go? Share your thoughts in the comments.
#O
3

·
--
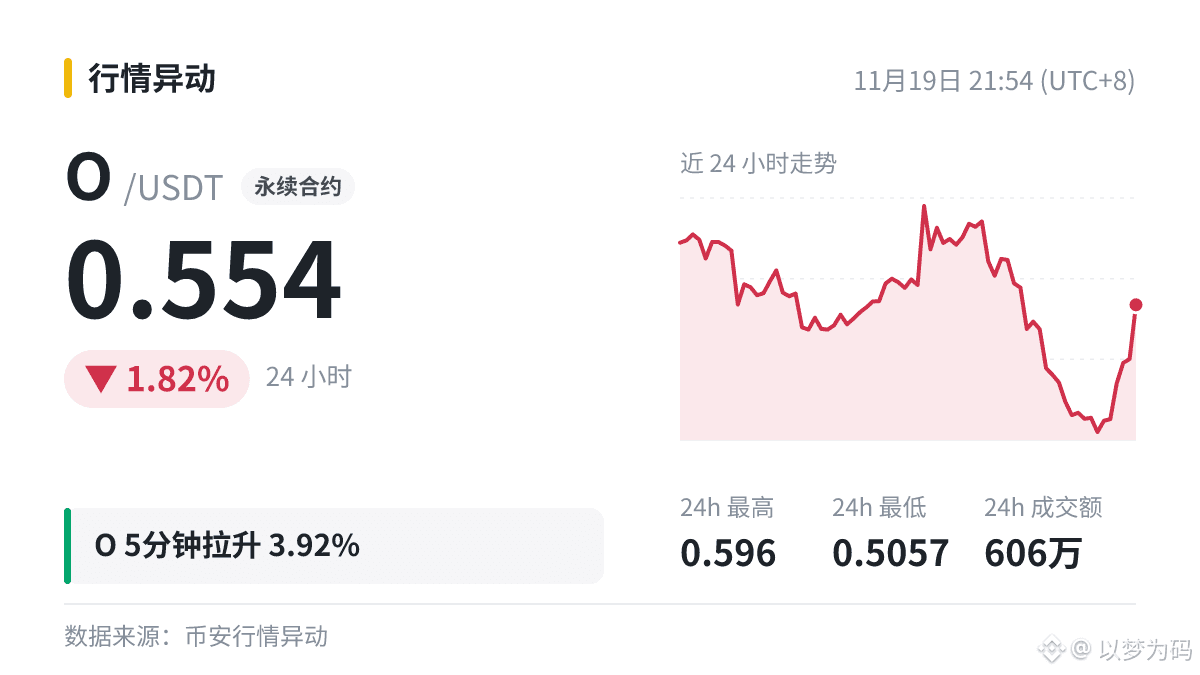
🐋 A 3.92% surge in $O 5 minutes, with 24h trading volume of $6.06 million.
When large orders are concentrated, it often means a major player is making a statement. Before following them, first figure out whether they’re buying or selling.
The uptrend looks good, but the market is no stranger to pump-and-dump scenarios, so it pays to stay alert.
#O
🐋 A 3.92% surge in $O 5 minutes, with 24h trading volume of $6.06 million.
When large orders are concentrated, it often means a major player is making a statement. Before following them, first figure out whether they’re buying or selling.
The uptrend looks good, but the market is no stranger to pump-and-dump scenarios, so it pays to stay alert.
#O
When large orders are concentrated, it often means a major player is making a statement. Before following them, first figure out whether they’re buying or selling.
The uptrend looks good, but the market is no stranger to pump-and-dump scenarios, so it pays to stay alert.
#O
7

·
--
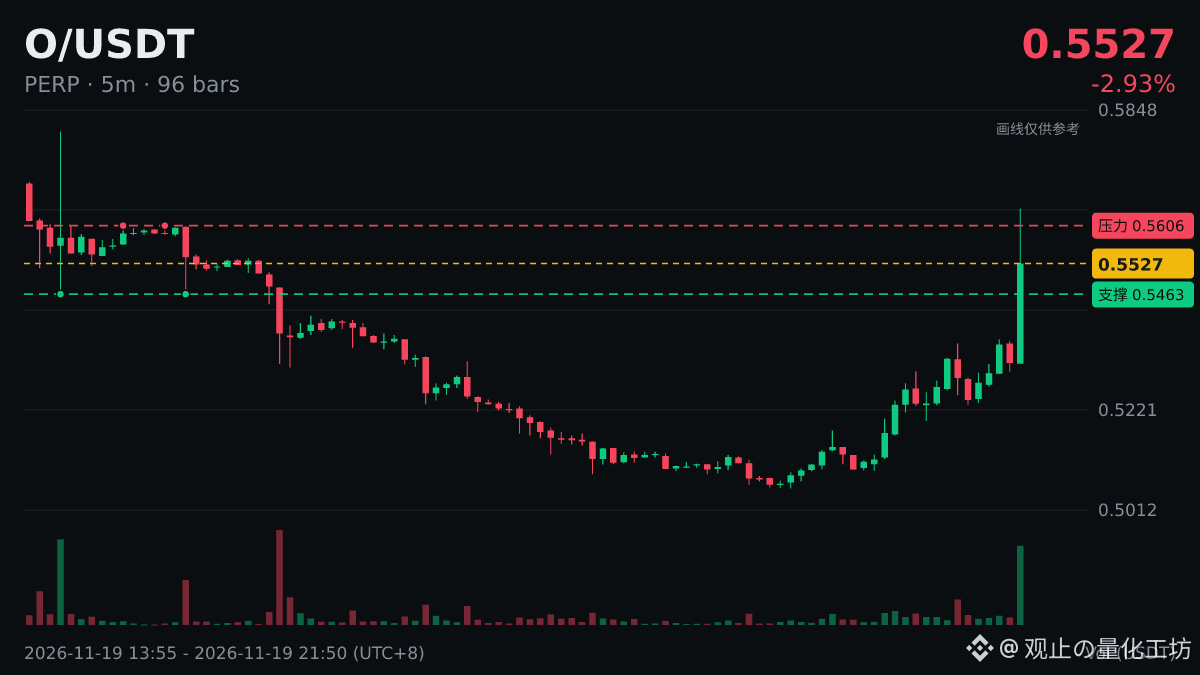
Honestly, with this 5-minute move up 3.92%, $O , the first thing I checked was the trading volume ($6.05 million in 24h).
Why check volume first? I’ve learned this the hard way: a rally on low volume can easily be just a spike, and if you chase it, you can get trapped.
This time the gain is fairly moderate, so it’s worth watching a little longer.
What do you usually check first when you see a rally?
#O
Honestly, with this 5-minute move up 3.92%, $O , the first thing I checked was the trading volume ($6.05 million in 24h).
Why check volume first? I’ve learned this the hard way: a rally on low volume can easily be just a spike, and if you chase it, you can get trapped.
This time the gain is fairly moderate, so it’s worth watching a little longer.
What do you usually check first when you see a rally?
#O
Why check volume first? I’ve learned this the hard way: a rally on low volume can easily be just a spike, and if you chase it, you can get trapped.
This time the gain is fairly moderate, so it’s worth watching a little longer.
What do you usually check first when you see a rally?
#O
1

·
--
$O hit a new 24-hour low of 0.5223, breaking below the previous low of 0.5288.
It was doing fine just a moment ago, then suddenly came crashing down. In a weak market, staying on the sidelines is often a strategy. Are you more worried about missing out or getting stuck holding?
#O
$O hit a new 24-hour low of 0.5223, breaking below the previous low of 0.5288.
It was doing fine just a moment ago, then suddenly came crashing down. In a weak market, staying on the sidelines is often a strategy. Are you more worried about missing out or getting stuck holding?
#O
It was doing fine just a moment ago, then suddenly came crashing down. In a weak market, staying on the sidelines is often a strategy. Are you more worried about missing out or getting stuck holding?
#O
61

·
--
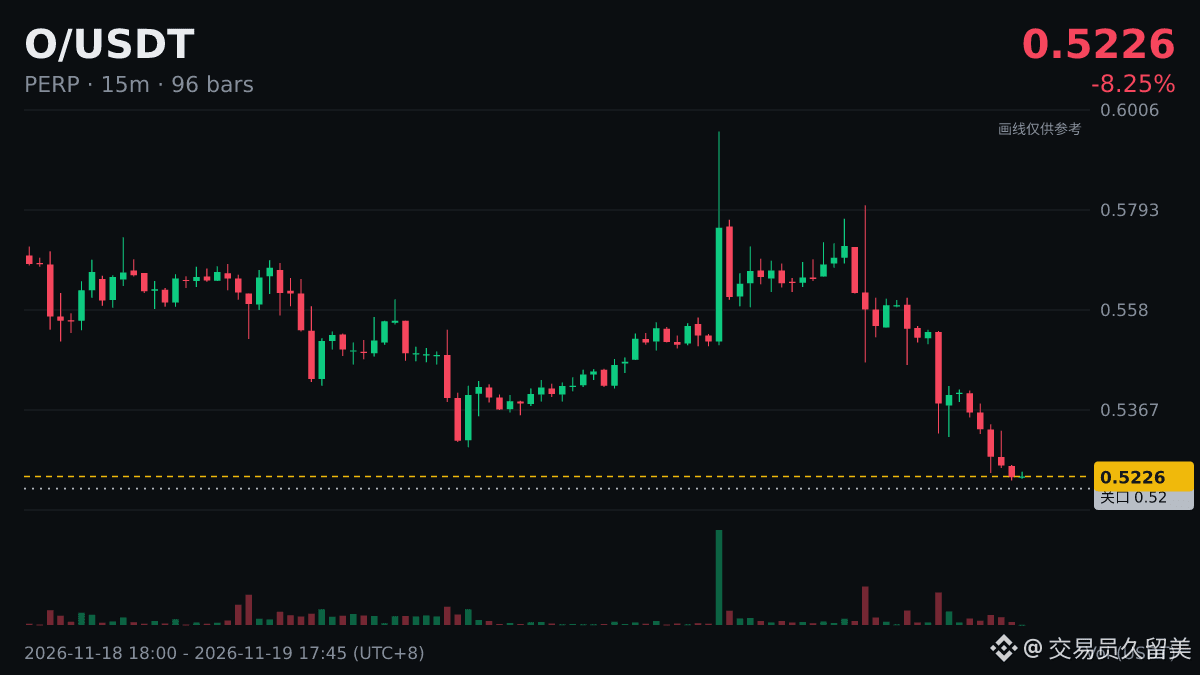
$O 24-hour new low confirmed.
24h -8.03%, current price 0.5226, previous low 0.5288.
Structurally, a new low means the bulls’ defense has failed. First, watch whether the rebound can reclaim the previous low; if it can’t, the weakness will likely continue. Only a move back above it could potentially form a bottoming structure. In one sentence, what’s your current view?
#O
$O 24-hour new low confirmed.
24h -8.03%, current price 0.5226, previous low 0.5288.
Structurally, a new low means the bulls’ defense has failed. First, watch whether the rebound can reclaim the previous low; if it can’t, the weakness will likely continue. Only a move back above it could potentially form a bottoming structure. In one sentence, what’s your current view?
#O
24h -8.03%, current price 0.5226, previous low 0.5288.
Structurally, a new low means the bulls’ defense has failed. First, watch whether the rebound can reclaim the previous low; if it can’t, the weakness will likely continue. Only a move back above it could potentially form a bottoming structure. In one sentence, what’s your current view?
#O
4

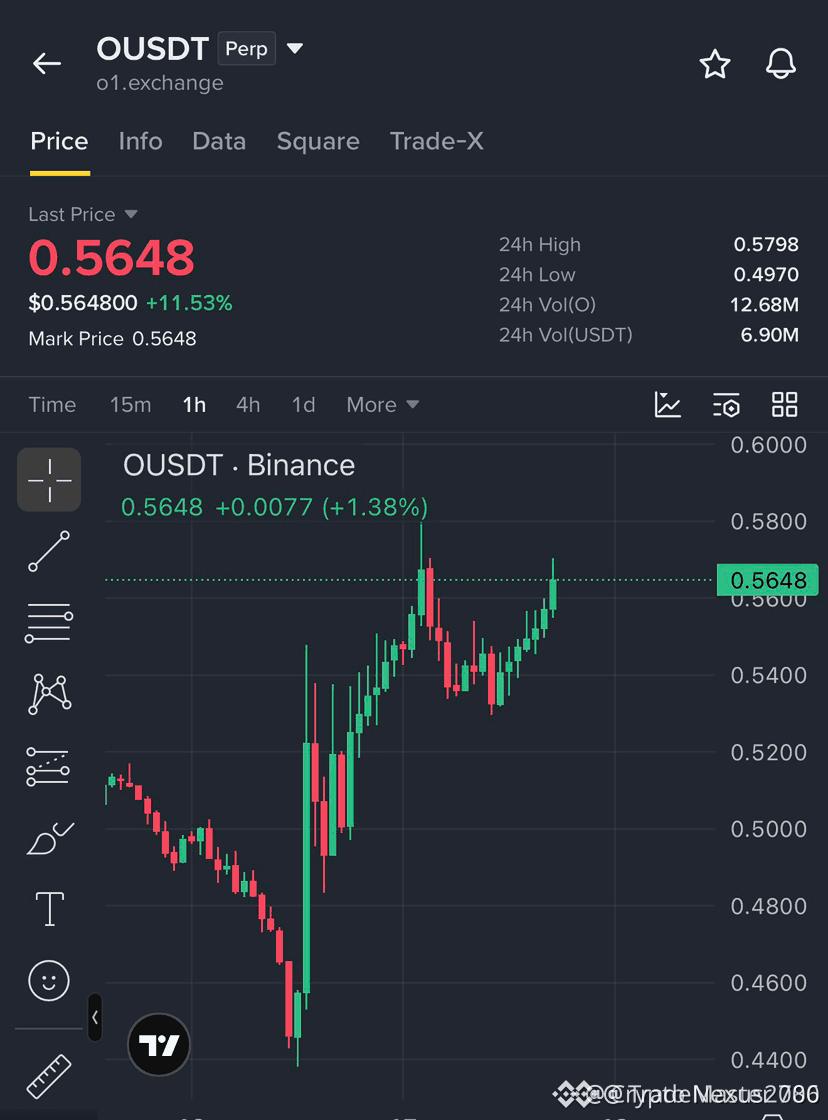
🦈 $O APPROACHING A CRUCIAL DEMAND RETEST TO VALIDATE SMART MONEY ACCUMULATION! ⚡
Entry: 0.5500 ⚡
Target: 0.5798 🚀
Stop Loss: 0.5350 ⚠️
Institutional order flow shows aggressive defense building around this key structural floor. If smart money successfully absorbs the lingering sell-side pressure during this retest, expect a swift liquidity sweep toward upper resistance. 📊
Market microstructure points to a clean efficiency fill once 0.5500 secures confirmation. Risk parameters remain tight, giving us an immaculate asymmetry setup. 💡
💬 Are you positioning ahead of the retest or waiting for a confirmed candle close? 👇
⚠️ Not financial advice. Always manage your risk. 🛡️
🏷️ #O #LongSetup #OrderBlock #Crypto
🦈 ⚡
🦈 $O APPROACHING A CRUCIAL DEMAND RETEST TO VALIDATE SMART MONEY ACCUMULATION! ⚡
Entry: 0.5500 ⚡
Target: 0.5798 🚀
Stop Loss: 0.5350 ⚠️
Institutional order flow shows aggressive defense building around this key structural floor. If smart money successfully absorbs the lingering sell-side pressure during this retest, expect a swift liquidity sweep toward upper resistance. 📊
Market microstructure points to a clean efficiency fill once 0.5500 secures confirmation. Risk parameters remain tight, giving us an immaculate asymmetry setup. 💡
💬 Are you positioning ahead of the retest or waiting for a confirmed candle close? 👇
⚠️ Not financial advice. Always manage your risk. 🛡️
🏷️ #O #LongSetup #OrderBlock #Crypto
🦈 ⚡
Entry: 0.5500 ⚡
Target: 0.5798 🚀
Stop Loss: 0.5350 ⚠️
Institutional order flow shows aggressive defense building around this key structural floor. If smart money successfully absorbs the lingering sell-side pressure during this retest, expect a swift liquidity sweep toward upper resistance. 📊
Market microstructure points to a clean efficiency fill once 0.5500 secures confirmation. Risk parameters remain tight, giving us an immaculate asymmetry setup. 💡
💬 Are you positioning ahead of the retest or waiting for a confirmed candle close? 👇
⚠️ Not financial advice. Always manage your risk. 🛡️
🏷️ #O #LongSetup #OrderBlock #Crypto
🦈 ⚡
1

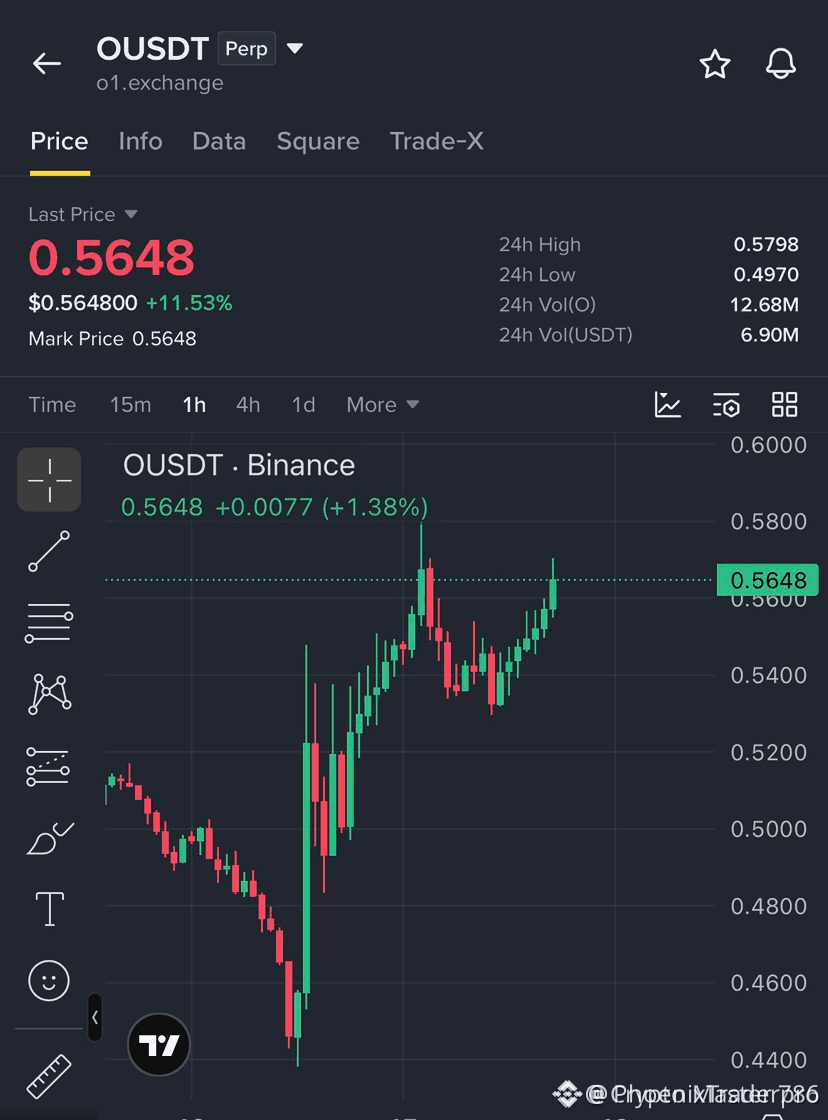
🦈 $O IS SQUARING UP FOR A CLEAN RETEST OF KEY SUPPORT AROUND 0.5500! ⚡
Entry: 0.5500 ⚡
Target: 0.5798 🚀
Stop Loss: 0.5350 🛑
Smart money loves a textbook retest where sellers exhaust their ammunition right at the historical demand shelf 🌊. Volume is thinning out on the pullback, signaling that weak hands are out and patient bids are stepping up to defend the line 📊.
As long as momentum holds this critical floor, the path of least resistance points straight toward the upper liquidity pocket ⚡. Are you front-running the bounce or waiting for confirmation on the lower timeframe 👇?
⚠️ Not financial advice. Always manage your risk. 🛡️
🏷️ #O #LongSetup #Crypto #Breakout #Altcoins
🔥 💎
🦈 $O IS SQUARING UP FOR A CLEAN RETEST OF KEY SUPPORT AROUND 0.5500! ⚡
Entry: 0.5500 ⚡
Target: 0.5798 🚀
Stop Loss: 0.5350 🛑
Smart money loves a textbook retest where sellers exhaust their ammunition right at the historical demand shelf 🌊. Volume is thinning out on the pullback, signaling that weak hands are out and patient bids are stepping up to defend the line 📊.
As long as momentum holds this critical floor, the path of least resistance points straight toward the upper liquidity pocket ⚡. Are you front-running the bounce or waiting for confirmation on the lower timeframe 👇?
⚠️ Not financial advice. Always manage your risk. 🛡️
🏷️ #O #LongSetup #Crypto #Breakout #Altcoins
🔥 💎
Entry: 0.5500 ⚡
Target: 0.5798 🚀
Stop Loss: 0.5350 🛑
Smart money loves a textbook retest where sellers exhaust their ammunition right at the historical demand shelf 🌊. Volume is thinning out on the pullback, signaling that weak hands are out and patient bids are stepping up to defend the line 📊.
As long as momentum holds this critical floor, the path of least resistance points straight toward the upper liquidity pocket ⚡. Are you front-running the bounce or waiting for confirmation on the lower timeframe 👇?
⚠️ Not financial advice. Always manage your risk. 🛡️
🏷️ #O #LongSetup #Crypto #Breakout #Altcoins
🔥 💎
5

·
--
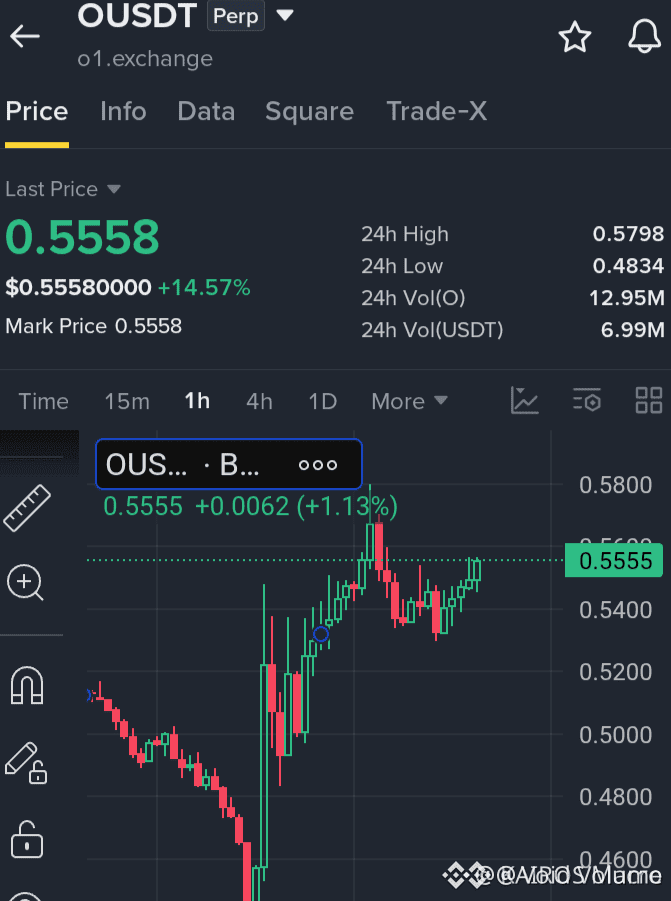
🦈 $O DEFENDING CRITICAL INSTITUTIONAL ACCUMULATION NEAR THE 0.5400 DEMAND ZONE! ⚡
Entry: 0.5400 ⚡
Target: 0.5900 🚀
Stop Loss: 0.5100 ⚠️
Smart money footprints are clearly visible as price taps into this structural liquidity pool around 0.5400, absorbing incoming retail supply. Order flow dynamics indicate aggressive absorption before any potential markup phase toward higher inefficiency zones. 📊
Risk parameters are structurally defined below the recent swing pivot, protecting capital against unexpected sweep velocity. 📌
💬 Are you positioning alongside institutional accumulation here or waiting for confirmation above range resistance? 👇
⚠️ Not financial advice. Always manage your risk. 🛡️
🏷️ #O #SmartMoney #LiquidityPool #OrderBlock #Crypto
🦈 ⚖️
🦈 $O DEFENDING CRITICAL INSTITUTIONAL ACCUMULATION NEAR THE 0.5400 DEMAND ZONE! ⚡
Entry: 0.5400 ⚡
Target: 0.5900 🚀
Stop Loss: 0.5100 ⚠️
Smart money footprints are clearly visible as price taps into this structural liquidity pool around 0.5400, absorbing incoming retail supply. Order flow dynamics indicate aggressive absorption before any potential markup phase toward higher inefficiency zones. 📊
Risk parameters are structurally defined below the recent swing pivot, protecting capital against unexpected sweep velocity. 📌
💬 Are you positioning alongside institutional accumulation here or waiting for confirmation above range resistance? 👇
⚠️ Not financial advice. Always manage your risk. 🛡️
🏷️ #O #SmartMoney #LiquidityPool #OrderBlock #Crypto
🦈 ⚖️
Entry: 0.5400 ⚡
Target: 0.5900 🚀
Stop Loss: 0.5100 ⚠️
Smart money footprints are clearly visible as price taps into this structural liquidity pool around 0.5400, absorbing incoming retail supply. Order flow dynamics indicate aggressive absorption before any potential markup phase toward higher inefficiency zones. 📊
Risk parameters are structurally defined below the recent swing pivot, protecting capital against unexpected sweep velocity. 📌
💬 Are you positioning alongside institutional accumulation here or waiting for confirmation above range resistance? 👇
⚠️ Not financial advice. Always manage your risk. 🛡️
🏷️ #O #SmartMoney #LiquidityPool #OrderBlock #Crypto
🦈 ⚖️
6
Log in to explore more content
Join global crypto users on Binance Square
⚡️ Get latest and useful information about crypto.
💬 Trusted by the world’s largest crypto exchange.
👍 Discover real insights from verified creators.
Email / Phone number
Trending Topics
1
#CanBTCReboundAfterFallingBelow60K?
272,929 views
1,229 Discussing
2
#GlobalStocksFaceLongestLosingStreakSince2023
92,503 views
899 Discussing
3
#AnthropicPlungesTowardIPOPriceonDay2
45,433 views
474 Discussing
4
#TwentyOneCapitalAdds172.25BTC
876 views
57 Discussing
5
#HKBillWouldExcludeTokenizedDepositsFromVirtualAssets
232 views
10 Discussing
6
#BNBDropsBelow540USDTWith8.46%DailyDecline
20,454 views
164 Discussing
7
#HKBillProposesHK$100KFineForUnauthorizedCryptoTitles
702 views
12 Discussing
8
#BitMineFaces$10.1BUnrealizedETHLoss
1,554 views
15 Discussing
9
#StrategyReports$35BNetReserves
1,098 views
14 Discussing
10
#MorganStanleyEndsAnthropicStockSupportAfterOneDay
9,319 views
114 Discussing