

#eth
eth
4.5G views
26.9M Discussing
Hot
Latest

·
--
Bullish
BNB & ETH: The Power Couple 👑💎
$BNB is the KING of Binance, $ETH is the QUEEN of crypto! Together they run the Bentley life!
My two biggest holdings for next bull run! Which one is your favourite?
Not Financial Advice
$ETH #BNB #ETH #BinancePick #CryptoLife
{spot}(BNBUSDT)
{spot}(ETHUSDT)
BNB & ETH: The Power Couple 👑💎
$BNB is the KING of Binance, $ETH is the QUEEN of crypto! Together they run the Bentley life!
My two biggest holdings for next bull run! Which one is your favourite?
Not Financial Advice
$ETH #BNB #ETH #BinancePick #CryptoLife
$BNB is the KING of Binance, $ETH is the QUEEN of crypto! Together they run the Bentley life!
My two biggest holdings for next bull run! Which one is your favourite?
Not Financial Advice
$ETH #BNB #ETH #BinancePick #CryptoLife

52


Article
ETH WEEKLY ANALYSIS: A BIG MOVE AHEAD? 🚀$ETH continues to hold above the 50-week moving average (MA50) for the 6th time, showing resilience despite $BTC Dominance rising above 60% and ongoing uncertainty in global markets.
{spot}(ETHUSDT)
However, Ethereum remains trapped in the $2,300–$2,800 range. Bulls and bears are battling for control, and a decisive breakout or breakdown could set the direction for the next major move.
⚠️ Momentum Alert: The weekly Stochastic RSI is showing bearish momentum, meaning another shakeout remains possible if ETH loses key support.
🎯 Key Levels to Watch:
🟢 Support: $2,300 — A breakdown could open the door toward $1,900.
🔴 Resistance 1: $2,550
🔴 Resistance 2: $2,800 — A breakout could strengthen the bullish case.
📈 Bullish scenario: ETH holds $2,300 and reclaims $2,550, potentially setting up a retest of $2,800.
📉 Bearish scenario: ETH loses $2,300, increasing the risk of a deeper correction toward $1,900.
👀 My take: The $2,300–$2,800 range is the key battleground. Watch for confirmation before taking a position—don't let emotions control your trades.
What do you think? Will ETH break above $2,800 or drop toward $1,900? 👇
#ETH #Ethereum #CryptoAnalysis #BitcoinDominance #CryptoMarket #Altcoins #BinanceSquareTalks #TradingStrategy
ETH WEEKLY ANALYSIS: A BIG MOVE AHEAD? 🚀
$ETH continues to hold above the 50-week moving average (MA50) for the 6th time, showing resilience despite $BTC Dominance rising above 60% and ongoing uncertainty in global markets.
However, Ethereum remains trapped in the $2,300–$2,800 range. Bulls and bears are battling for control, and a decisive breakout or breakdown could set the direction for the next major move.
⚠️ Momentum Alert: The weekly Stochastic RSI is showing bearish momentum, meaning another shakeout remains possible if ETH loses key support.
🎯 Key Levels to Watch:
🟢 Support: $2,300 — A breakdown could open the door toward $1,900.
🔴 Resistance 1: $2,550
🔴 Resistance 2: $2,800 — A breakout could strengthen the bullish case.
📈 Bullish scenario: ETH holds $2,300 and reclaims $2,550, potentially setting up a retest of $2,800.
📉 Bearish scenario: ETH loses $2,300, increasing the risk of a deeper correction toward $1,900.
👀 My take: The $2,300–$2,800 range is the key battleground. Watch for confirmation before taking a position—don't let emotions control your trades.
What do you think? Will ETH break above $2,800 or drop toward $1,900? 👇
#ETH #Ethereum #CryptoAnalysis #BitcoinDominance #CryptoMarket #Altcoins #BinanceSquareTalks #TradingStrategy
48


·
--
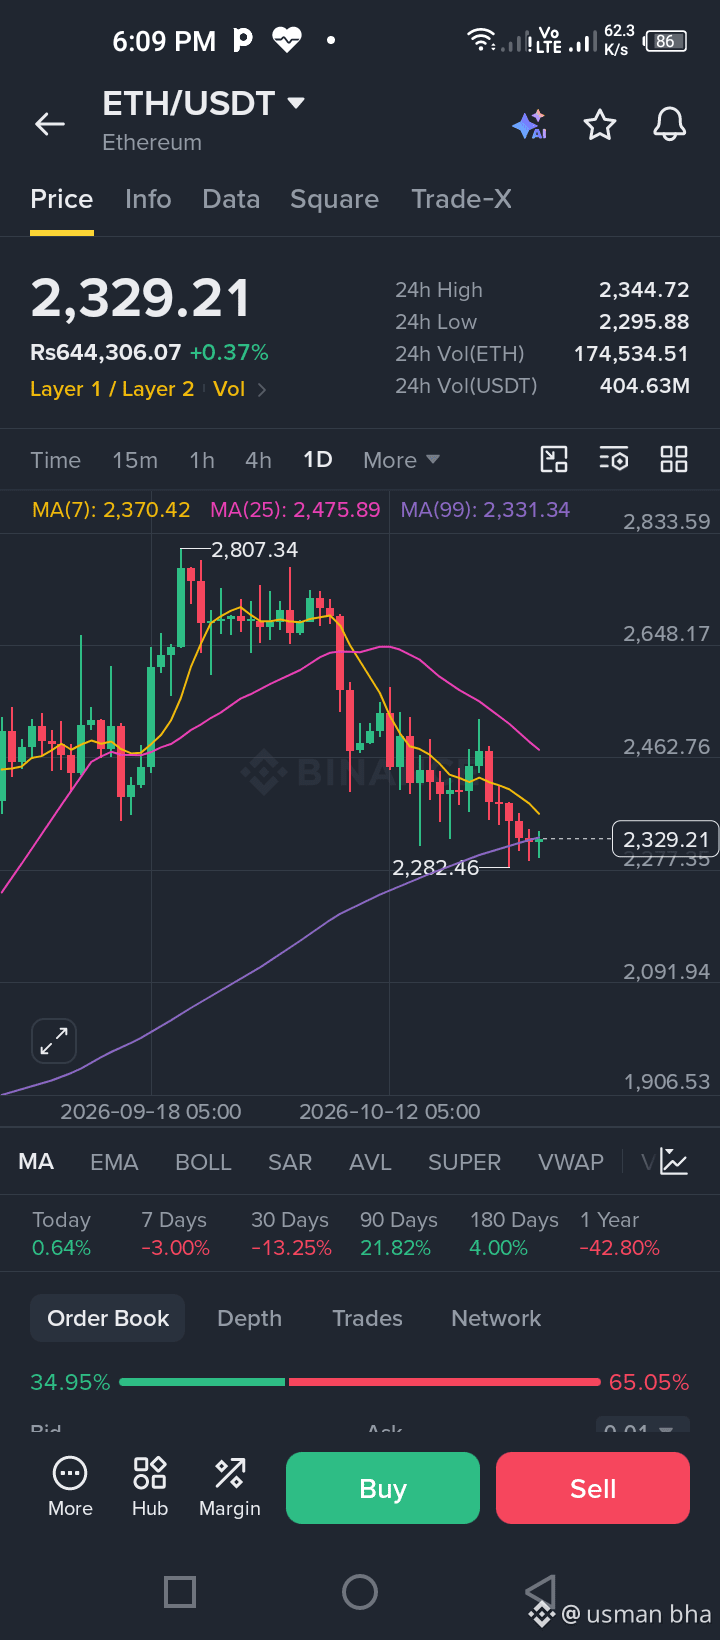
This market is absolutely frustrating! 😤 If I were taking a short-term trade, I’d be looking to short $ETH . Once TP1 hits, I’d move my stop-loss to breakeven to protect my capital. 🎯
No need to take unnecessary risks — trade smart and stay safe! 🛡️
#ETH
This market is absolutely frustrating! 😤 If I were taking a short-term trade, I’d be looking to short $ETH . Once TP1 hits, I’d move my stop-loss to breakeven to protect my capital. 🎯
No need to take unnecessary risks — trade smart and stay safe! 🛡️
#ETH
No need to take unnecessary risks — trade smart and stay safe! 🛡️
#ETH
8


·
--
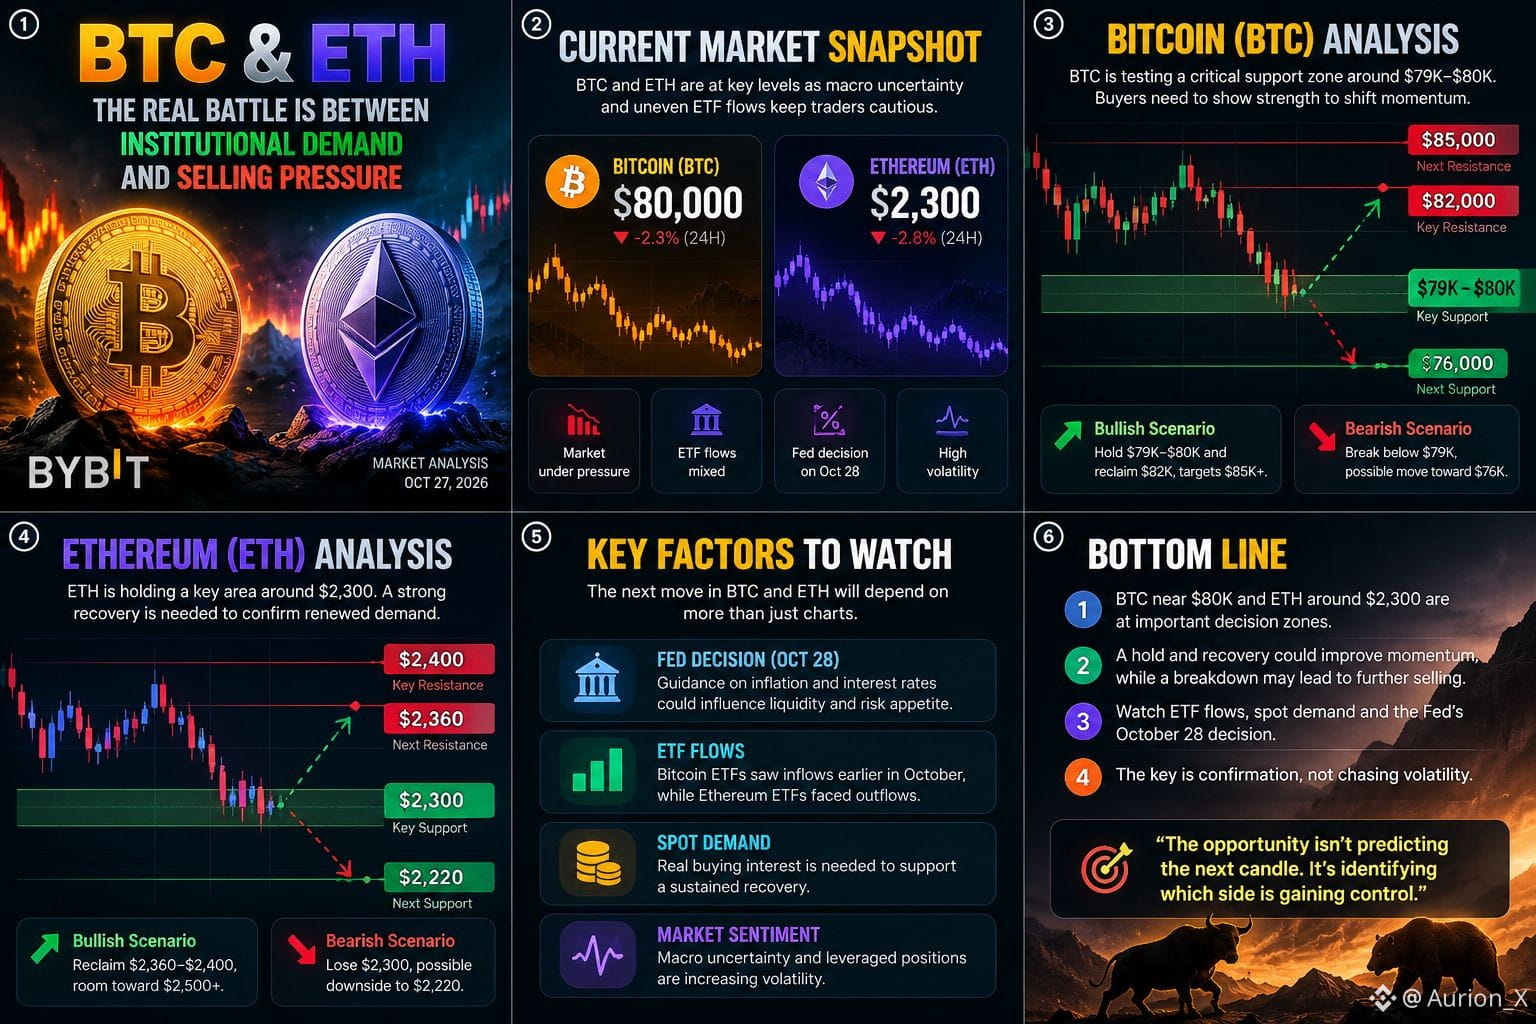
BTC & ETH: The Real Battle Is Between Institutional Demand and Selling Pressure
Bitcoin and Ethereum are entering a critical phase where market structure matters more than bullish narratives. $BTC is hovering around the $80,000 zone, while $ETH is trading near $2,300. Both assets face a test of buyer conviction as macro uncertainty and uneven ETF flows influence sentiment.
Recent market data shows an important divergence: Bitcoin ETFs recorded weekly inflows earlier in October, while Ethereum ETFs experienced outflows. Yet BTC has also faced selling pressure, proving that institutional demand alone cannot guarantee an immediate rally.
Bitcoin (BTC): The $79K–$80K region is the key area to monitor. Holding support and reclaiming $82K could improve momentum. A sustained breakdown below support would increase downside risk.
Ethereum (ETH): The $2,300 area is an important near-term level. Reclaiming $2,360–$2,400 could signal improving demand, while a breakdown may expose lower support zones.
The next major catalyst is the Federal Reserve's October 28 decision. Its messaging on inflation and interest rates could influence liquidity and risk appetite across crypto markets.
My approach is to wait for confirmation rather than chase volatility. Strong spot buying, improving ETF flows and successful resistance retests would strengthen the bullish case. Continued outflows and failed support would favor caution.
The opportunity isn't predicting the next candle. It's identifying which side is gaining control.
#Bitcoin #BTC #Ethereum #ETH
331

·
--
$ETH /USDT looking weak after rejection from $2,526 high? 👀
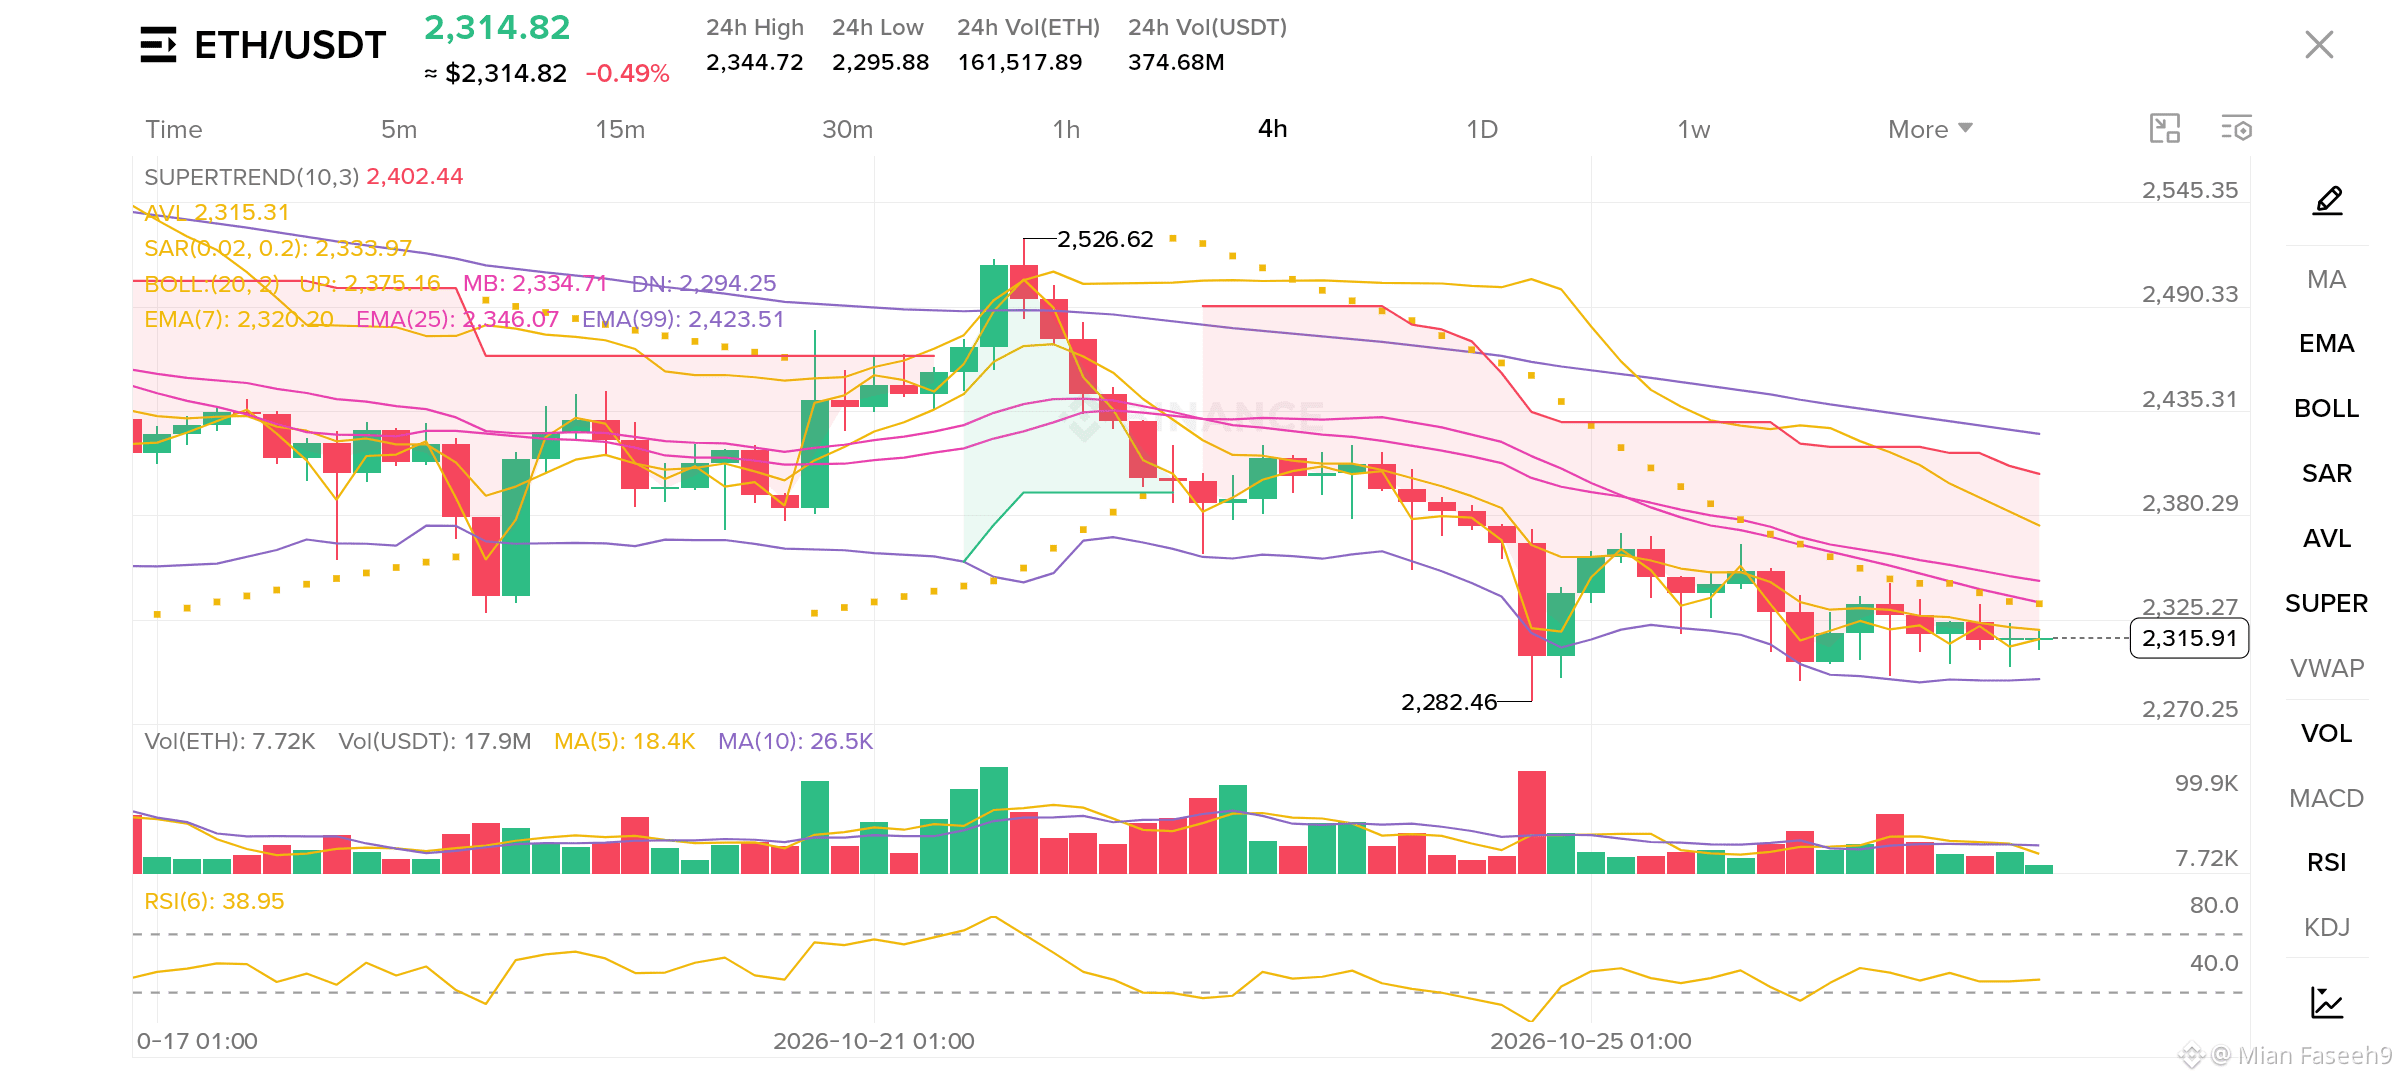
$ETH is down to $2,314.82 (-0.49%) and struggling below EMA(7) $2,320.20 - buyers are not in control yet. 24h High $2,344.72 and 24h Low $2,295.88, volume is low at 374.68M.
Bollinger MB is at $2,334.71 and that's acting as strong resistance. Immediate support is BOLL DN $2,294.25. If we lose $2,294 with volume, next support is $2,282.46. Resistance is AVL $2,315.31 and SAR $2,333.97.
Supertrend $2,402.44 is still far above, trend is bearish until we break it. EMA(25) $2,346.07 and EMA(99) $2,423.51 are also heavy resistances.
RSI(6) is at 38.95 - near oversold but not bouncing yet, still room to go down. Volume is slowly decreasing with red candles, sellers are still active.
I'm watching $2,294.25 breakdown closely. A 4h close below it could push us quickly towards $2,270 and then $2,250. A close above $2,320 could give relief bounce to $2,346.
What do you think, is this the bottom for ETH or more downside coming?
Follow for real-time $ETH updates, no fake signals.
If this analysis helped you, a small Tip is appreciated 🙏
#ETH #Ethereum #ETHUSDT
{spot}(ETHUSDT)
$ETH /USDT looking weak after rejection from $2,526 high? 👀
$ETH is down to $2,314.82 (-0.49%) and struggling below EMA(7) $2,320.20 - buyers are not in control yet. 24h High $2,344.72 and 24h Low $2,295.88, volume is low at 374.68M.
Bollinger MB is at $2,334.71 and that's acting as strong resistance. Immediate support is BOLL DN $2,294.25. If we lose $2,294 with volume, next support is $2,282.46. Resistance is AVL $2,315.31 and SAR $2,333.97.
Supertrend $2,402.44 is still far above, trend is bearish until we break it. EMA(25) $2,346.07 and EMA(99) $2,423.51 are also heavy resistances.
RSI(6) is at 38.95 - near oversold but not bouncing yet, still room to go down. Volume is slowly decreasing with red candles, sellers are still active.
I'm watching $2,294.25 breakdown closely. A 4h close below it could push us quickly towards $2,270 and then $2,250. A close above $2,320 could give relief bounce to $2,346.
What do you think, is this the bottom for ETH or more downside coming?
Follow for real-time $ETH updates, no fake signals.
If this analysis helped you, a small Tip is appreciated 🙏
#ETH #Ethereum #ETHUSDT
1
110

·
--
$ETH
{future}(ETHUSDT)
🚨 ETHUSDT SHORT SIGNAL 📉 | SELL-SIDE LIQUIDITY TARGET
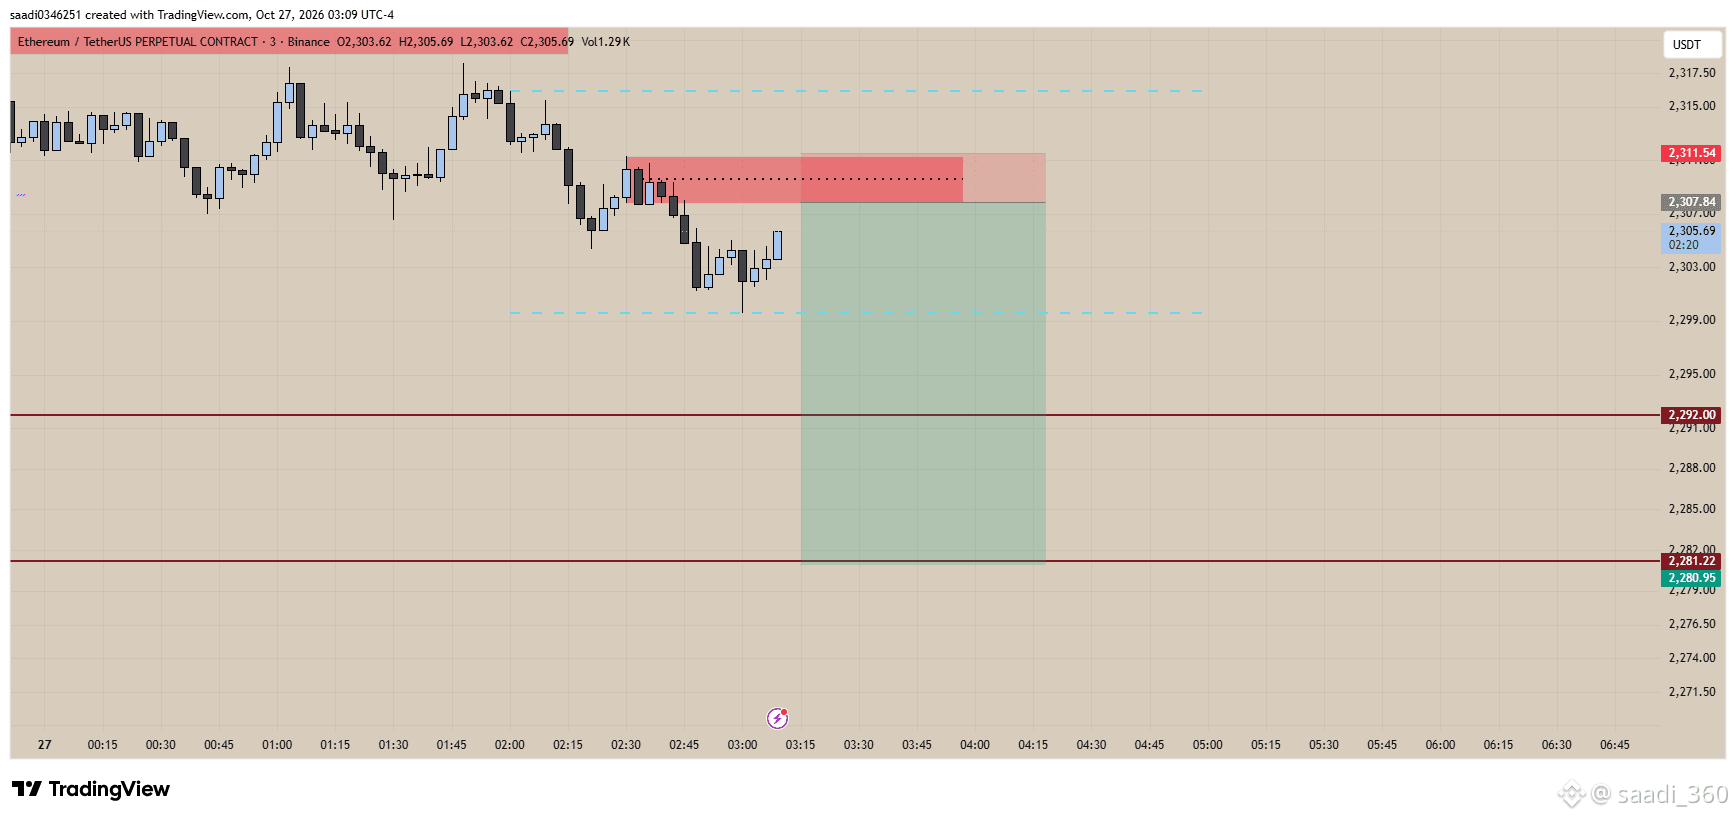
Ethereum is showing bearish momentum on the 3-minute chart. Price rejected from the marked Order Block (OB), followed by bearish displacement. I’m watching for further downside toward the liquidity below.
🔴 Pair: ETHUSDT Perpetual
📉 Direction: SHORT
🎯 Entry Zone: 2,307.84 – 2,311.54
🛑 Stop Loss: 2,311.54
✅ Take Profit 1: 2,292.00
🎯 Take Profit 2: 2,281.22
💧 Major Target: 2,280.95
📊 Trade Analysis
Price rejected from the marked OB.
Bearish momentum suggests potential continuation to the downside.
The first target is 2,292, followed by the lower liquidity area around 2,281–2,280.
⚠️ Risk Management: Wait for a retracement into the entry zone and bearish confirmation. Avoid chasing the move after a sharp drop. Invalidate the setup if price breaks above the stop-loss level.
Will ETH sweep the lower liquidity zone? Drop your analysis in the comments! 👇
#ETH #Ethereum #ETHUSDT #cryptotrading #TechnicalAnalysis
$ETH
🚨 ETHUSDT SHORT SIGNAL 📉 | SELL-SIDE LIQUIDITY TARGET
Ethereum is showing bearish momentum on the 3-minute chart. Price rejected from the marked Order Block (OB), followed by bearish displacement. I’m watching for further downside toward the liquidity below.
🔴 Pair: ETHUSDT Perpetual
📉 Direction: SHORT
🎯 Entry Zone: 2,307.84 – 2,311.54
🛑 Stop Loss: 2,311.54
✅ Take Profit 1: 2,292.00
🎯 Take Profit 2: 2,281.22
💧 Major Target: 2,280.95
📊 Trade Analysis
Price rejected from the marked OB.
Bearish momentum suggests potential continuation to the downside.
The first target is 2,292, followed by the lower liquidity area around 2,281–2,280.
⚠️ Risk Management: Wait for a retracement into the entry zone and bearish confirmation. Avoid chasing the move after a sharp drop. Invalidate the setup if price breaks above the stop-loss level.
Will ETH sweep the lower liquidity zone? Drop your analysis in the comments! 👇
#ETH #Ethereum #ETHUSDT #cryptotrading #TechnicalAnalysis
116

·
--
Bearish
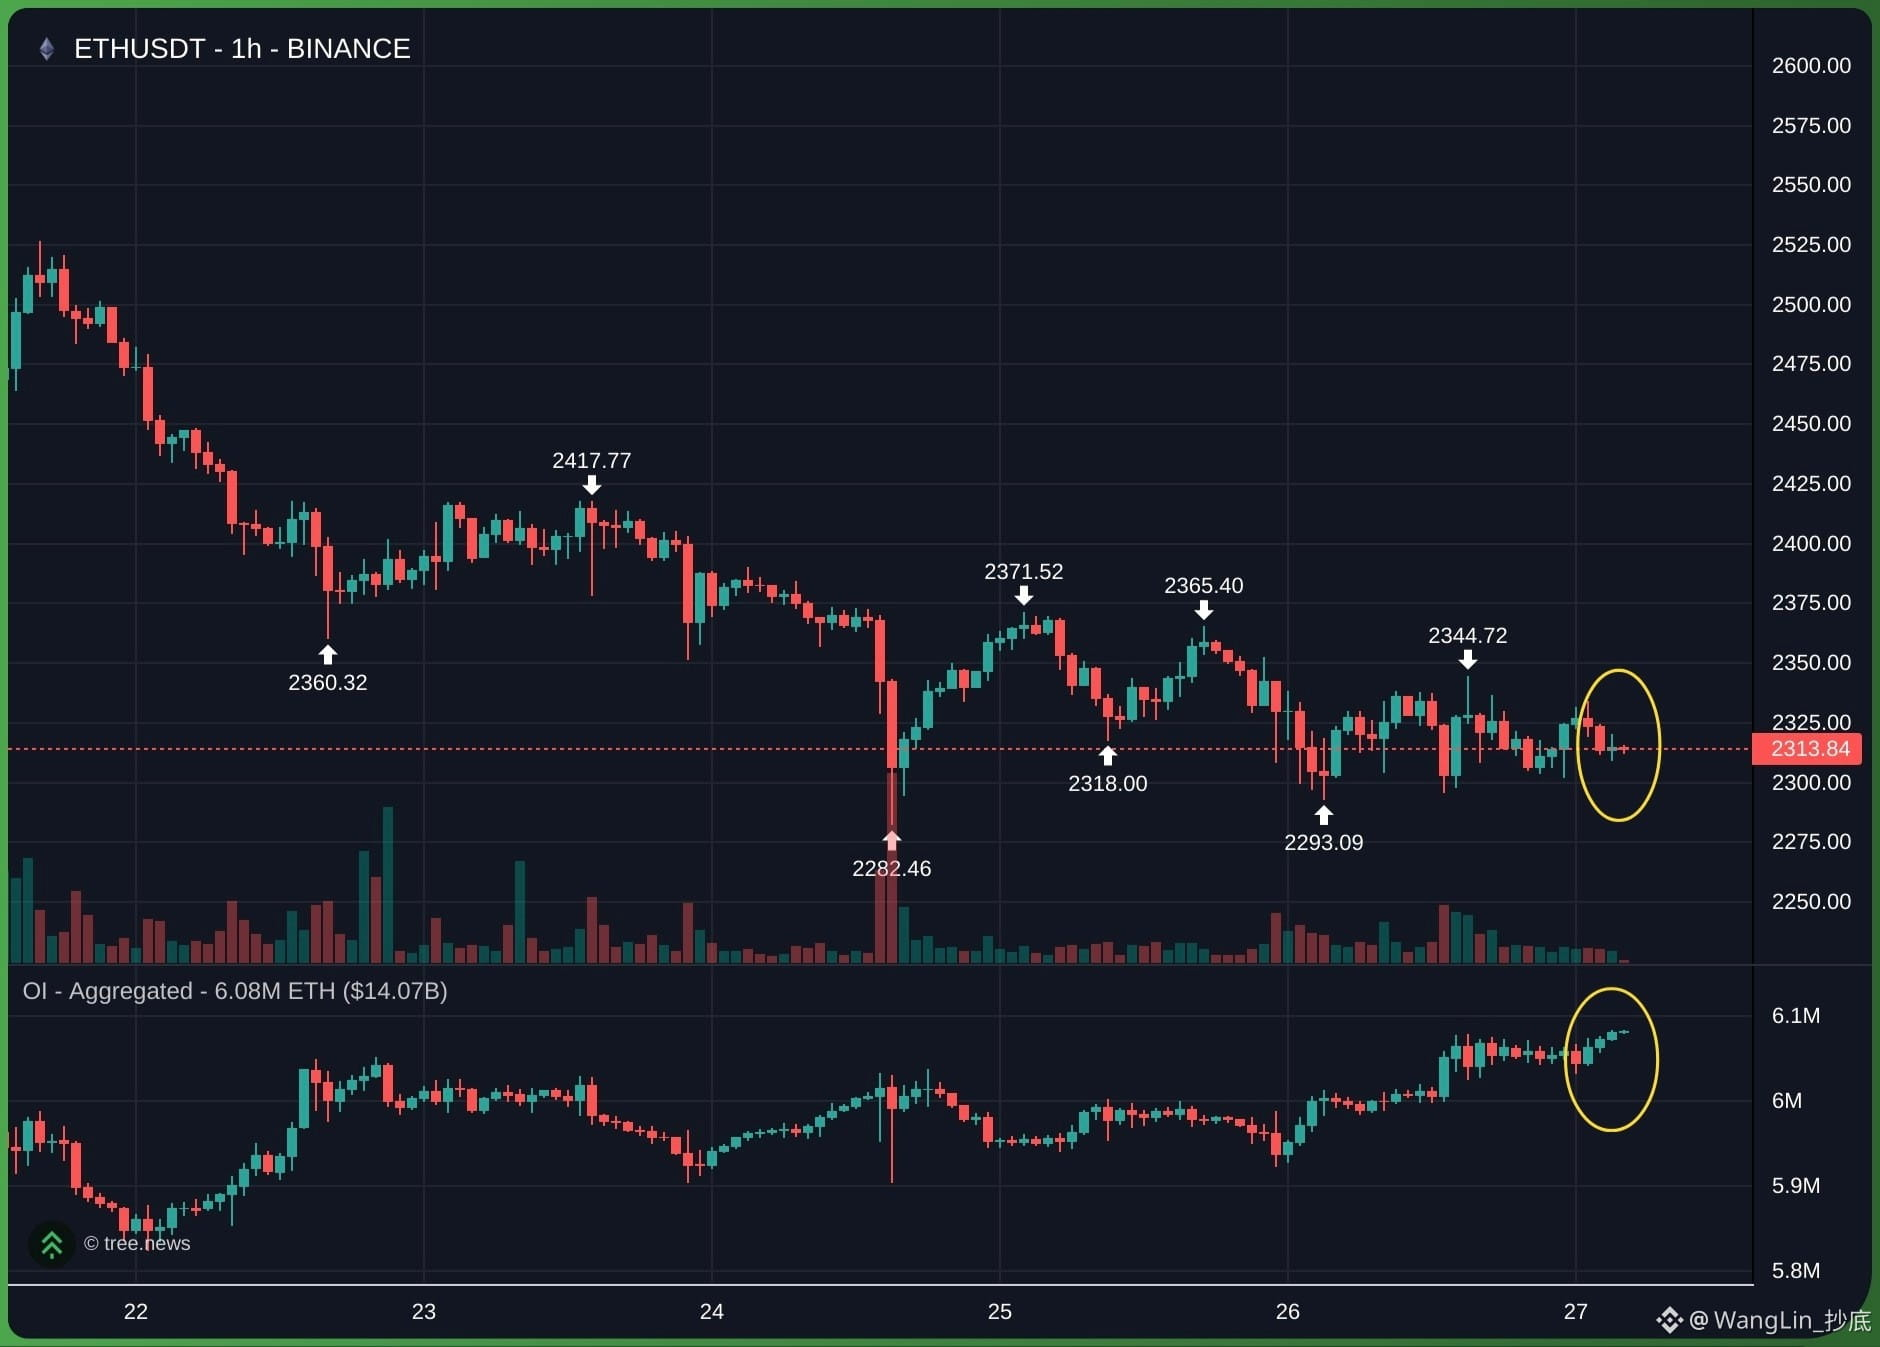
$ETH downtrend, clear series of lower highs (2417->2371->2365->2344)
Structure remains bearish as long as the price trades below 2360-2370 resistance
Crucially, Open Interest has been rising during this recent downward push, suggesting short positions are building
Safest trade favoring Shorting the highs and Longing the major support sweeps
$ETH SHORT SETUP (Primary trend)
· Entry Short: 2335 - 2345 (Retest recent rejection area)
· Stop Loss: above 2370
· Take Profit: 2305 and 2290
$ETH LONG SETUP (Counter trend)
· Entry Long: 2285 - 2295 (Catch quick bounce from support)
· Stop Loss: below 2270
· Take Profi: 2330 and 2345
Support me just Trade here👇#eth
{future}(ETHUSDT)
$ETH downtrend, clear series of lower highs (2417->2371->2365->2344)
Structure remains bearish as long as the price trades below 2360-2370 resistance
Crucially, Open Interest has been rising during this recent downward push, suggesting short positions are building
Safest trade favoring Shorting the highs and Longing the major support sweeps
$ETH SHORT SETUP (Primary trend)
· Entry Short: 2335 - 2345 (Retest recent rejection area)
· Stop Loss: above 2370
· Take Profit: 2305 and 2290
$ETH LONG SETUP (Counter trend)
· Entry Long: 2285 - 2295 (Catch quick bounce from support)
· Stop Loss: below 2270
· Take Profi: 2330 and 2345
Support me just Trade here👇#eth
1
143

🚨 ETH Futures Update
Ethereum (ETH) is trading around $2.3K, with futures traders closely watching the $2,300 support zone and $2,370 resistance area. 📊
If ETH breaks above resistance, bullish momentum could strengthen. But losing the $2,300 area may bring more downside pressure.
👀 What do you think — **Bullish or Bearish on ETH?**
#ETH #Ethereum #BinanceSquare #Crypto #ETHUSDT #Futures #Trading
{future}(ETHUSDT)
🚨 ETH Futures Update
Ethereum (ETH) is trading around $2.3K, with futures traders closely watching the $2,300 support zone and $2,370 resistance area. 📊
If ETH breaks above resistance, bullish momentum could strengthen. But losing the $2,300 area may bring more downside pressure.
👀 What do you think — **Bullish or Bearish on ETH?**
#ETH #Ethereum #BinanceSquare #Crypto #ETHUSDT #Futures #Trading
59

🐋 BITMINE ADDS 10,452 $ETH
Bitmine reportedly purchased another 10,452 ETH, bringing its treasury to approximately **6.05 million ETH**. 📈 Large corporate holdings keep Ethereum in the spotlight, but treasury accumulation alone doesn't guarantee a price rally. 👀 Will ETH benefit from continued institutional interest? #Ethereum #ETH #Bitmine #CryptoNews
{future}(ETHUSDT)
🐋 BITMINE ADDS 10,452 $ETH
Bitmine reportedly purchased another 10,452 ETH, bringing its treasury to approximately **6.05 million ETH**. 📈 Large corporate holdings keep Ethereum in the spotlight, but treasury accumulation alone doesn't guarantee a price rally. 👀 Will ETH benefit from continued institutional interest? #Ethereum #ETH #Bitmine #CryptoNews
Bitmine reportedly purchased another 10,452 ETH, bringing its treasury to approximately **6.05 million ETH**. 📈 Large corporate holdings keep Ethereum in the spotlight, but treasury accumulation alone doesn't guarantee a price rally. 👀 Will ETH benefit from continued institutional interest? #Ethereum #ETH #Bitmine #CryptoNews
1
34


·
--
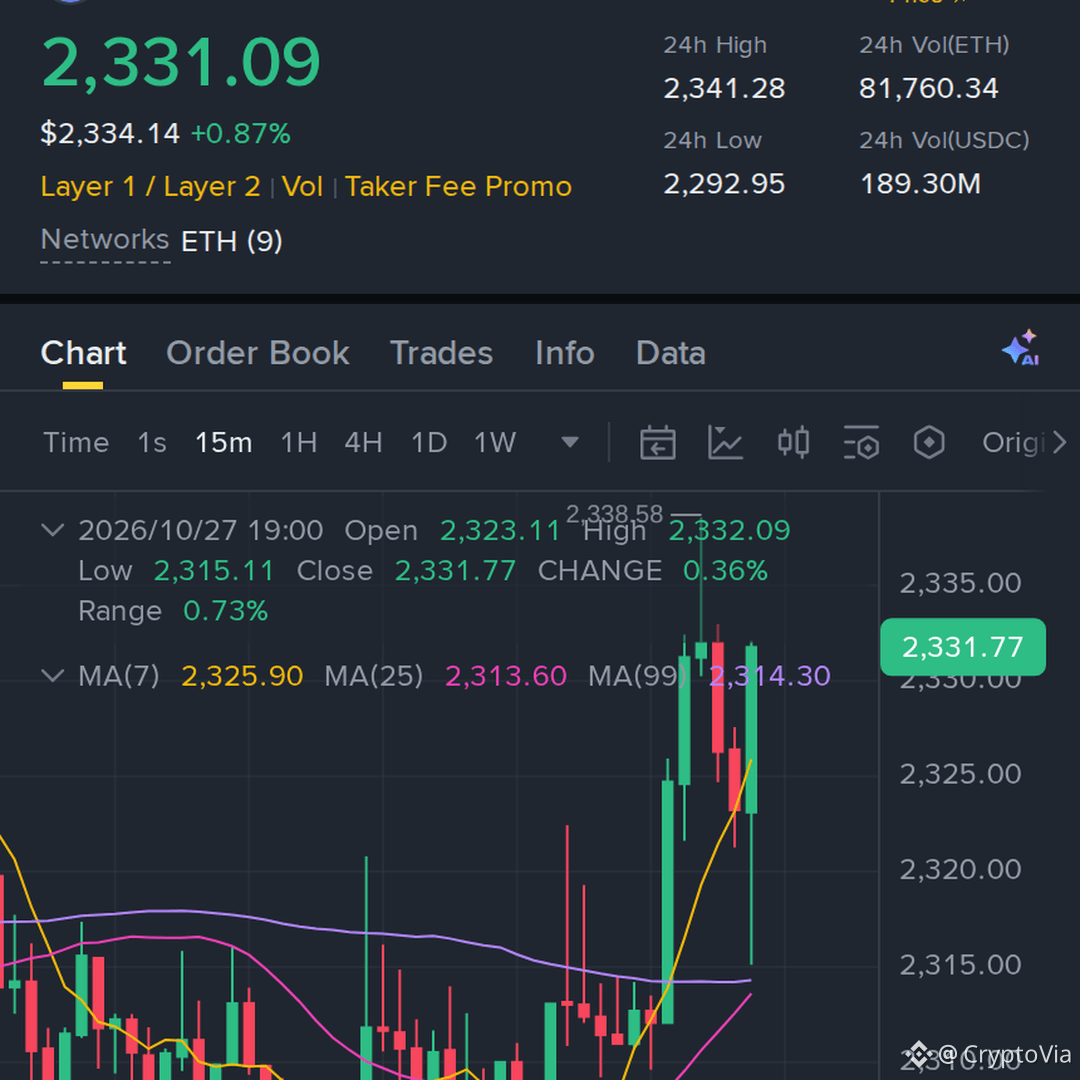
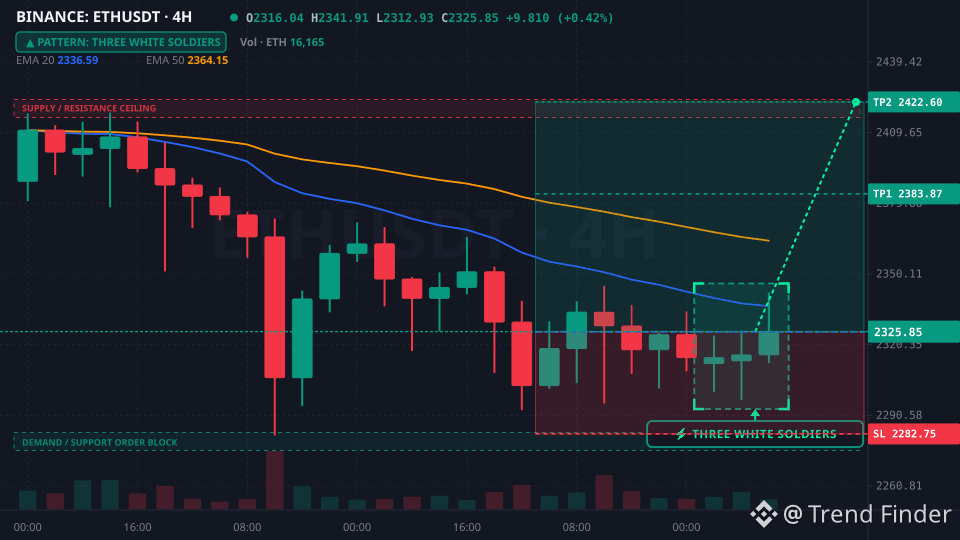
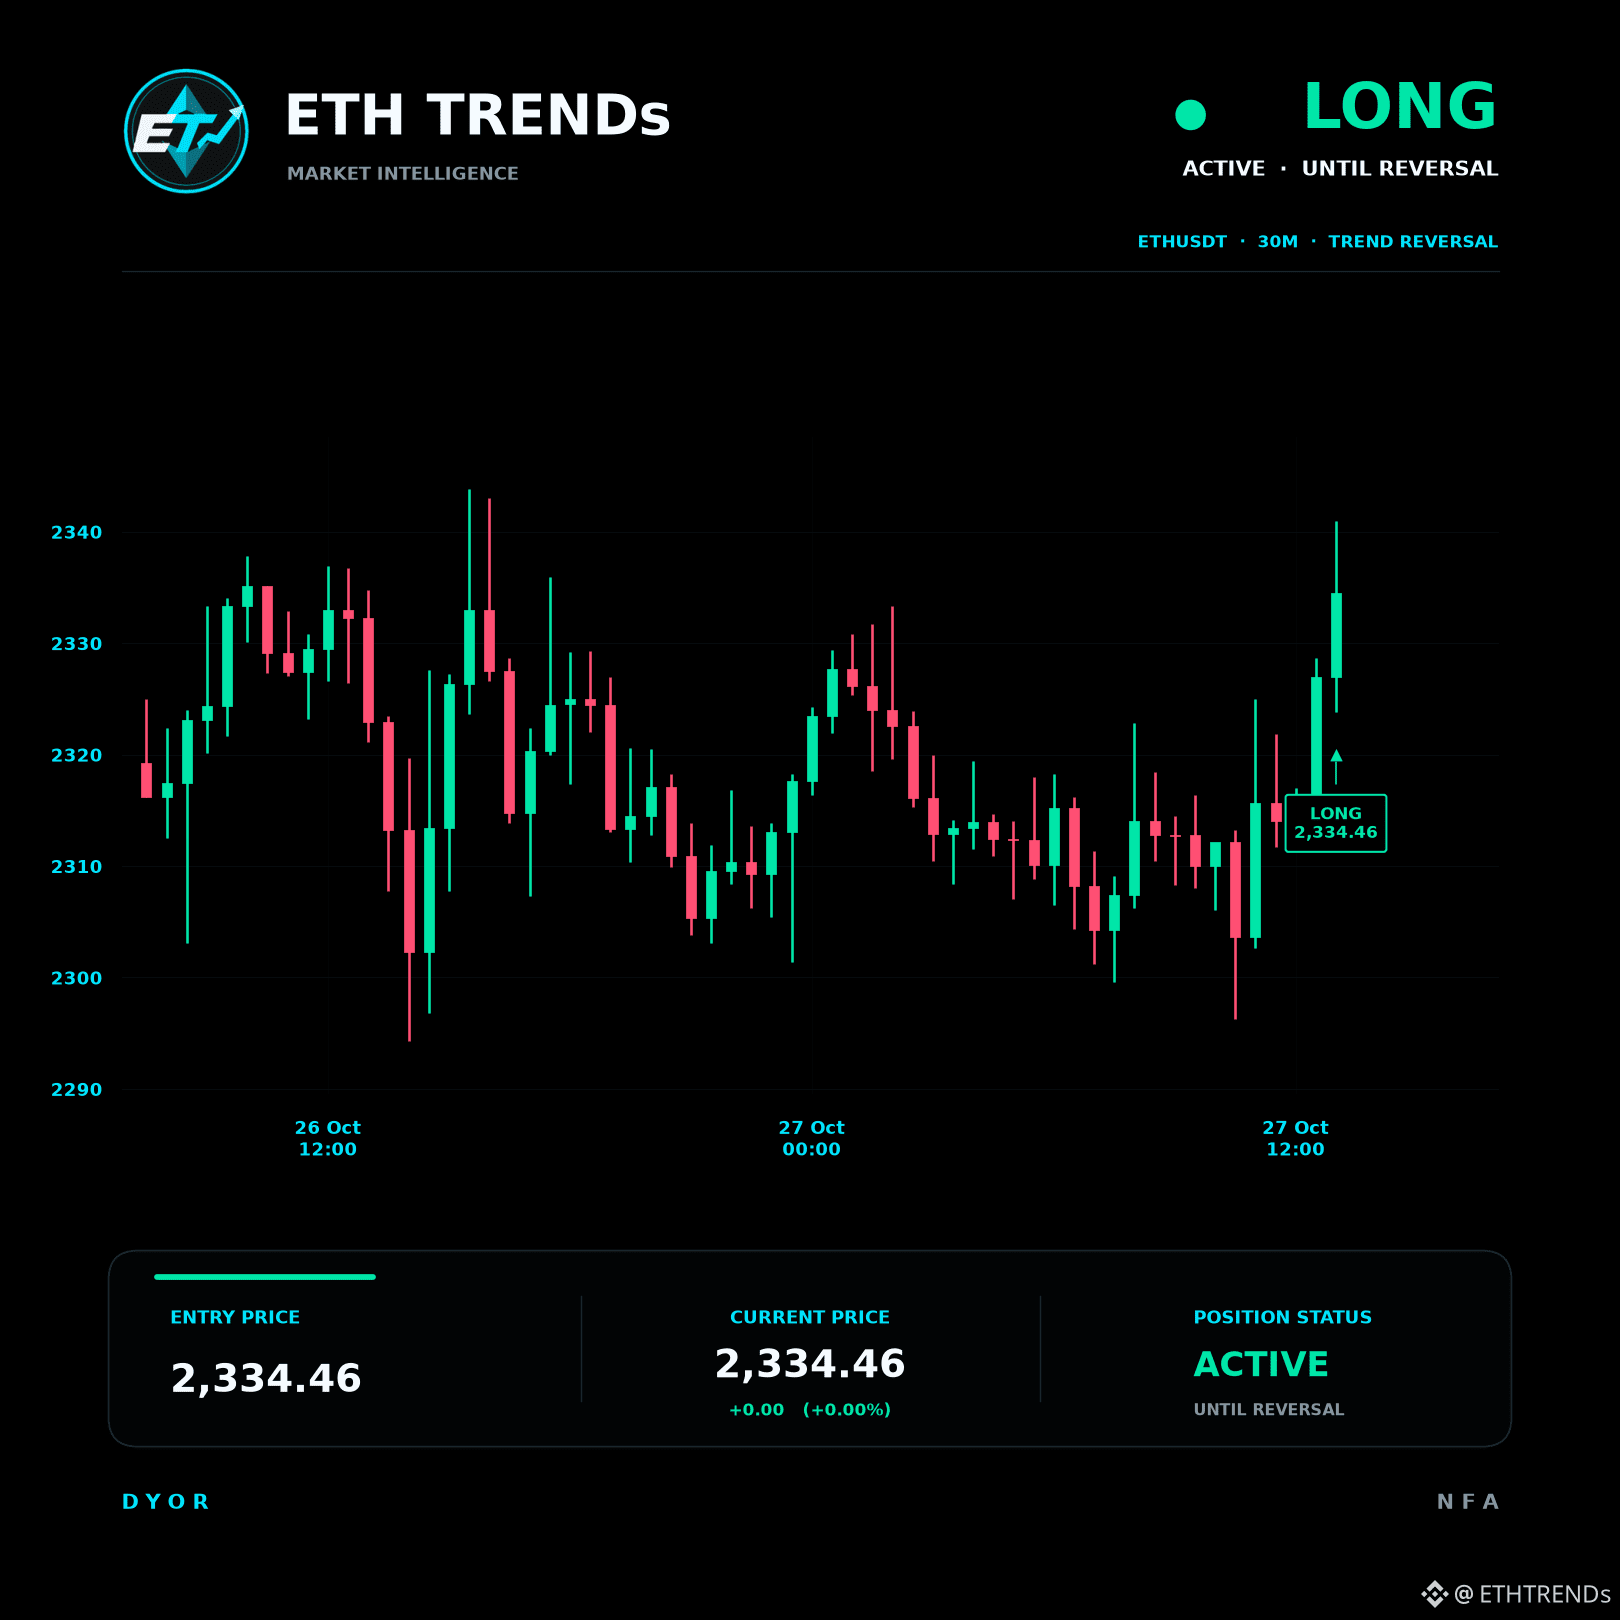
Aggressive spot absorption is lifting $ETH clean off the 2316 EMA20 floor while $BTC anchors market stability. The 4H Three White Soldiers breakout confirms institutional demand absorbing ask liquidity for a 55-point push with RSI at 56.
Entry: 2325.78 | SL: 2282.75 | TP1: 2383.87 | TP2: 2422.6
#BinanceSquare #CryptoTrading #ETH
Entry: 2325.78 | SL: 2282.75 | TP1: 2383.87 | TP2: 2422.6
#BinanceSquare #CryptoTrading #ETH

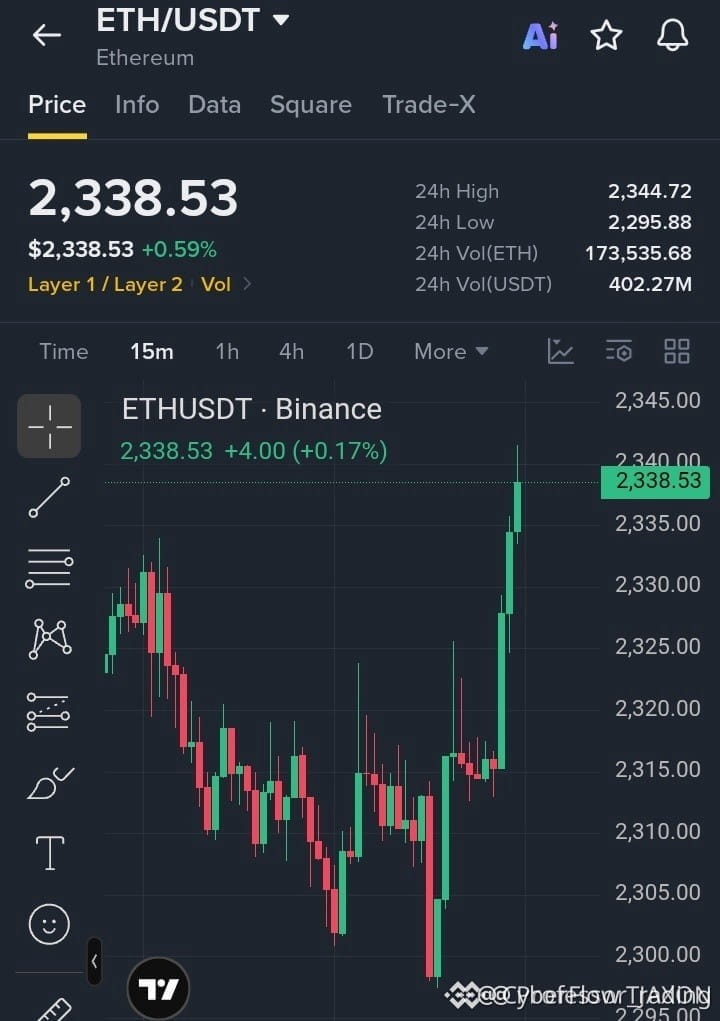
🚀 $ETH SURGES PAST 2,330 RESISTANCE – BULLISH MOMENTUM RISING! 💥
Entry: 2,333‑2,338 ⚡
Target: 2,343 / 2,348 / 2,355 🚀
Stop Loss: 2,326 ⚠️
The 2,330 barrier finally cracked, unleashing a fresh wave of buying pressure that’s feeding off the 24‑hour high. 📊 Volume spikes and a clean upward thrust on the 4H chart signal smart money stepping in.
Look for a brief pullback into the 2,333‑2,338 band before the next thrust; holding above 2,335 keeps the bullish engine humming. 🌊 If sellers try to shake the market, liquidity will be swept and the price can sprint toward the 2,350 ceiling. 💡
💬 Are you positioning for the next push above 2,340?
⚠️ Not financial advice. Always manage your risk. 🛡️
🏷️ #ETH #LongSetup #Breakout #Crypto
🚀 🔥
1

·
--
Bearish
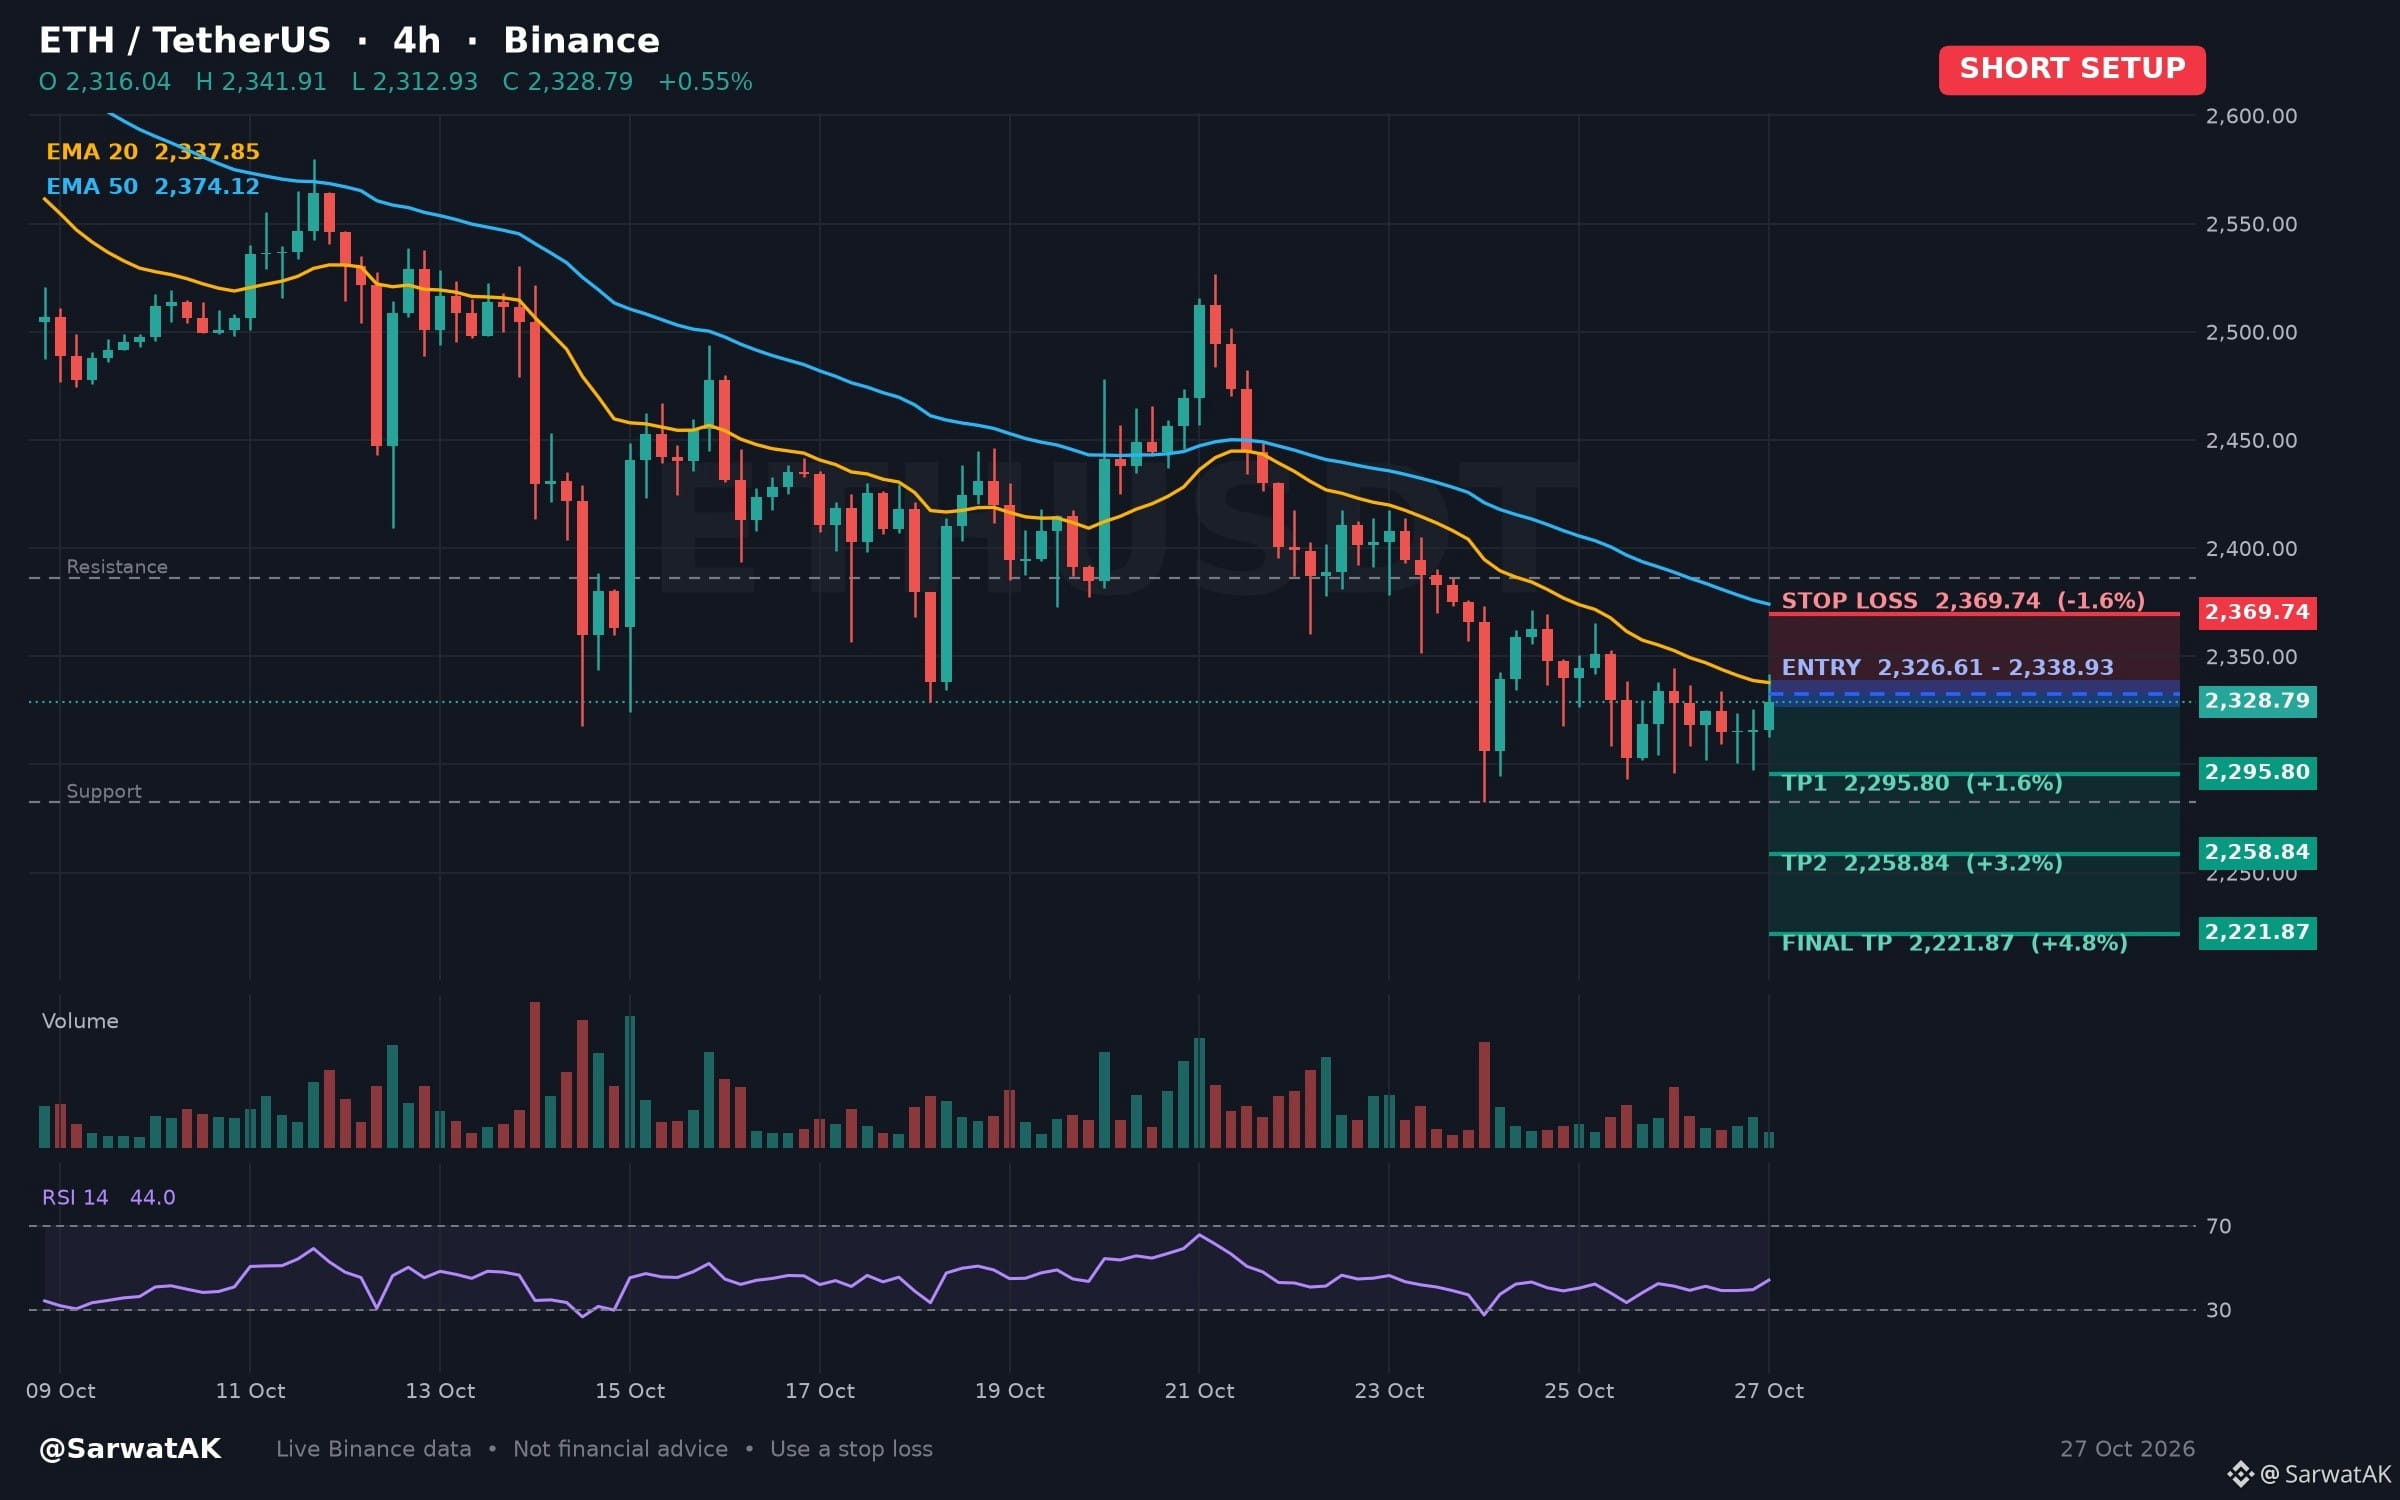
$ETH SHORT SETUP ... NEXT TARGET 2,221.87
Four-Hour Chart Displays Bearish Moving Average Alignment with Neutral Momentum
Entry: 2,326.61 - 2,338.93 (Short)
TP1: 2,295.80
TP2: 2,258.84
Final TP: 2,221.87
SL: 2,369.74
Price remains below key exponential moving averages following downward trajectory over the past twenty-four hours. Meanwhile, a neutral relative strength index on the four-hour chart suggests momentum has room to expand in either direction.
As long as price stays below 2,338.93, structure stays heavy
Must use stop loss while trading
Trade $ETH
Not financial advice. Always DYOR.
Like & Follow for Daily Trade Analytics & Insider News. @SarwatAK
#ETH #FOMCWatch #EthereumDropsBelow$2300
{spot}(ETHUSDT)
$ETH SHORT SETUP ... NEXT TARGET 2,221.87
Four-Hour Chart Displays Bearish Moving Average Alignment with Neutral Momentum
Entry: 2,326.61 - 2,338.93 (Short)
TP1: 2,295.80
TP2: 2,258.84
Final TP: 2,221.87
SL: 2,369.74
Price remains below key exponential moving averages following downward trajectory over the past twenty-four hours. Meanwhile, a neutral relative strength index on the four-hour chart suggests momentum has room to expand in either direction.
As long as price stays below 2,338.93, structure stays heavy
Must use stop loss while trading
Trade $ETH
Not financial advice. Always DYOR.
Like & Follow for Daily Trade Analytics & Insider News. @SarwatAK
#ETH #FOMCWatch #EthereumDropsBelow$2300
1

·
--
Bullish
#EthereumDropsBelow$2300
🚨 Ethereum Drops Below $2,300: Is Selling Pressure Building?
Ethereum slipping below $2,300 puts a key psychological price level back in focus. The important question is whether sellers can maintain control or buyers will step in to defend the lower levels.
📉 Why It Matters
A break below a round-number level can weaken short-term sentiment and trigger increased volatility. Traders may also watch for stop-loss orders and leveraged positions that could amplify price movements.
However, a drop below $2,300 alone does not confirm a larger bearish trend. ETH could recover quickly if buyers regain momentum, while continued weakness could signal further downside risk.
🔎 What Traders Should Watch
• Bearish scenario: ETH remains below $2,300, and selling pressure continues.
• Bullish scenario: ETH reclaims $2,300 and holds above it, suggesting buyers are regaining strength.
• Confirmation: Trading volume, Bitcoin's direction, and ETH's ability to establish support will matter more than a single price break.
💡 My Take
The key is not simply that Ethereum fell below $2,300, but what happens next. A failed recovery could strengthen the bearish case, while a sustained reclaim could indicate that sellers are losing control.
In volatile markets, confirmation matters more than emotion.
#Ethereum #ETH #xrp #Bitcoin #BinanceSquare
$BTC $ETH $XRP
{future}(XRPUSDT)
{future}(ETHUSDT)
{future}(BTCUSDT)
#EthereumDropsBelow$2300
🚨 Ethereum Drops Below $2,300: Is Selling Pressure Building?
Ethereum slipping below $2,300 puts a key psychological price level back in focus. The important question is whether sellers can maintain control or buyers will step in to defend the lower levels.
📉 Why It Matters
A break below a round-number level can weaken short-term sentiment and trigger increased volatility. Traders may also watch for stop-loss orders and leveraged positions that could amplify price movements.
However, a drop below $2,300 alone does not confirm a larger bearish trend. ETH could recover quickly if buyers regain momentum, while continued weakness could signal further downside risk.
🔎 What Traders Should Watch
• Bearish scenario: ETH remains below $2,300, and selling pressure continues.
• Bullish scenario: ETH reclaims $2,300 and holds above it, suggesting buyers are regaining strength.
• Confirmation: Trading volume, Bitcoin's direction, and ETH's ability to establish support will matter more than a single price break.
💡 My Take
The key is not simply that Ethereum fell below $2,300, but what happens next. A failed recovery could strengthen the bearish case, while a sustained reclaim could indicate that sellers are losing control.
In volatile markets, confirmation matters more than emotion.
#Ethereum #ETH #xrp #Bitcoin #BinanceSquare
$BTC $ETH $XRP

41

·
--
Bullish
30D trade $ETH 3.3K USDT
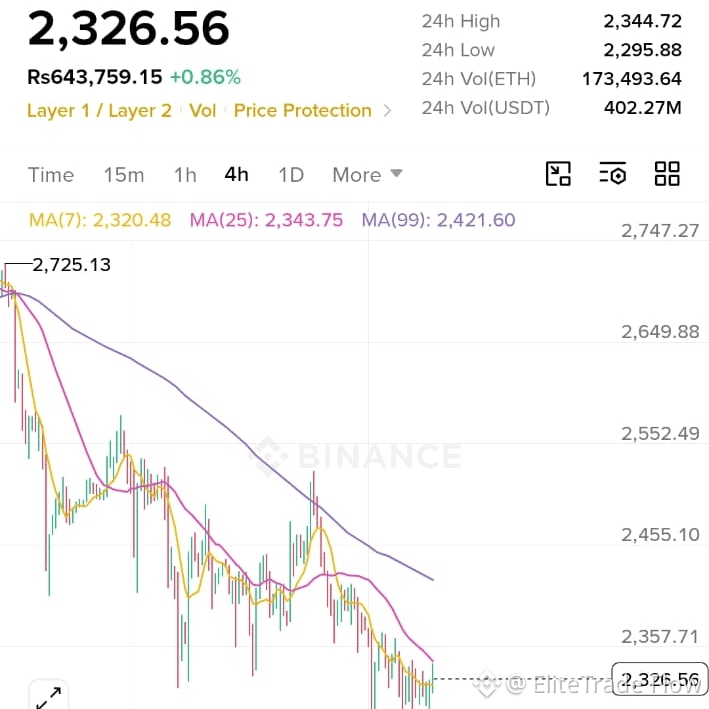
$ETH USDT LONG 🚀📈 Bottom Reversal Loading! 💥
$ETH holding strong at $2,326.56 (+0.86%) after long correction from $2,725.13 📉
📊 Technicals screaming BULLISH REVERSAL 👇
✅ Price: $2,326.56 - Reclaimed MA(7) $2,320.48 - First bullish sign! ⚡️
✅ Low: $2,282.46 - Double bottom formed, strong support holding 💪
✅ RSI(6): 51.25 - Neutral to bullish, room for big pump 🚀
✅ Vol(ETH) 173K / $402M - Buyers coming back 🐳
🎯 LONG SETUP:
📍 Entry: $2,315 - $2,328 🎯
🎯 TP1: $2,343.75 (MA25) 💰
🎯 TP2: $2,380
🎯 TP3: $2,421.60 (MA99) - Main target 🚀
🛑 SL: $2,285
Break above $2,343 = $2,500+ incoming! $ETH is the king of altseason 👑
As long as $2,282 holds, ETH is going for $2,430+ 💥 Don't miss this dip!
#ETH #Binance #FOMCWatch #ThailandLaunchesWORPTStablecoinToQRPaymentApp
11

·
--
$ETH #ETH
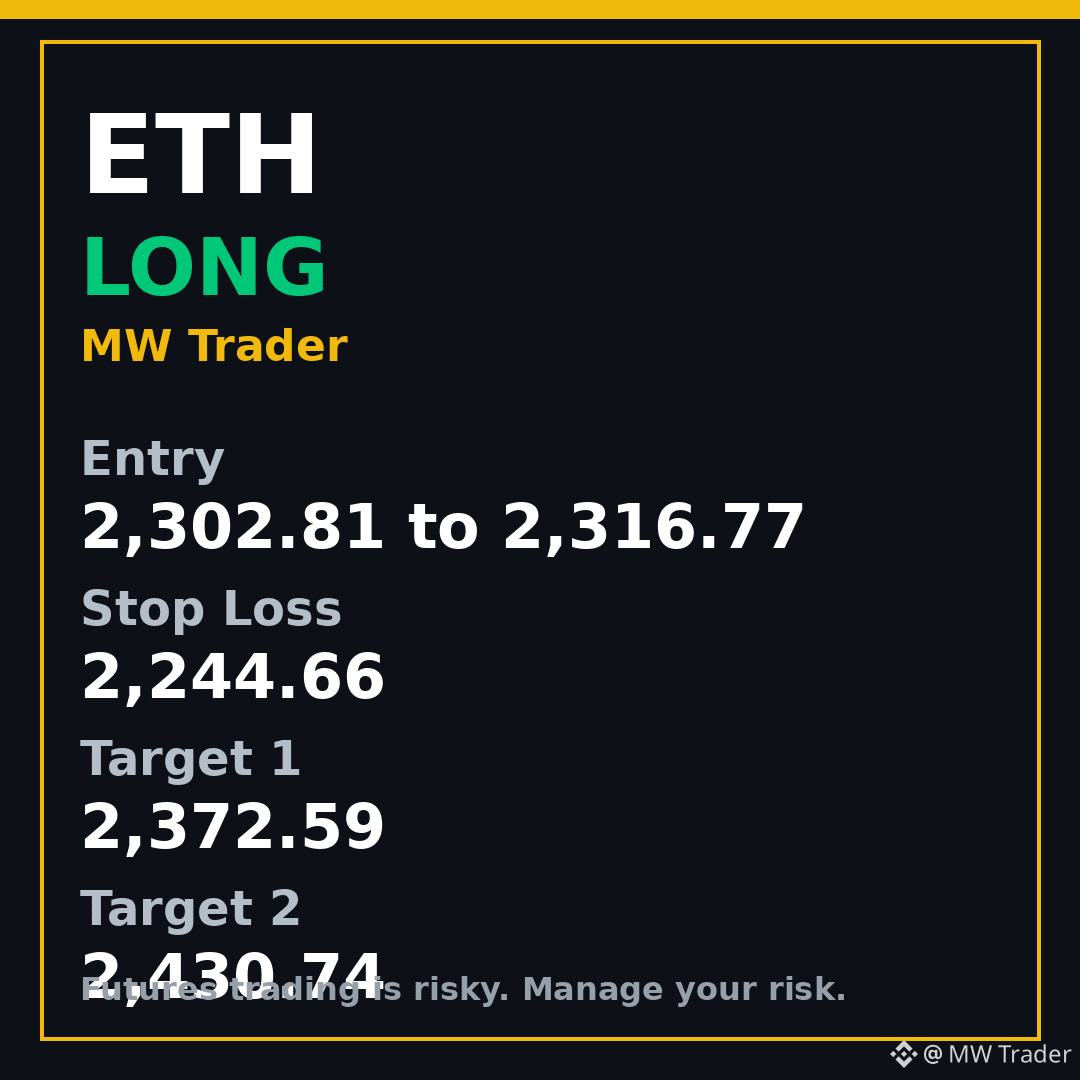
LONG idea A fresh setup, different from the earlier post today.
Entry: 2,302.81 to 2,316.77
Stop loss: 2,244.66
Target 1: 2,372.59
Target 2: 2,430.74
Keeping an eye on Ethereum here, the recent move looks worth a trade.
Price is near 2,326.07 after a +0.4% move in 24 hours, with a day range of 2,295.57 to 2,338.49 and about $8881M traded. Wait for price to reach the entry zone first, do not chase it. If price closes beyond the stop loss, this idea is invalid.
Futures trading is risky. Trade small, manage your risk, and do your own research.
#Ethereum #Crypto #FuturesTrading #TradingSignals
Follow for more trades.
1
·
--
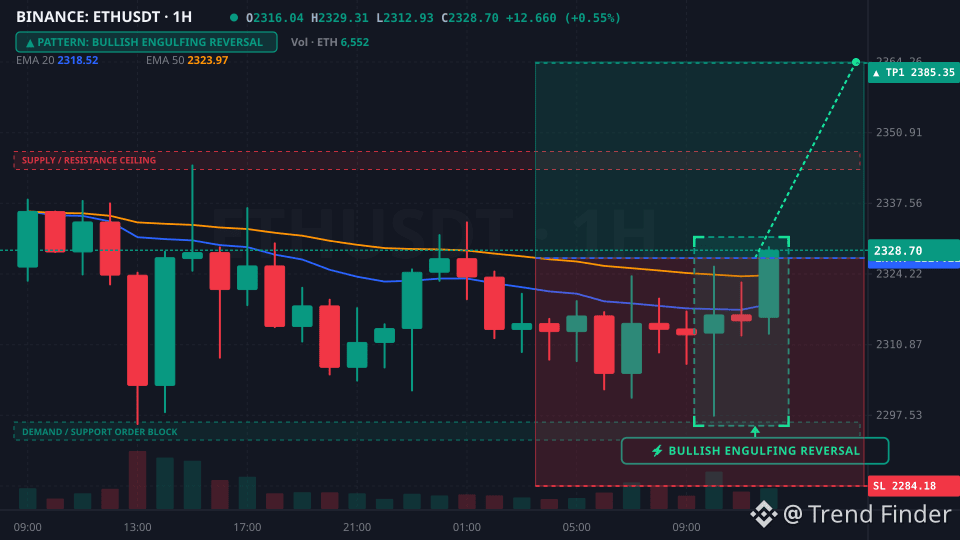
Aggressive bid-side pressure at the EMA20 just ignited a high-conviction 1H bullish engulfing for $ETH. With RSI at 56, smart money is front-running the next leg up as $BTC provides structural stability for this 55-point breakout.
Entry: 2327.23 | SL: 2284.18 | TP1: 2385.35 | TP2: 2424.09
_
#BinanceSquare #CryptoTrading #ETH
Aggressive bid-side pressure at the EMA20 just ignited a high-conviction 1H bullish engulfing for $ETH . With RSI at 56, smart money is front-running the next leg up as $BTC provides structural stability for this 55-point breakout.
Entry: 2327.23 | SL: 2284.18 | TP1: 2385.35 | TP2: 2424.09
_
#BinanceSquare #CryptoTrading #ETH
Entry: 2327.23 | SL: 2284.18 | TP1: 2385.35 | TP2: 2424.09
_
#BinanceSquare #CryptoTrading #ETH
1
2
#BitmineAdds10452ETH
Bitmine ETH Holdings Reach 6.05M Tokens! 💰
Bitmine Immersion (NYSE: BMNR) now holds:
🔹 6.05M ETH = 4.95% of ALL ETH supply (122.2M)
🔹 99% to Alchemy of 5% in 15 months!
🔹 $15B Total Crypto + Cash holdings
🔹 5.22M ETH staked = $12.3B on MAVAN
🔹 Added 10,452 ETH this past week
Plus: Repurchased 2.04M shares this week, 22.9M in 2026 - Largest ever crypto treasury buyback
Chairman Tom Lee: Crypto Bull Underway 🚀
NFA - Info only
$ETH $BMNR #BitmineAdds10452ETH #Ethereum #ETH

53

Log in to explore more content
Join global crypto users on Binance Square
⚡️ Get latest and useful information about crypto.
💬 Trusted by the world’s largest crypto exchange.
👍 Discover real insights from verified creators.
Email / Phone number
Trending Topics
1
#FOMCWatch
8.9M views
26,880 Discussing
2
#EthereumDropsBelow$2300
4,155 views
97 Discussing
3
#BitcoinSlipsBelow$80KAgain
12,140 views
67 Discussing
4
#ThailandLaunchesWORPTStablecoinToQRPaymentApp
19,893 views
377 Discussing
5
#StrategySkipsBitcoinPurchasesSpends$205MOnSTRCBuybacks
5,546 views
82 Discussing
6
#BitmineAdds10452ETH
58,089 views
786 Discussing
7
#SouthKoreaConsidersEducationTaxOnCryptoExchanges
32,221 views
587 Discussing
8
#OCCUrgesCommunityBanksToEnterStablecoinPayments
25,311 views
420 Discussing
9
#RippleWinsFullApprovalAsNationalTrustBank
38,584 views
423 Discussing
10
#AkashSelectsSolanaAsMigrationTarget
14,395 views
206 Discussing