
#bitcoinanalysis
bitcoinanalysis
1M views
4,497 Discussing
Hot
Latest

·
--
Bullish
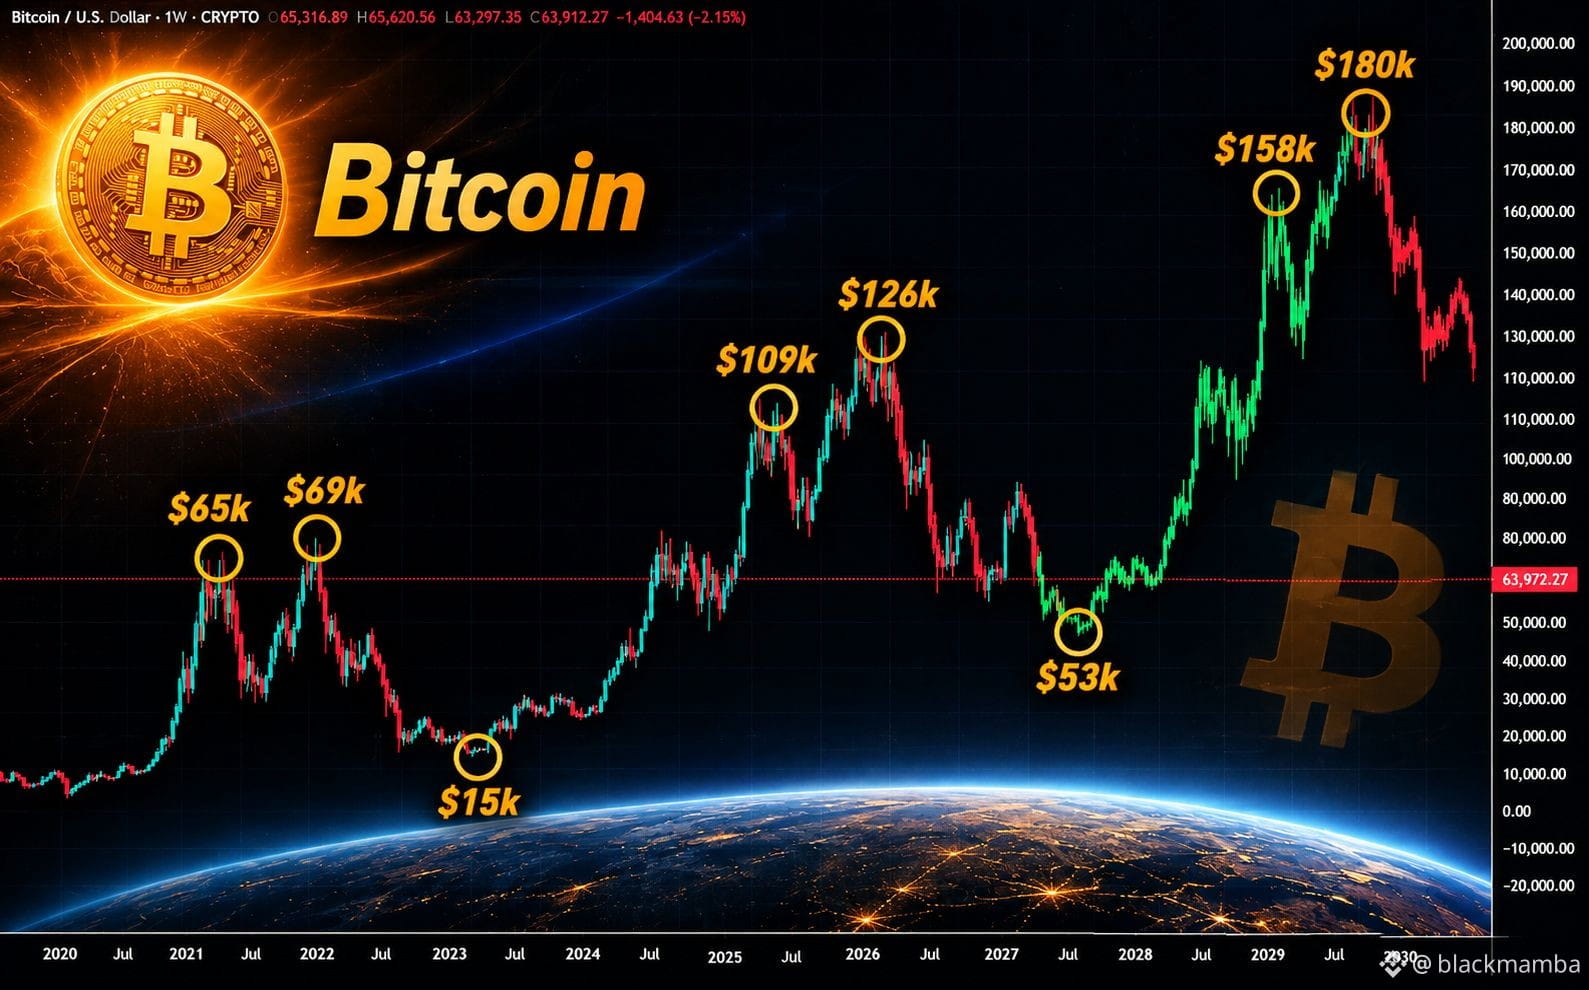
🚨 BITCOIN: THE BIGGER CORRECTION MAY NOT BE OVER — BUT A NEW SUPERCYCLE COULD BE AHEAD.
Bitcoin has suffered a massive correction, raising serious questions about whether the current bull cycle has ended.
While many investors are still expecting an immediate recovery, my outlook remains cautious.
📉 MY BTC MARKET ROADMAP:
🔻 $63,000 — First downside target
🔻 $57,000 — Next major support
🔻 $53,000 — Potential cycle-bottom zone
🚀 THE BIGGER PICTURE:
If Bitcoin finds strong accumulation around the $53K region, the next major expansion could target:
🎯 $158,000
🎯 $180,000
📊 MY MARKET THESIS
I am watching three important factors:
• Whether selling pressure continues around current levels.
• Whether long-term investors begin accumulating at lower prices.
• Whether macroeconomic liquidity improves enough to support another major crypto rally.
⚠️ IMPORTANT:
These are projected scenarios, NOT confirmed price targets. A breakdown below major support could extend the correction, while a recovery in liquidity could change the market structure.
MY STRATEGY:
I would rather wait for confirmation at key levels than chase a falling market. Risk management comes first.
Bitcoin's next major move could define the next chapter of this cycle.
Save this roadmap. Watch these levels. Let's see how the market unfolds.
₿ $BTC
#Bitcoin #CryptoMarket #BitcoinAnalysis #BullMarket #BitcoinPrediction
🚨 BITCOIN: THE BIGGER CORRECTION MAY NOT BE OVER — BUT A NEW SUPERCYCLE COULD BE AHEAD.
Bitcoin has suffered a massive correction, raising serious questions about whether the current bull cycle has ended.
While many investors are still expecting an immediate recovery, my outlook remains cautious.
📉 MY BTC MARKET ROADMAP:
🔻 $63,000 — First downside target
🔻 $57,000 — Next major support
🔻 $53,000 — Potential cycle-bottom zone
🚀 THE BIGGER PICTURE:
If Bitcoin finds strong accumulation around the $53K region, the next major expansion could target:
🎯 $158,000
🎯 $180,000
📊 MY MARKET THESIS
I am watching three important factors:
• Whether selling pressure continues around current levels.
• Whether long-term investors begin accumulating at lower prices.
• Whether macroeconomic liquidity improves enough to support another major crypto rally.
⚠️ IMPORTANT:
These are projected scenarios, NOT confirmed price targets. A breakdown below major support could extend the correction, while a recovery in liquidity could change the market structure.
MY STRATEGY:
I would rather wait for confirmation at key levels than chase a falling market. Risk management comes first.
Bitcoin's next major move could define the next chapter of this cycle.
Save this roadmap. Watch these levels. Let's see how the market unfolds.
₿ $BTC
#Bitcoin #CryptoMarket #BitcoinAnalysis #BullMarket #BitcoinPrediction
Bitcoin has suffered a massive correction, raising serious questions about whether the current bull cycle has ended.
While many investors are still expecting an immediate recovery, my outlook remains cautious.
📉 MY BTC MARKET ROADMAP:
🔻 $63,000 — First downside target
🔻 $57,000 — Next major support
🔻 $53,000 — Potential cycle-bottom zone
🚀 THE BIGGER PICTURE:
If Bitcoin finds strong accumulation around the $53K region, the next major expansion could target:
🎯 $158,000
🎯 $180,000
📊 MY MARKET THESIS
I am watching three important factors:
• Whether selling pressure continues around current levels.
• Whether long-term investors begin accumulating at lower prices.
• Whether macroeconomic liquidity improves enough to support another major crypto rally.
⚠️ IMPORTANT:
These are projected scenarios, NOT confirmed price targets. A breakdown below major support could extend the correction, while a recovery in liquidity could change the market structure.
MY STRATEGY:
I would rather wait for confirmation at key levels than chase a falling market. Risk management comes first.
Bitcoin's next major move could define the next chapter of this cycle.
Save this roadmap. Watch these levels. Let's see how the market unfolds.
₿ $BTC
#Bitcoin #CryptoMarket #BitcoinAnalysis #BullMarket #BitcoinPrediction
2
1k

·
--
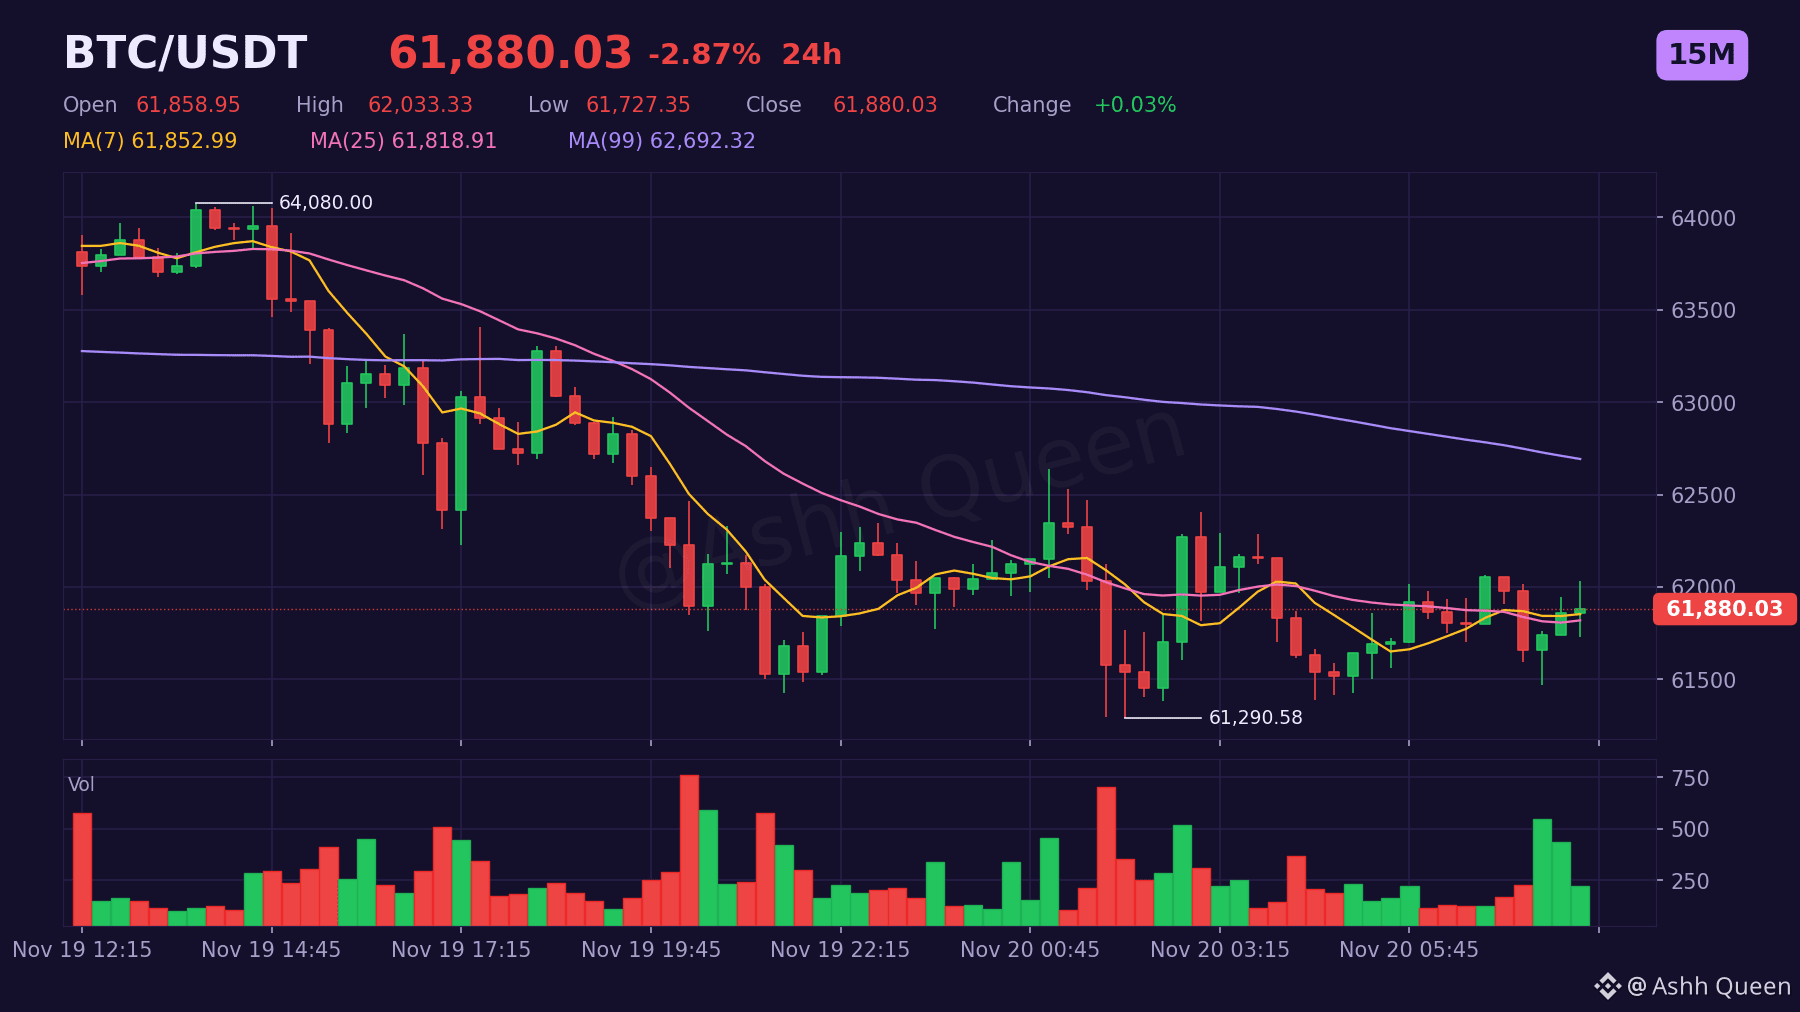
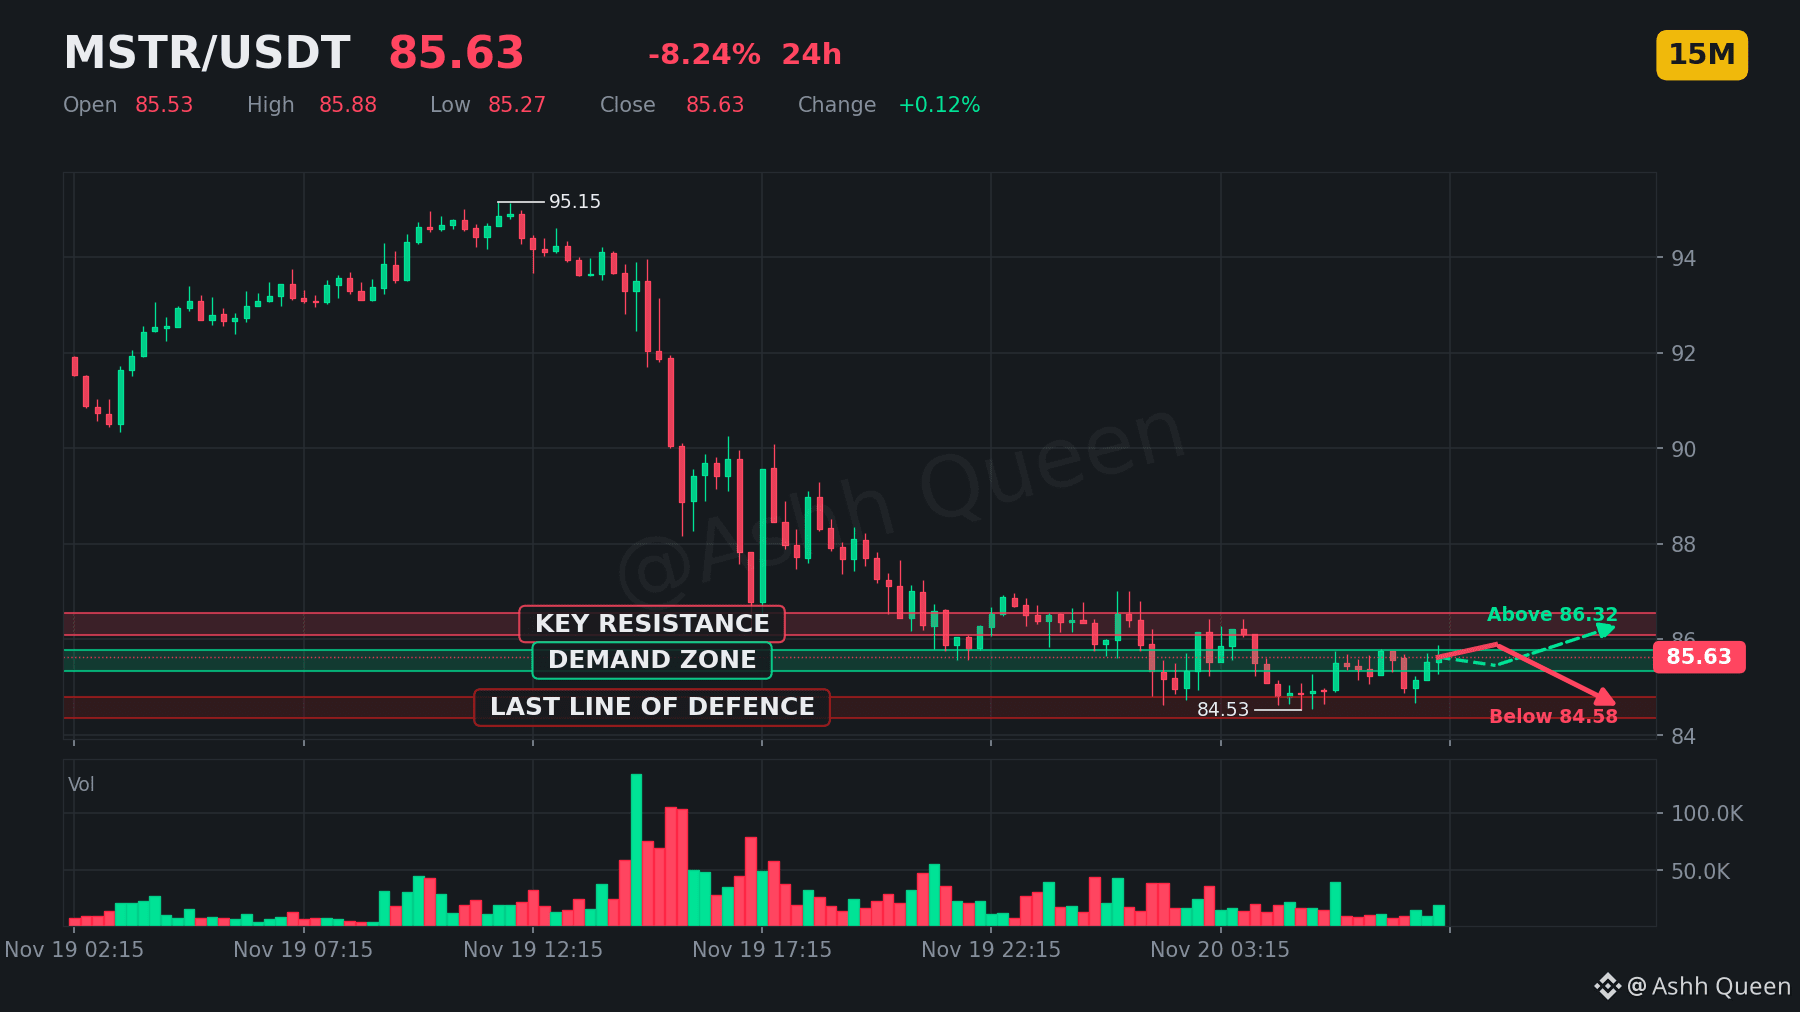
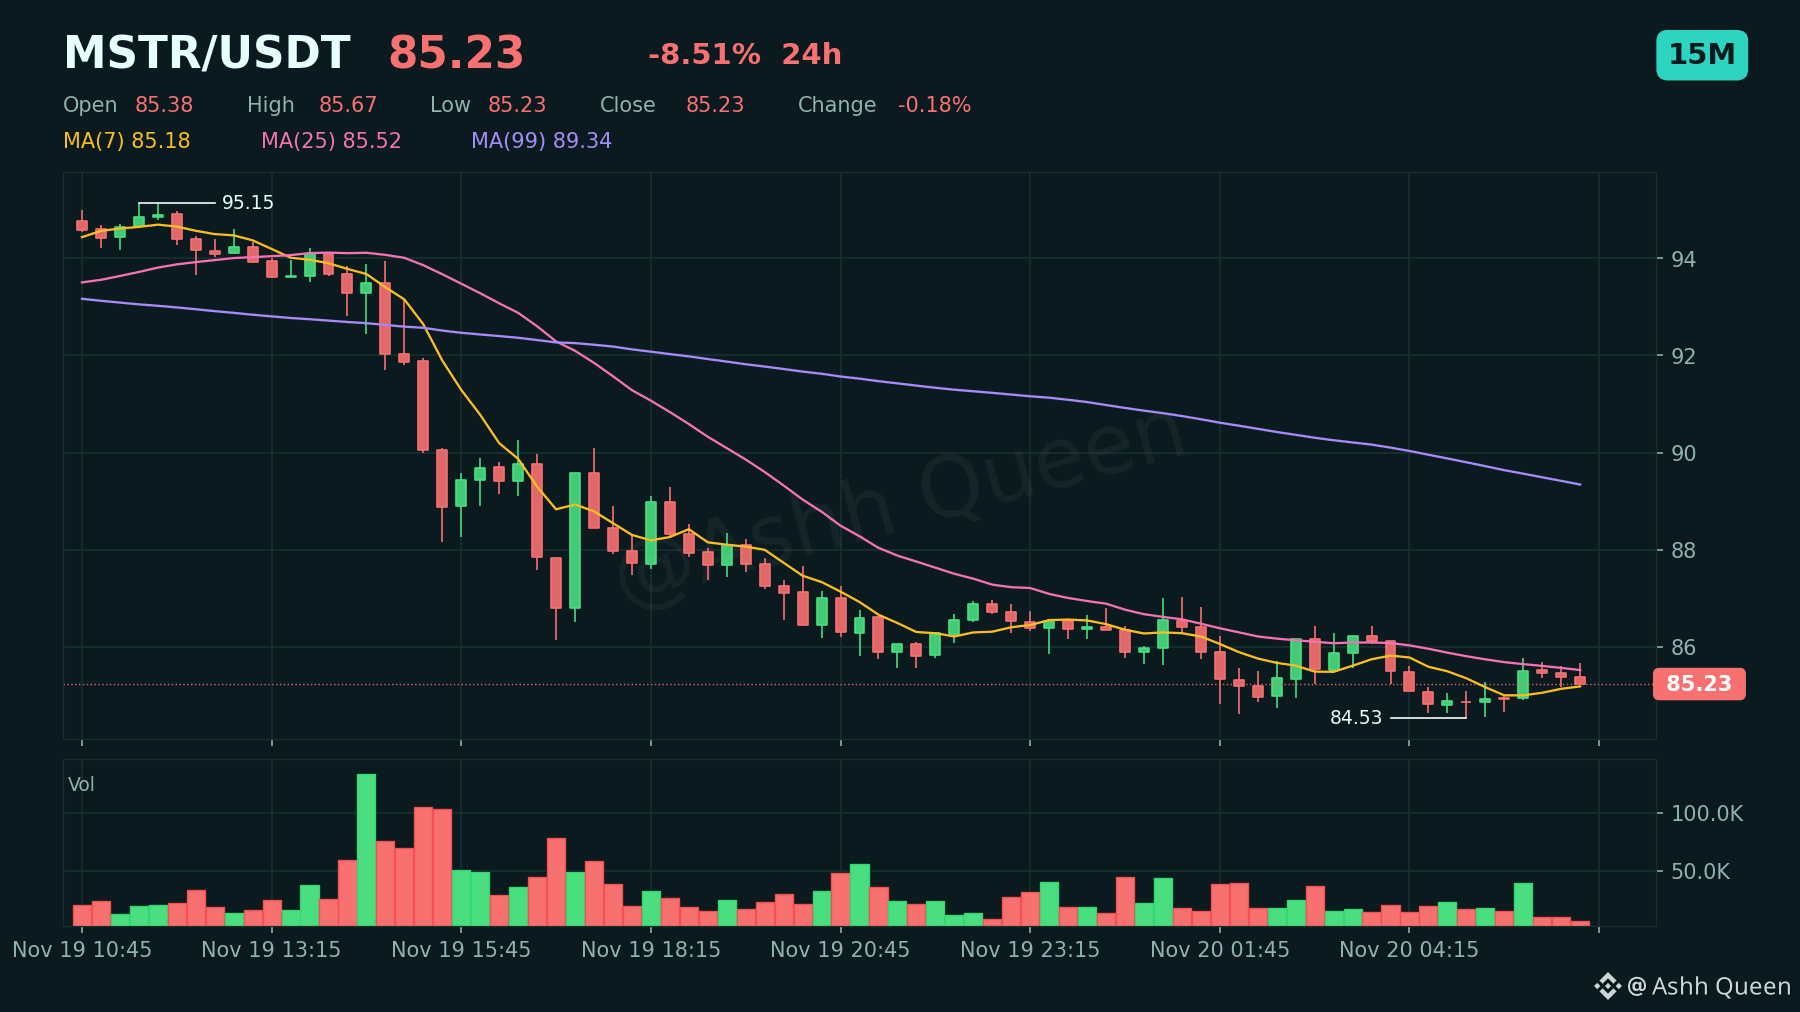
$BTC vs $MSTR perpetual contract: who shows more resilience? 📈
$BTC is down -2.87% with an RSI at 49.96, while the $MSTR perp shows a deeper -8.24% drop and an RSI at 50.54. 📊
The +5.37% performance gap highlights the divergence here. $BTC holds above VWAP at 61,861.05, while $MSTR clings to its VWAP at 85.60. 📉
Structure favors $BTC for now if support at 61,772.45 holds.
Are you watching this on the short or the longer timeframe?
#BTC #MSTR #BitcoinAnalysis #BinanceSquare
⚠️ Perpetual contracts are leveraged derivatives, not the stock or commodity itself.
Risk note: leverage magnifies losses. Plan the exit before the entry.
$BTC vs $MSTR perpetual contract: who shows more resilience? 📈
$BTC is down -2.87% with an RSI at 49.96, while the $MSTR perp shows a deeper -8.24% drop and an RSI at 50.54. 📊
The +5.37% performance gap highlights the divergence here. $BTC holds above VWAP at 61,861.05, while $MSTR clings to its VWAP at 85.60. 📉
Structure favors $BTC for now if support at 61,772.45 holds.
Are you watching this on the short or the longer timeframe?
#BTC #MSTR #BitcoinAnalysis #BinanceSquare
⚠️ Perpetual contracts are leveraged derivatives, not the stock or commodity itself.
Risk note: leverage magnifies losses. Plan the exit before the entry.
$BTC is down -2.87% with an RSI at 49.96, while the $MSTR perp shows a deeper -8.24% drop and an RSI at 50.54. 📊
The +5.37% performance gap highlights the divergence here. $BTC holds above VWAP at 61,861.05, while $MSTR clings to its VWAP at 85.60. 📉
Structure favors $BTC for now if support at 61,772.45 holds.
Are you watching this on the short or the longer timeframe?
#BTC #MSTR #BitcoinAnalysis #BinanceSquare
⚠️ Perpetual contracts are leveraged derivatives, not the stock or commodity itself.
Risk note: leverage magnifies losses. Plan the exit before the entry.
2
·
--
$BTC versus $MSTR divergence.
The $BTC perp is holding support at 61,772.45 on the 15m chart, showing mild stability despite being below the VWAP at 61,877.51. Meanwhile, the $MSTR perp struggles near support at 84.58, with the +5.71% performance gap highlighting its relative weakness. ⚡
Holders of $BTC watch for a reclaim of the EMA20 at 61,840.01, while those watching $MSTR wait to see if it sustains current levels above the lower Bollinger band at 84.50. 🔥
Which asset do you expect to outperform and why?
#BTC #MSTR #BitcoinAnalysis #CryptoMarket
⚠️ Perpetual contracts are leveraged derivatives, not the stock or commodity itself.
DYOR. Size positions carefully and never trade with money you cannot afford to lose.
$BTC versus $MSTR divergence.
The $BTC perp is holding support at 61,772.45 on the 15m chart, showing mild stability despite being below the VWAP at 61,877.51. Meanwhile, the $MSTR perp struggles near support at 84.58, with the +5.71% performance gap highlighting its relative weakness. ⚡
Holders of $BTC watch for a reclaim of the EMA20 at 61,840.01, while those watching $MSTR wait to see if it sustains current levels above the lower Bollinger band at 84.50. 🔥
Which asset do you expect to outperform and why?
#BTC #MSTR #BitcoinAnalysis #CryptoMarket
⚠️ Perpetual contracts are leveraged derivatives, not the stock or commodity itself.
DYOR. Size positions carefully and never trade with money you cannot afford to lose.
The $BTC perp is holding support at 61,772.45 on the 15m chart, showing mild stability despite being below the VWAP at 61,877.51. Meanwhile, the $MSTR perp struggles near support at 84.58, with the +5.71% performance gap highlighting its relative weakness. ⚡
Holders of $BTC watch for a reclaim of the EMA20 at 61,840.01, while those watching $MSTR wait to see if it sustains current levels above the lower Bollinger band at 84.50. 🔥
Which asset do you expect to outperform and why?
#BTC #MSTR #BitcoinAnalysis #CryptoMarket
⚠️ Perpetual contracts are leveraged derivatives, not the stock or commodity itself.
DYOR. Size positions carefully and never trade with money you cannot afford to lose.
·
--
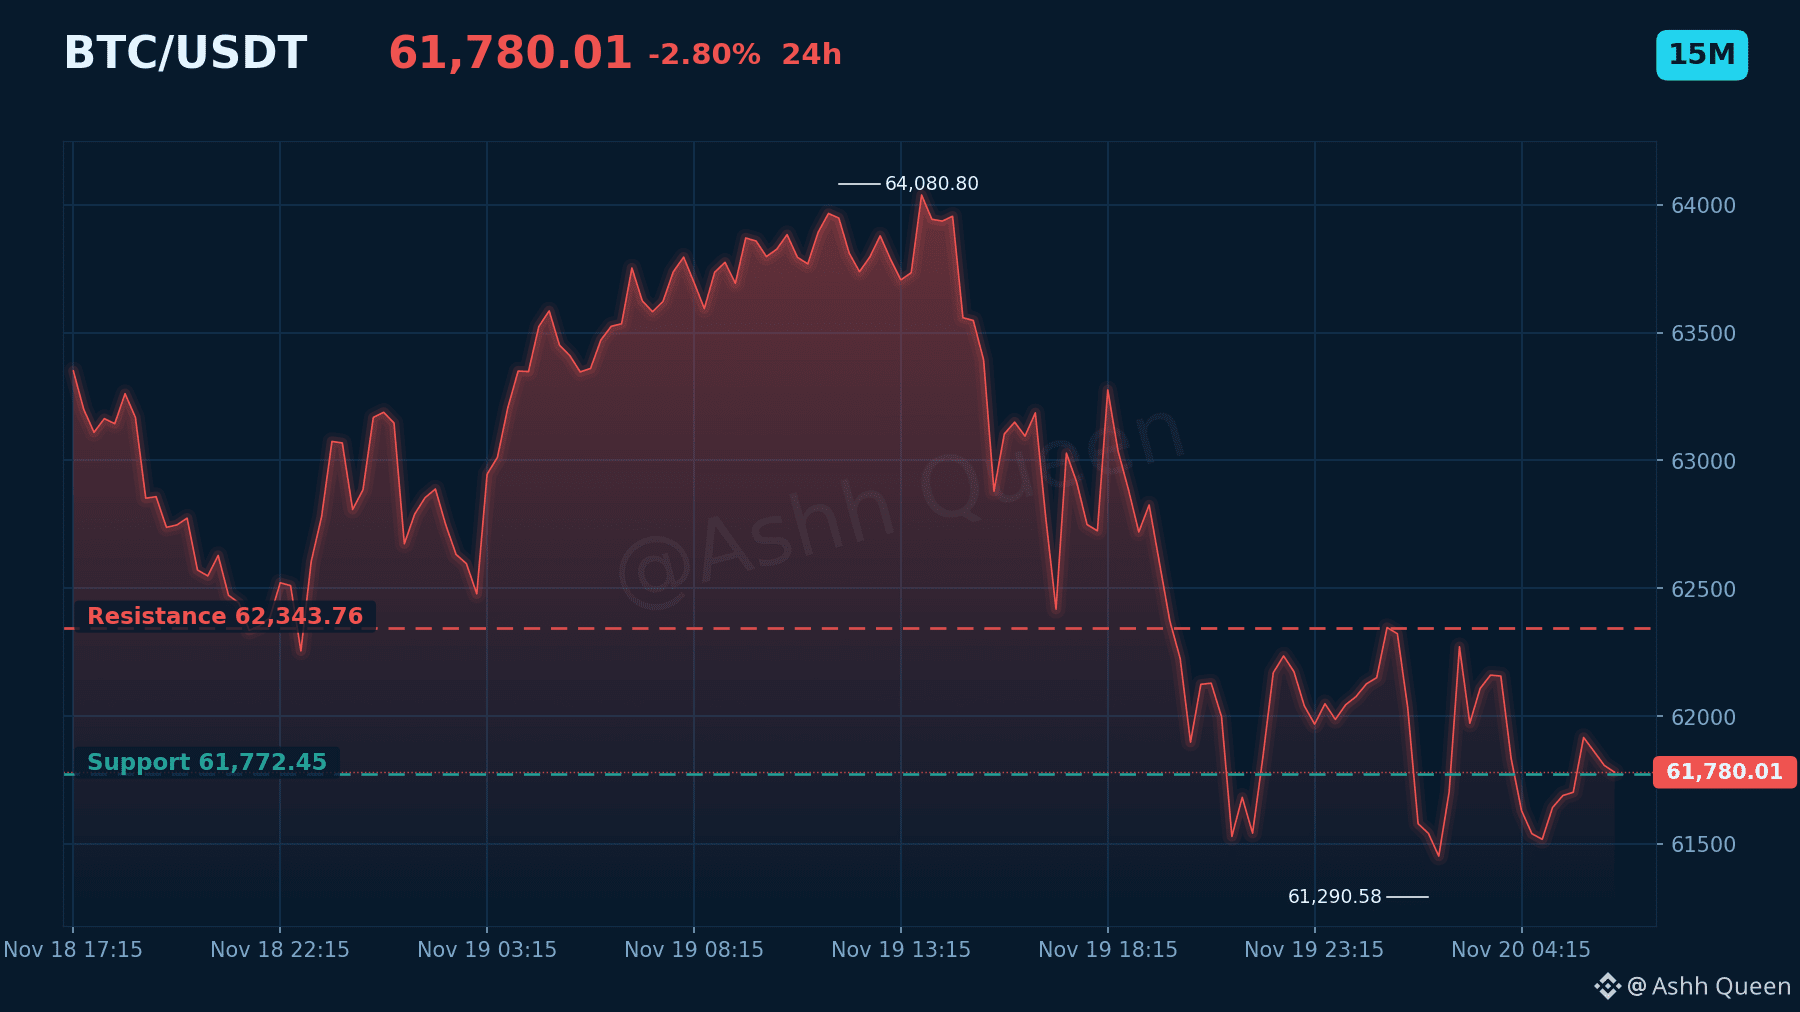
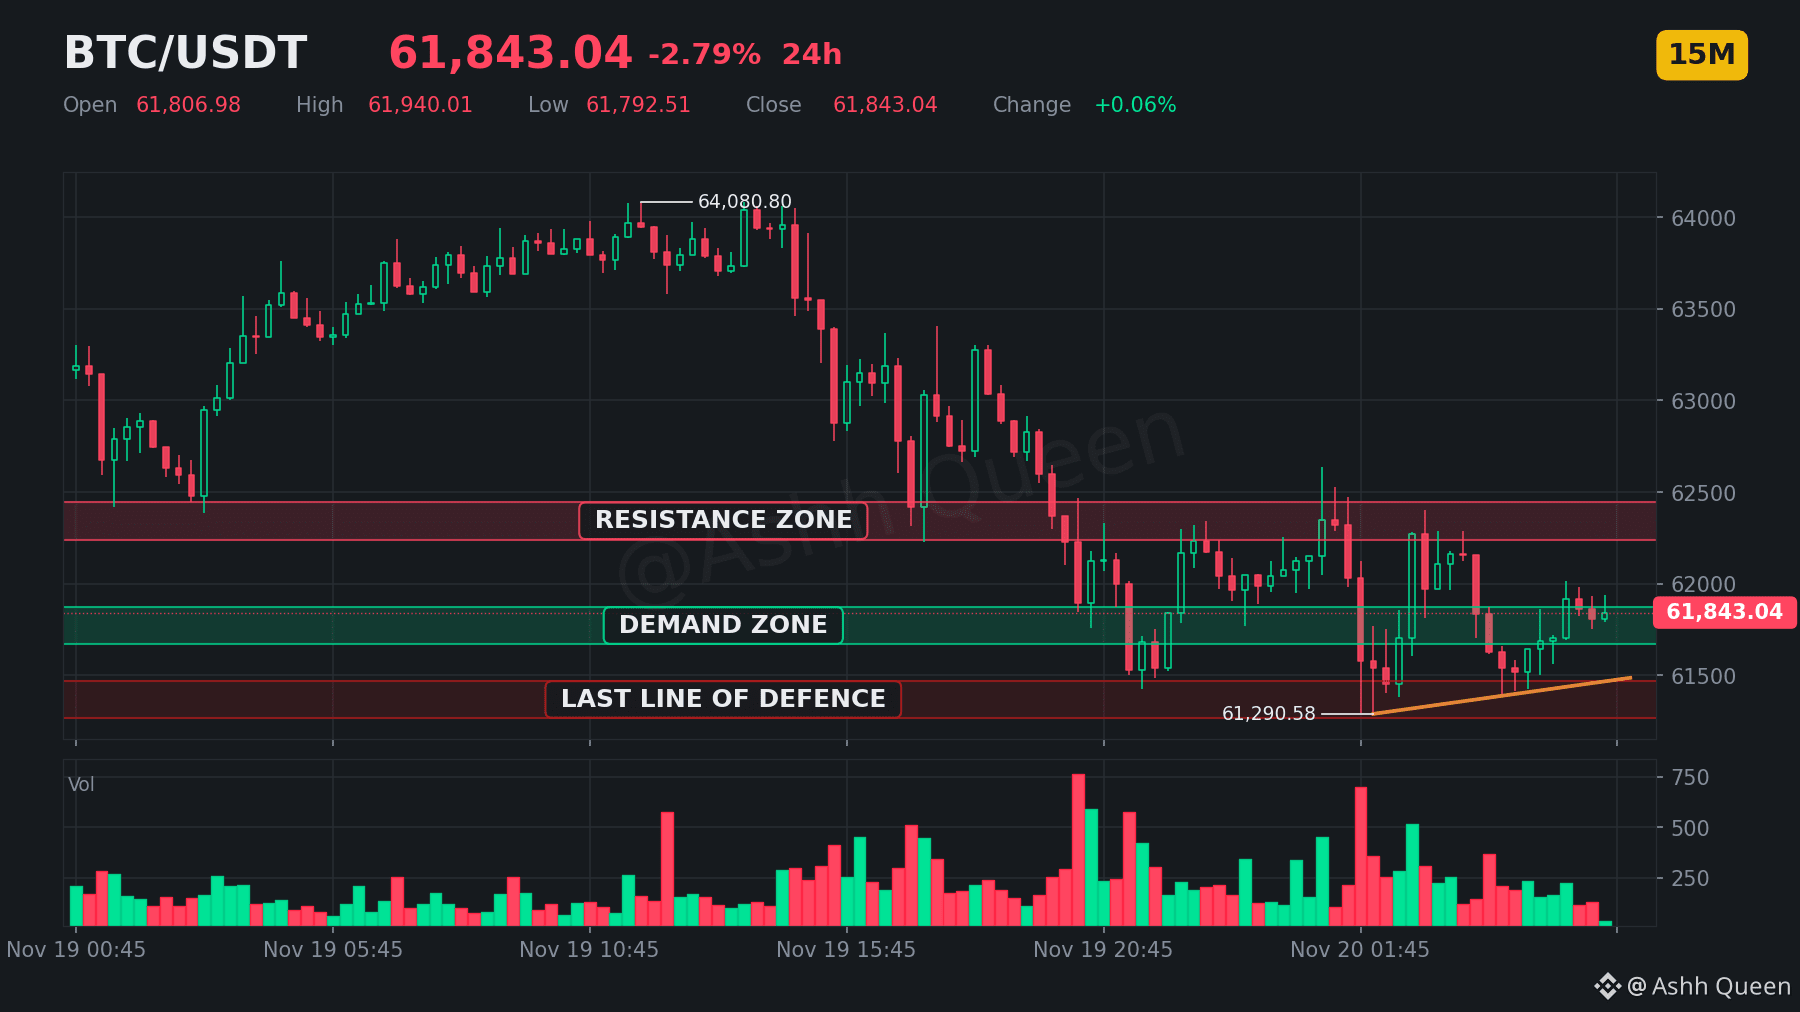
$BTC is grinding sideways while testing key technical boundaries.
Price sits at 61,843.04 with RSI at 48.31, hovering just below VWAP at 61,877.98 and EMA20 at 61,846.01 on the 15m chart. 🔍
Holders should monitor support at 61,772.45 to gauge the trend, while those on the sidelines are looking for a break of resistance at 62,343.76 to confirm any momentum. 💡
What specific price action would change your mind about this neutral stance? ✅
#BTC #BitcoinAnalysis #CryptoCommunity
DYOR. Size positions carefully and never trade with money you cannot afford to lose.
$BTC is grinding sideways while testing key technical boundaries.
Price sits at 61,843.04 with RSI at 48.31, hovering just below VWAP at 61,877.98 and EMA20 at 61,846.01 on the 15m chart. 🔍
Holders should monitor support at 61,772.45 to gauge the trend, while those on the sidelines are looking for a break of resistance at 62,343.76 to confirm any momentum. 💡
What specific price action would change your mind about this neutral stance? ✅
#BTC #BitcoinAnalysis #CryptoCommunity
DYOR. Size positions carefully and never trade with money you cannot afford to lose.
Price sits at 61,843.04 with RSI at 48.31, hovering just below VWAP at 61,877.98 and EMA20 at 61,846.01 on the 15m chart. 🔍
Holders should monitor support at 61,772.45 to gauge the trend, while those on the sidelines are looking for a break of resistance at 62,343.76 to confirm any momentum. 💡
What specific price action would change your mind about this neutral stance? ✅
#BTC #BitcoinAnalysis #CryptoCommunity
DYOR. Size positions carefully and never trade with money you cannot afford to lose.
4
·
--
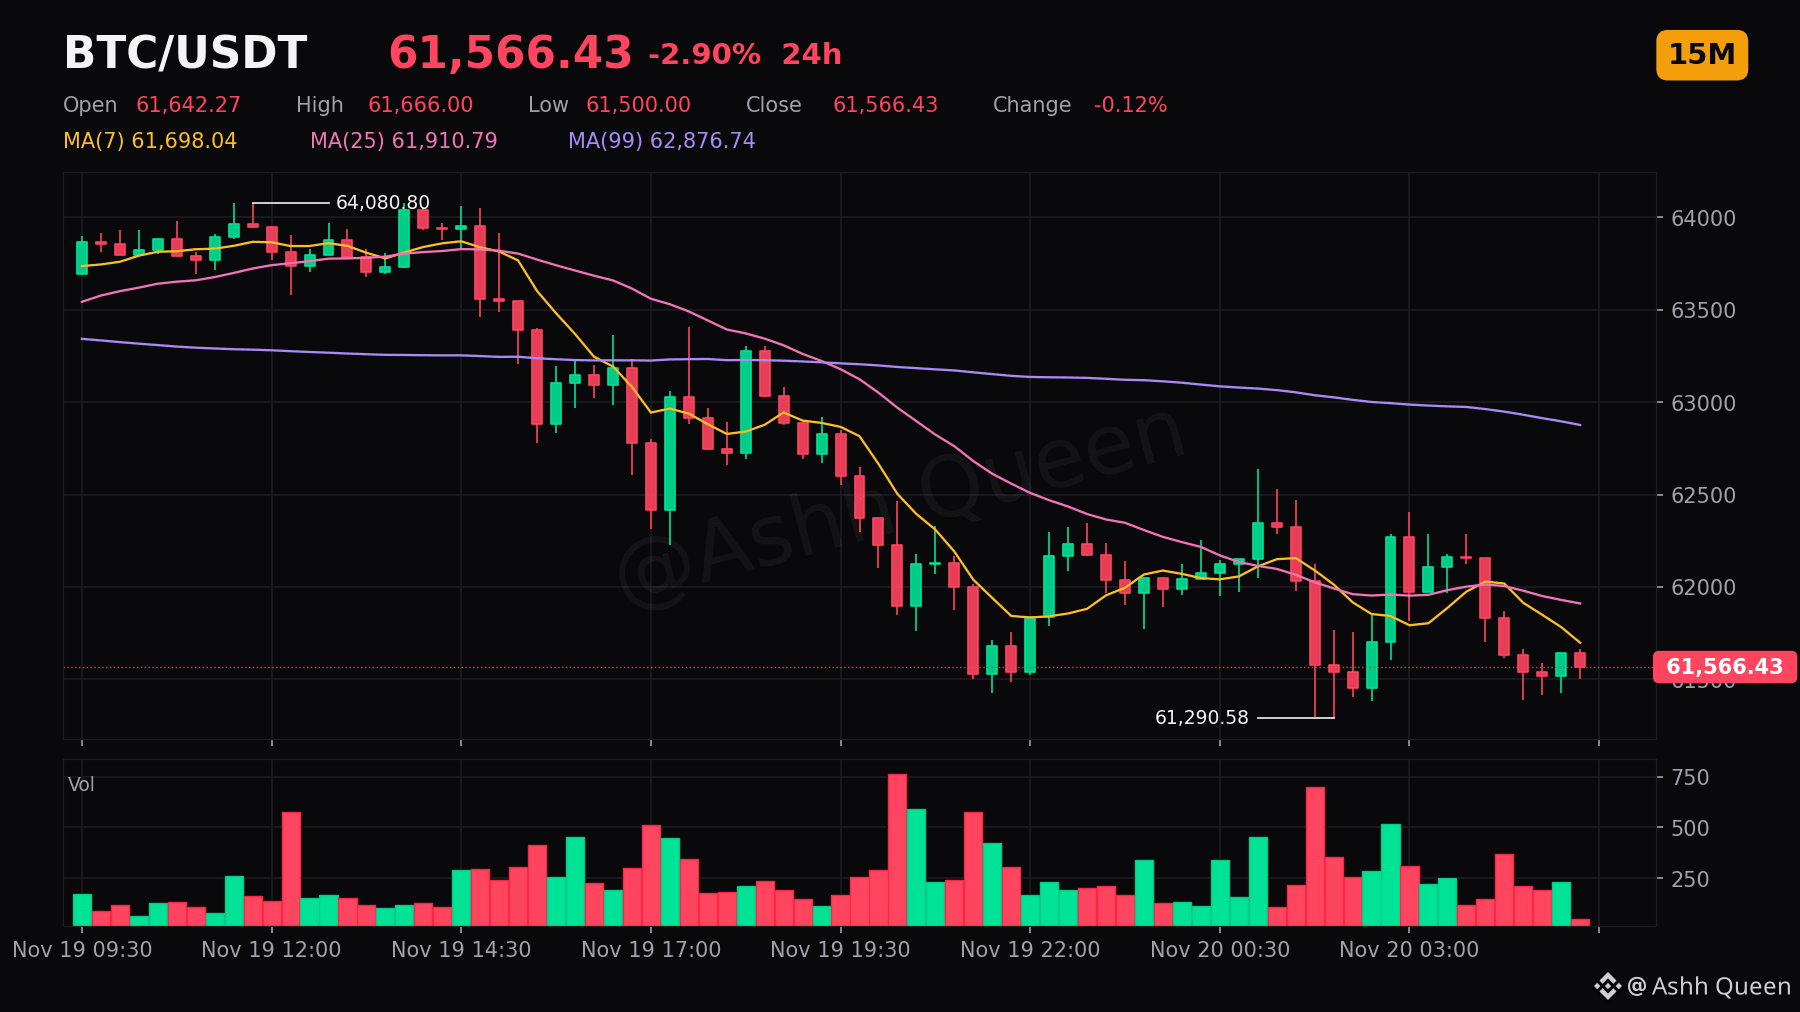
$BTC is currently testing the patience of the bears.
Price at 61,566.43 sits below VWAP at 61,888.04, with RSI at 41.13 signaling a mild bearish lean. We have room to resistance at 0.76% against a distance to support at 0.34%. 🎯
The downside risk looks larger until resistance at 62,034.49 is reclaimed. 🧭
Which level are you watching?
#BTC #Bitcoin #CryptoAnalysis #BitcoinAnalysis
Not financial advice. Protect your capital first, the next setup always comes.
$BTC is currently testing the patience of the bears.
Price at 61,566.43 sits below VWAP at 61,888.04, with RSI at 41.13 signaling a mild bearish lean. We have room to resistance at 0.76% against a distance to support at 0.34%. 🎯
The downside risk looks larger until resistance at 62,034.49 is reclaimed. 🧭
Which level are you watching?
#BTC #Bitcoin #CryptoAnalysis #BitcoinAnalysis
Not financial advice. Protect your capital first, the next setup always comes.
Price at 61,566.43 sits below VWAP at 61,888.04, with RSI at 41.13 signaling a mild bearish lean. We have room to resistance at 0.76% against a distance to support at 0.34%. 🎯
The downside risk looks larger until resistance at 62,034.49 is reclaimed. 🧭
Which level are you watching?
#BTC #Bitcoin #CryptoAnalysis #BitcoinAnalysis
Not financial advice. Protect your capital first, the next setup always comes.
7

Article
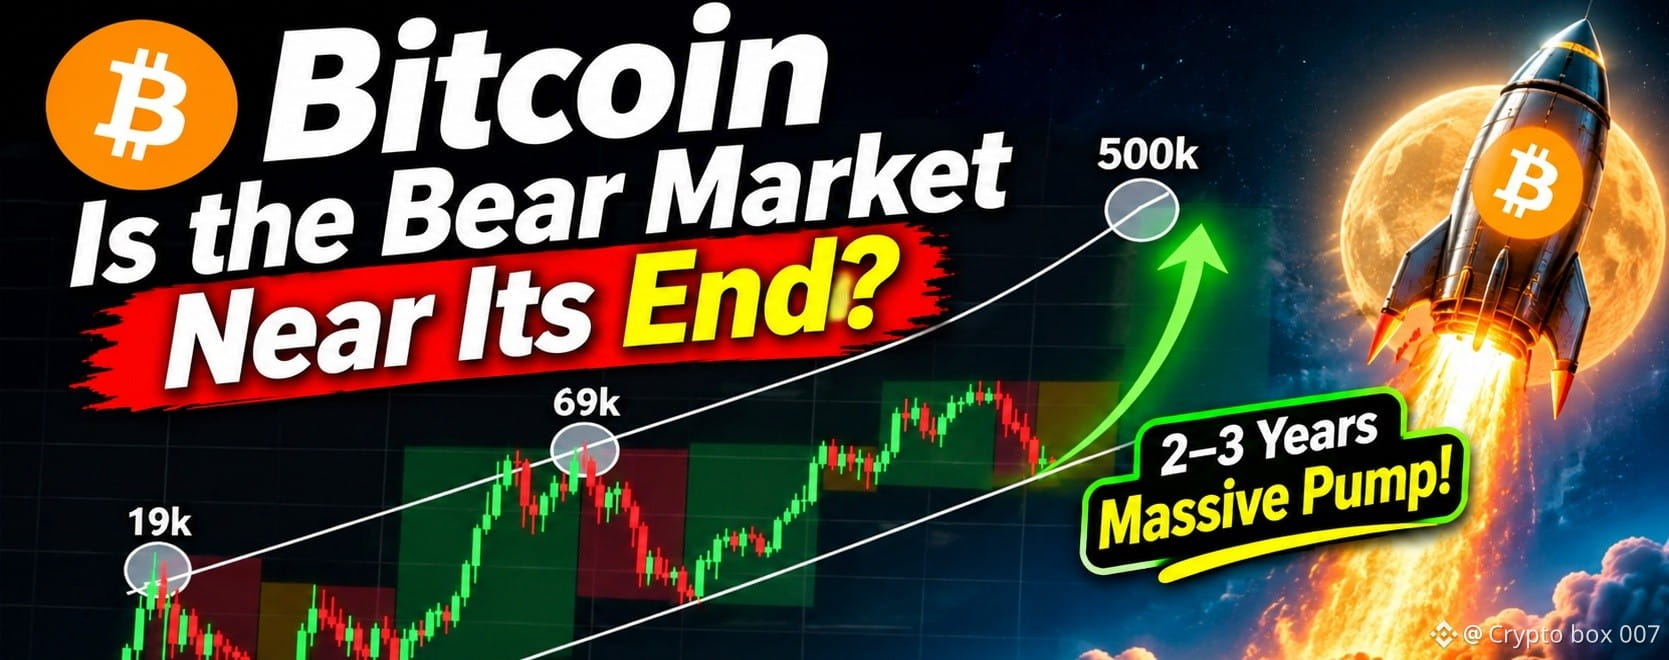
Bitcoin Bear Market Nearing Its End? A Massive Bull Run Could Be Ahead! 🚀Bitcoin's long-term monthly chart is showing an interesting structure that deserves attention.
Looking at previous market cycles, BTC has experienced major corrections followed by powerful bullish expansions. The current price movement could potentially be another important phase in this long-term cycle.
Why Could Bitcoin Be Preparing for Another Bull Run?
📈 1. Long-Term Ascending Channel
Bitcoin has been moving within a broad upward channel over multiple market cycles. The lower boundary could act as an important long-term support zone.
📉 2. Bear Market Exhaustion
After a significant correction, selling pressure may gradually weaken. If buyers regain control and Bitcoin confirms a reversal, the current bearish phase could be approaching its end.
3. The Next 2–3 Years
If historical cycle behavior continues, the next 2–3 years could bring substantial upside potential.
Long-Term Bullish Target: $250K–$500K
A move toward $500,000 is an ambitious long-term scenario, not a guaranteed outcome. It would require strong demand, favorable market conditions, and sustained institutional and investor interest.
My Perspective
I believe Bitcoin deserves serious attention at these long-term levels. Instead of focusing only on short-term volatility, investors should watch the bigger picture.
The bear market may be nearing its final stages, but confirmation is essential.
Stay patient. Manage risk. Think long term.
The next major Bitcoin expansion could be closer than many expect.
#Bitcoin #BTC #Crypto #BullRun #BTC500K #BitcoinAnalysis $BTC
{future}(BTCUSDT)
Bitcoin Bear Market Nearing Its End? A Massive Bull Run Could Be Ahead! 🚀
Bitcoin's long-term monthly chart is showing an interesting structure that deserves attention.
Looking at previous market cycles, BTC has experienced major corrections followed by powerful bullish expansions. The current price movement could potentially be another important phase in this long-term cycle.
Why Could Bitcoin Be Preparing for Another Bull Run?
📈 1. Long-Term Ascending Channel
Bitcoin has been moving within a broad upward channel over multiple market cycles. The lower boundary could act as an important long-term support zone.
📉 2. Bear Market Exhaustion
After a significant correction, selling pressure may gradually weaken. If buyers regain control and Bitcoin confirms a reversal, the current bearish phase could be approaching its end.
3. The Next 2–3 Years
If historical cycle behavior continues, the next 2–3 years could bring substantial upside potential.
Long-Term Bullish Target: $250K–$500K
A move toward $500,000 is an ambitious long-term scenario, not a guaranteed outcome. It would require strong demand, favorable market conditions, and sustained institutional and investor interest.
My Perspective
I believe Bitcoin deserves serious attention at these long-term levels. Instead of focusing only on short-term volatility, investors should watch the bigger picture.
The bear market may be nearing its final stages, but confirmation is essential.
Stay patient. Manage risk. Think long term.
The next major Bitcoin expansion could be closer than many expect.
#Bitcoin #BTC #Crypto #BullRun #BTC500K #BitcoinAnalysis $BTC
Looking at previous market cycles, BTC has experienced major corrections followed by powerful bullish expansions. The current price movement could potentially be another important phase in this long-term cycle.
Why Could Bitcoin Be Preparing for Another Bull Run?
📈 1. Long-Term Ascending Channel
Bitcoin has been moving within a broad upward channel over multiple market cycles. The lower boundary could act as an important long-term support zone.
📉 2. Bear Market Exhaustion
After a significant correction, selling pressure may gradually weaken. If buyers regain control and Bitcoin confirms a reversal, the current bearish phase could be approaching its end.
3. The Next 2–3 Years
If historical cycle behavior continues, the next 2–3 years could bring substantial upside potential.
Long-Term Bullish Target: $250K–$500K
A move toward $500,000 is an ambitious long-term scenario, not a guaranteed outcome. It would require strong demand, favorable market conditions, and sustained institutional and investor interest.
My Perspective
I believe Bitcoin deserves serious attention at these long-term levels. Instead of focusing only on short-term volatility, investors should watch the bigger picture.
The bear market may be nearing its final stages, but confirmation is essential.
Stay patient. Manage risk. Think long term.
The next major Bitcoin expansion could be closer than many expect.
#Bitcoin #BTC #Crypto #BullRun #BTC500K #BitcoinAnalysis $BTC
3
224

🚨 BITCOIN WARNING: 62% OF SHORT-TERM HOLDERS ARE NOW UNDERWATER!
A major shift is happening in Bitcoin's market structure.
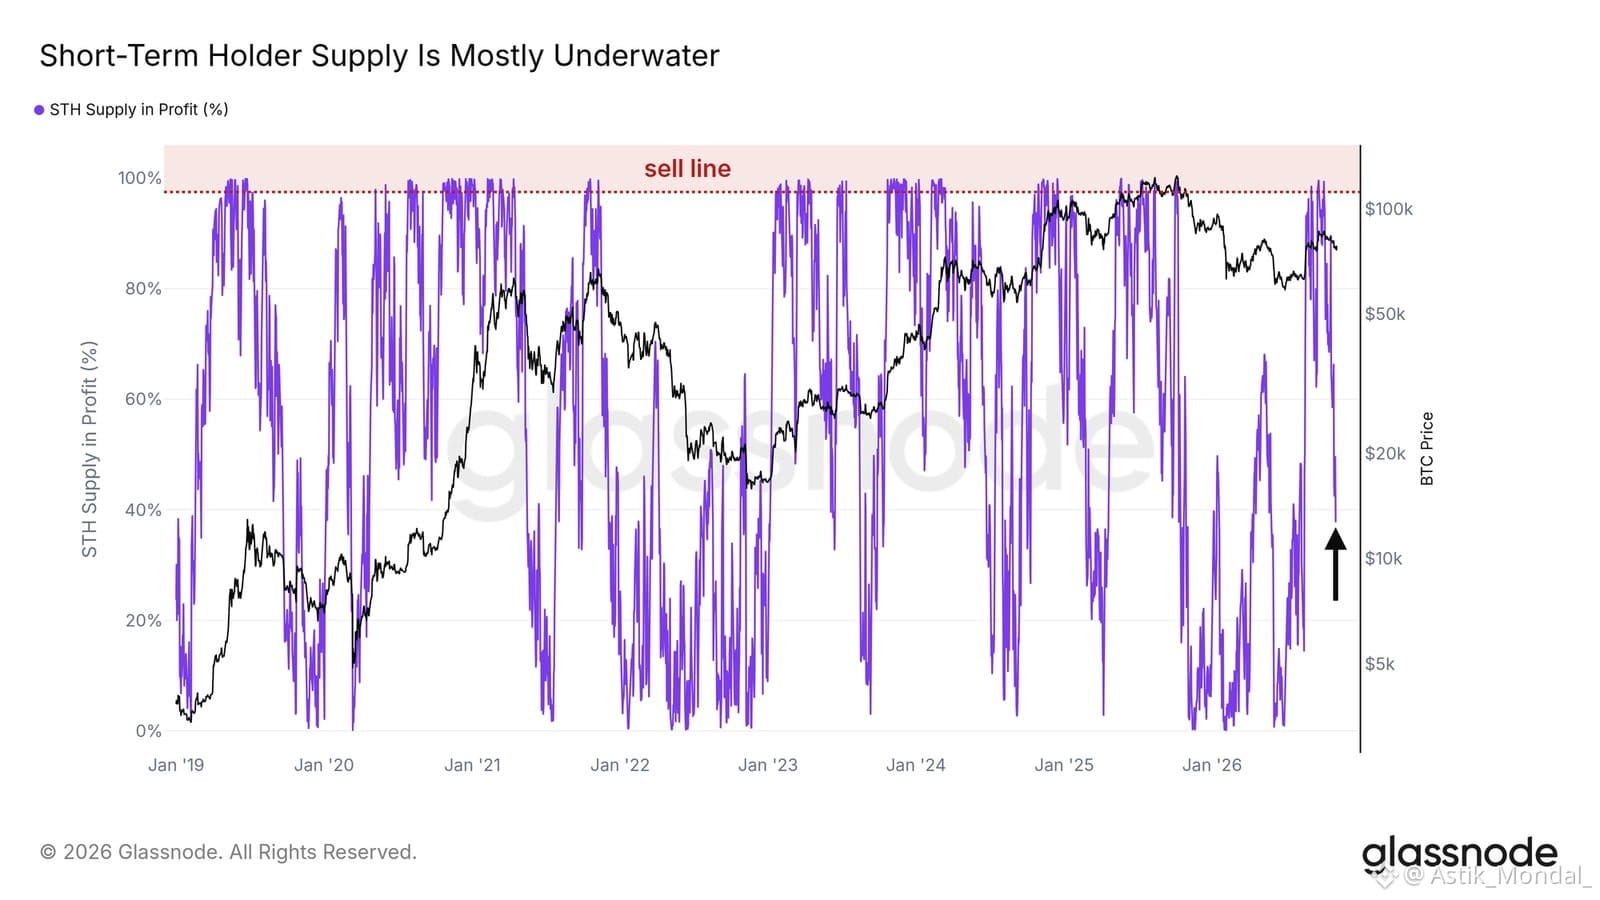
According to Glassnode, Short-Term Holder (STH) Supply in Profit has collapsed from approximately 97.5% in early October to just 38% now.
That's a massive change in investor positioning.
Here's why this matters:
🔴 In early October, almost every recent Bitcoin buyer was sitting in profit. This pushed the metric into the 97.5% sell zone, where profit-taking pressure can increase.
🔴 After Bitcoin's roughly 10% pullback from its September high, most short-term holders are now holding at a loss.
🔴 This suggests the market has moved away from the extremely overheated conditions seen earlier.
But there's an important level to watch.
50% STH Supply in Profit.
If Bitcoin recovers above this level while maintaining price strength, it could signal that newer investors are returning to profitability and regaining confidence.
If it continues struggling below 50%, short-term holder sentiment may remain weak.
🔥 THE BIGGER PICTURE:
Bitcoin's market structure has cooled significantly.
The next major signal will be whether new buyers regain confidence or selling pressure continues.
Watch the 50% level. It could become a key indicator of Bitcoin's next move.
#Bitcoin #BTC #CryptoMarket #Glassnode #BitcoinAnalysis
🚨 BITCOIN WARNING: 62% OF SHORT-TERM HOLDERS ARE NOW UNDERWATER!
A major shift is happening in Bitcoin's market structure.
According to Glassnode, Short-Term Holder (STH) Supply in Profit has collapsed from approximately 97.5% in early October to just 38% now.
That's a massive change in investor positioning.
Here's why this matters:
🔴 In early October, almost every recent Bitcoin buyer was sitting in profit. This pushed the metric into the 97.5% sell zone, where profit-taking pressure can increase.
🔴 After Bitcoin's roughly 10% pullback from its September high, most short-term holders are now holding at a loss.
🔴 This suggests the market has moved away from the extremely overheated conditions seen earlier.
But there's an important level to watch.
50% STH Supply in Profit.
If Bitcoin recovers above this level while maintaining price strength, it could signal that newer investors are returning to profitability and regaining confidence.
If it continues struggling below 50%, short-term holder sentiment may remain weak.
🔥 THE BIGGER PICTURE:
Bitcoin's market structure has cooled significantly.
The next major signal will be whether new buyers regain confidence or selling pressure continues.
Watch the 50% level. It could become a key indicator of Bitcoin's next move.
#Bitcoin #BTC #CryptoMarket #Glassnode #BitcoinAnalysis
A major shift is happening in Bitcoin's market structure.
According to Glassnode, Short-Term Holder (STH) Supply in Profit has collapsed from approximately 97.5% in early October to just 38% now.
That's a massive change in investor positioning.
Here's why this matters:
🔴 In early October, almost every recent Bitcoin buyer was sitting in profit. This pushed the metric into the 97.5% sell zone, where profit-taking pressure can increase.
🔴 After Bitcoin's roughly 10% pullback from its September high, most short-term holders are now holding at a loss.
🔴 This suggests the market has moved away from the extremely overheated conditions seen earlier.
But there's an important level to watch.
50% STH Supply in Profit.
If Bitcoin recovers above this level while maintaining price strength, it could signal that newer investors are returning to profitability and regaining confidence.
If it continues struggling below 50%, short-term holder sentiment may remain weak.
🔥 THE BIGGER PICTURE:
Bitcoin's market structure has cooled significantly.
The next major signal will be whether new buyers regain confidence or selling pressure continues.
Watch the 50% level. It could become a key indicator of Bitcoin's next move.
#Bitcoin #BTC #CryptoMarket #Glassnode #BitcoinAnalysis
1
33

·
--
📉 BTC: Bulls Need to Prove Their Strength!
Bitcoin has shown a rebound, but selling pressure remains a concern.
My trading approach:
🔴 If BTC loses support and confirms a breakdown, I'll watch for a short opportunity.
🟢 If BTC reclaims resistance and holds it, the bullish case becomes stronger.
No guessing. Confirmation first.
Are you looking for a BTC long or short?
$BTC $USDT $ETH
#BitcoinAnalysis #BTCUSDT #CryptoTrading #TechnicalAnalysis
Follow for more market setups!
📉 BTC: Bulls Need to Prove Their Strength!
Bitcoin has shown a rebound, but selling pressure remains a concern.
My trading approach:
🔴 If BTC loses support and confirms a breakdown, I'll watch for a short opportunity.
🟢 If BTC reclaims resistance and holds it, the bullish case becomes stronger.
No guessing. Confirmation first.
Are you looking for a BTC long or short?
$BTC $USDT $ETH
#BitcoinAnalysis #BTCUSDT #CryptoTrading #TechnicalAnalysis
Follow for more market setups!
Bitcoin has shown a rebound, but selling pressure remains a concern.
My trading approach:
🔴 If BTC loses support and confirms a breakdown, I'll watch for a short opportunity.
🟢 If BTC reclaims resistance and holds it, the bullish case becomes stronger.
No guessing. Confirmation first.
Are you looking for a BTC long or short?
$BTC $USDT $ETH
#BitcoinAnalysis #BTCUSDT #CryptoTrading #TechnicalAnalysis
Follow for more market setups!
61

·
--
🚨 BITCOIN ($BTC ) — Can Bulls Take Back Control?
Bitcoin is showing signs of a short-term recovery, but the overall market still needs stronger confirmation.
BTC recently dropped below $63K before recovering towards the $64K area. However, selling pressure remains a concern as traders continue watching the Federal Reserve's hawkish outlook and institutional fund flows.
📊 What matters now?
- Buyers need to defend the $62K support zone.
- A strong move above $64.5K could improve bullish momentum.
- Failure to hold support may bring another round of downside pressure.
My Market View:
I'm watching Bitcoin carefully rather than rushing into a trade. A recovery candle alone doesn't confirm a trend reversal. Volume, support and resistance, and market structure all matter.
No FOMO. No blind entries. Let the market confirm its direction first.
💬 What do you think?
Is BTC preparing for a recovery, or could we see another correction?
#Bitcoin #BTC #CryptoMarket #BitcoinAnalysis #CryptoTrading
🚨 BITCOIN ($BTC ) — Can Bulls Take Back Control?
Bitcoin is showing signs of a short-term recovery, but the overall market still needs stronger confirmation.
BTC recently dropped below $63K before recovering towards the $64K area. However, selling pressure remains a concern as traders continue watching the Federal Reserve's hawkish outlook and institutional fund flows.
📊 What matters now?
- Buyers need to defend the $62K support zone.
- A strong move above $64.5K could improve bullish momentum.
- Failure to hold support may bring another round of downside pressure.
My Market View:
I'm watching Bitcoin carefully rather than rushing into a trade. A recovery candle alone doesn't confirm a trend reversal. Volume, support and resistance, and market structure all matter.
No FOMO. No blind entries. Let the market confirm its direction first.
💬 What do you think?
Is BTC preparing for a recovery, or could we see another correction?
#Bitcoin #BTC #CryptoMarket #BitcoinAnalysis #CryptoTrading
Bitcoin is showing signs of a short-term recovery, but the overall market still needs stronger confirmation.
BTC recently dropped below $63K before recovering towards the $64K area. However, selling pressure remains a concern as traders continue watching the Federal Reserve's hawkish outlook and institutional fund flows.
📊 What matters now?
- Buyers need to defend the $62K support zone.
- A strong move above $64.5K could improve bullish momentum.
- Failure to hold support may bring another round of downside pressure.
My Market View:
I'm watching Bitcoin carefully rather than rushing into a trade. A recovery candle alone doesn't confirm a trend reversal. Volume, support and resistance, and market structure all matter.
No FOMO. No blind entries. Let the market confirm its direction first.
💬 What do you think?
Is BTC preparing for a recovery, or could we see another correction?
#Bitcoin #BTC #CryptoMarket #BitcoinAnalysis #CryptoTrading
2
211

I'm watching Bitcoin closely, but I don't think this is the moment to get blindly bullish.
$BTC is hovering around $63,450, almost 50% below its October 2025 ATH of $126,198. The weekly decline is around 14%, and the market sentiment has fallen into extreme fear.
What I find more interesting is what's happening underneath the price.
Bitcoin futures open interest is around $42.38 billion, up 3.32%, while spot volume is considerably weaker. Around $161 million in positions were liquidated in the last 24 hours, with long positions taking most of the damage. US spot Bitcoin ETFs also recorded approximately $240 million in net outflows on November 17.
This tells me one thing: traders are still taking positions, but institutional spot demand hasn't shown convincing strength yet.
Here are the levels I'm watching:
$62,000–$62,800: Important support zone.
$64,000: Key short-term pivot.
$65,200–$65,500: First recovery area to reclaim.
If BTC holds support and starts reclaiming $64K with stronger spot buying, we could see a relief rally. But a breakdown below $62K could open the door to another leg down.
Personally, I'm more interested in seeing where the actual buying comes from than predicting a bottom.
One question for BTC traders Are we witnessing a genuine accumulation opportunity, or is Bitcoin preparing for another major drop?
Don't just say bullish or bearish. Tell me why.
#Bitcoin #BitcoinAnalysis
I'm watching Bitcoin closely, but I don't think this is the moment to get blindly bullish.
$BTC is hovering around $63,450, almost 50% below its October 2025 ATH of $126,198. The weekly decline is around 14%, and the market sentiment has fallen into extreme fear.
What I find more interesting is what's happening underneath the price.
Bitcoin futures open interest is around $42.38 billion, up 3.32%, while spot volume is considerably weaker. Around $161 million in positions were liquidated in the last 24 hours, with long positions taking most of the damage. US spot Bitcoin ETFs also recorded approximately $240 million in net outflows on November 17.
This tells me one thing: traders are still taking positions, but institutional spot demand hasn't shown convincing strength yet.
Here are the levels I'm watching:
$62,000–$62,800: Important support zone.
$64,000: Key short-term pivot.
$65,200–$65,500: First recovery area to reclaim.
If BTC holds support and starts reclaiming $64K with stronger spot buying, we could see a relief rally. But a breakdown below $62K could open the door to another leg down.
Personally, I'm more interested in seeing where the actual buying comes from than predicting a bottom.
One question for BTC traders Are we witnessing a genuine accumulation opportunity, or is Bitcoin preparing for another major drop?
Don't just say bullish or bearish. Tell me why.
#Bitcoin #BitcoinAnalysis
$BTC is hovering around $63,450, almost 50% below its October 2025 ATH of $126,198. The weekly decline is around 14%, and the market sentiment has fallen into extreme fear.
What I find more interesting is what's happening underneath the price.
Bitcoin futures open interest is around $42.38 billion, up 3.32%, while spot volume is considerably weaker. Around $161 million in positions were liquidated in the last 24 hours, with long positions taking most of the damage. US spot Bitcoin ETFs also recorded approximately $240 million in net outflows on November 17.
This tells me one thing: traders are still taking positions, but institutional spot demand hasn't shown convincing strength yet.
Here are the levels I'm watching:
$62,000–$62,800: Important support zone.
$64,000: Key short-term pivot.
$65,200–$65,500: First recovery area to reclaim.
If BTC holds support and starts reclaiming $64K with stronger spot buying, we could see a relief rally. But a breakdown below $62K could open the door to another leg down.
Personally, I'm more interested in seeing where the actual buying comes from than predicting a bottom.
One question for BTC traders Are we witnessing a genuine accumulation opportunity, or is Bitcoin preparing for another major drop?
Don't just say bullish or bearish. Tell me why.
#Bitcoin #BitcoinAnalysis

Trong_Hatachi:
Spot buying feels like the key signal here, especially with $42.38B in futures OI but weaker spot volume. What would convince you accumulation is real? Follow back if you’d like to keep discussing BTC.
2
1
2.2k

📉 BITCOIN UNDER PRESSURE! IS A RECOVERY COMING?
Good evening, crypto community! 👋
Let's talk about the crypto market.
📊 Market observation:
Bitcoin is facing selling pressure, while Ethereum and BNB are also showing weakness.
The market is giving mixed signals, and traders should be careful before entering new positions.
💭 My opinion:
I believe patience is more important than rushing into a trade.
I would like to see stronger buying momentum and confirmation before expecting a recovery.
Remember, one green candle does not mean a bullish trend has started.
🔥 Let's discuss!
What do you think about Bitcoin right now?
1️⃣ Bullish 📈
2️⃣ Bearish 📉
3️⃣ Sideways ➡️
Share your opinion in the comments!
#bitcoin #Ethereum✅ #bnb #CryptoMarketAlert #BitcoinAnalysis
📉 BITCOIN UNDER PRESSURE! IS A RECOVERY COMING?
Good evening, crypto community! 👋
Let's talk about the crypto market.
📊 Market observation:
Bitcoin is facing selling pressure, while Ethereum and BNB are also showing weakness.
The market is giving mixed signals, and traders should be careful before entering new positions.
💭 My opinion:
I believe patience is more important than rushing into a trade.
I would like to see stronger buying momentum and confirmation before expecting a recovery.
Remember, one green candle does not mean a bullish trend has started.
🔥 Let's discuss!
What do you think about Bitcoin right now?
1️⃣ Bullish 📈
2️⃣ Bearish 📉
3️⃣ Sideways ➡️
Share your opinion in the comments!
#bitcoin #Ethereum✅ #bnb #CryptoMarketAlert #BitcoinAnalysis
Good evening, crypto community! 👋
Let's talk about the crypto market.
📊 Market observation:
Bitcoin is facing selling pressure, while Ethereum and BNB are also showing weakness.
The market is giving mixed signals, and traders should be careful before entering new positions.
💭 My opinion:
I believe patience is more important than rushing into a trade.
I would like to see stronger buying momentum and confirmation before expecting a recovery.
Remember, one green candle does not mean a bullish trend has started.
🔥 Let's discuss!
What do you think about Bitcoin right now?
1️⃣ Bullish 📈
2️⃣ Bearish 📉
3️⃣ Sideways ➡️
Share your opinion in the comments!
#bitcoin #Ethereum✅ #bnb #CryptoMarketAlert #BitcoinAnalysis
85

📅 NOV 19 MARKET PULSE | EXTREME FEAR (20)
$BTC: ~$63,600
$ETH: ~$1,800
Market Cap: $2.17T
Why it’s bleeding: Fed rate hike anxiety + spot ETF outflows are keeping buyers on the sidelines.
Key Zones:
🛡️ Support: $62,000 (Must hold)
🚧 Resistance: $65,000 – $66,000
⚠️ Rule of the day: Don't catch falling knives with high leverage.
Patience pays more than prediction.
$BTC :🟢 $66,600 or 🔴 $60,600?
{future}(BTCUSDT)
$ETH
{future}(ETHUSDT)
#CanGTA6'sLaunchLiftTTWOShares? #FOMCMinutesHighlightAIDebtRisks #BTC #Write2Earn #BitcoinAnalysis
📅 NOV 19 MARKET PULSE | EXTREME FEAR (20)
$BTC : ~$63,600
$ETH : ~$1,800
Market Cap: $2.17T
Why it’s bleeding: Fed rate hike anxiety + spot ETF outflows are keeping buyers on the sidelines.
Key Zones:
🛡️ Support: $62,000 (Must hold)
🚧 Resistance: $65,000 – $66,000
⚠️ Rule of the day: Don't catch falling knives with high leverage.
Patience pays more than prediction.
$BTC :🟢 $66,600 or 🔴 $60,600?
$ETH
#CanGTA6'sLaunchLiftTTWOShares? #FOMCMinutesHighlightAIDebtRisks #BTC #Write2Earn #BitcoinAnalysis
$BTC : ~$63,600
$ETH : ~$1,800
Market Cap: $2.17T
Why it’s bleeding: Fed rate hike anxiety + spot ETF outflows are keeping buyers on the sidelines.
Key Zones:
🛡️ Support: $62,000 (Must hold)
🚧 Resistance: $65,000 – $66,000
⚠️ Rule of the day: Don't catch falling knives with high leverage.
Patience pays more than prediction.
$BTC :🟢 $66,600 or 🔴 $60,600?
$ETH
#CanGTA6'sLaunchLiftTTWOShares? #FOMCMinutesHighlightAIDebtRisks #BTC #Write2Earn #BitcoinAnalysis
112
·
--
₿ BITCOIN: Is the Market Preparing for Its Next Big Move?
Bitcoin continues to face market uncertainty as traders closely monitor momentum, buying pressure, and key technical levels.
The current market environment requires patience. A strong recovery needs more than a few green candles — buyers must demonstrate consistent strength and support it with trading volume.
What I'm watching right now:
📊 Market Structure: Can BTC establish a stronger bullish structure?
📈 Buying Pressure: Increased demand could help Bitcoin regain momentum.
🎯 Resistance: A confirmed breakout may open the door for another recovery attempt.
⚠️ Downside Risk: Losing important support could trigger additional selling pressure.
My approach remains simple: no FOMO, no blind entries. Wait for confirmation, define your stop loss, and protect your capital.
Let's discuss!
Do you think Bitcoin will recover from here or face another correction?
🐂 BULLISH
🐻 BEARISH
⏳ WAITING FOR CONFIRMATION
#Bitcoin #BTC #CryptoMarket #BitcoinAnalysis
$BTC
{future}(BTCUSDT)
₿ BITCOIN: Is the Market Preparing for Its Next Big Move?
Bitcoin continues to face market uncertainty as traders closely monitor momentum, buying pressure, and key technical levels.
The current market environment requires patience. A strong recovery needs more than a few green candles — buyers must demonstrate consistent strength and support it with trading volume.
What I'm watching right now:
📊 Market Structure: Can BTC establish a stronger bullish structure?
📈 Buying Pressure: Increased demand could help Bitcoin regain momentum.
🎯 Resistance: A confirmed breakout may open the door for another recovery attempt.
⚠️ Downside Risk: Losing important support could trigger additional selling pressure.
My approach remains simple: no FOMO, no blind entries. Wait for confirmation, define your stop loss, and protect your capital.
Let's discuss!
Do you think Bitcoin will recover from here or face another correction?
🐂 BULLISH
🐻 BEARISH
⏳ WAITING FOR CONFIRMATION
#Bitcoin #BTC #CryptoMarket #BitcoinAnalysis
$BTC
Bitcoin continues to face market uncertainty as traders closely monitor momentum, buying pressure, and key technical levels.
The current market environment requires patience. A strong recovery needs more than a few green candles — buyers must demonstrate consistent strength and support it with trading volume.
What I'm watching right now:
📊 Market Structure: Can BTC establish a stronger bullish structure?
📈 Buying Pressure: Increased demand could help Bitcoin regain momentum.
🎯 Resistance: A confirmed breakout may open the door for another recovery attempt.
⚠️ Downside Risk: Losing important support could trigger additional selling pressure.
My approach remains simple: no FOMO, no blind entries. Wait for confirmation, define your stop loss, and protect your capital.
Let's discuss!
Do you think Bitcoin will recover from here or face another correction?
🐂 BULLISH
🐻 BEARISH
⏳ WAITING FOR CONFIRMATION
#Bitcoin #BTC #CryptoMarket #BitcoinAnalysis
$BTC

1
87

🚨 BITCOIN UNDER PRESSURE: IS THE MARKET ENTERING A NEW PHASE OF FEAR?{spot}(BTCUSDT)
The cryptocurrency market is facing another challenging moment.
On November 19, Bitcoin traded around the $63,000 level, while Ethereum struggled to stay above $1,800. Market sentiment also weakened, with the Fear & Greed Index reaching 10 — a sign of extreme fear.
📉 What Is Happening in the Market?
Here are three developments worth watching:
1️⃣ Bitcoin Price Pressure
Bitcoin has faced renewed selling pressure, making its next recovery attempt important to watch.
2️⃣ Institutional ETF Outflows
Recent reports indicate continued withdrawals from US spot Bitcoin ETFs. This suggests that some institutional investors are reducing their exposure to risk.
3️⃣ Extreme Market Fear
When fear increases, investors often become more cautious. However, fear alone does not tell us where the market will move next.
💡 My Personal View
I believe this is a time for patience rather than emotional decisions.
A market correction can create opportunities, but it can also bring more downside risk. Understanding market conditions, managing risk, and doing proper research are essential.
🔥 Let's Talk!
Do you think Bitcoin can recover from this market pressure, or could we see another correction?
Are you currently:
🟢 Bullish
🔴 Bearish
🟡 Waiting for confirmation
Share your thoughts below!
$BTC $ETH $BNB
#Bitcoin #CryptoNews #BinanceSquare #BitcoinAnalysis #Ethereum
🚨 BITCOIN UNDER PRESSURE: IS THE MARKET ENTERING A NEW PHASE OF FEAR?
The cryptocurrency market is facing another challenging moment.
On November 19, Bitcoin traded around the $63,000 level, while Ethereum struggled to stay above $1,800. Market sentiment also weakened, with the Fear & Greed Index reaching 10 — a sign of extreme fear.
📉 What Is Happening in the Market?
Here are three developments worth watching:
1️⃣ Bitcoin Price Pressure
Bitcoin has faced renewed selling pressure, making its next recovery attempt important to watch.
2️⃣ Institutional ETF Outflows
Recent reports indicate continued withdrawals from US spot Bitcoin ETFs. This suggests that some institutional investors are reducing their exposure to risk.
3️⃣ Extreme Market Fear
When fear increases, investors often become more cautious. However, fear alone does not tell us where the market will move next.
💡 My Personal View
I believe this is a time for patience rather than emotional decisions.
A market correction can create opportunities, but it can also bring more downside risk. Understanding market conditions, managing risk, and doing proper research are essential.
🔥 Let's Talk!
Do you think Bitcoin can recover from this market pressure, or could we see another correction?
Are you currently:
🟢 Bullish
🔴 Bearish
🟡 Waiting for confirmation
Share your thoughts below!
$BTC $ETH $BNB
#Bitcoin #CryptoNews #BinanceSquare #BitcoinAnalysis #Ethereum
On November 19, Bitcoin traded around the $63,000 level, while Ethereum struggled to stay above $1,800. Market sentiment also weakened, with the Fear & Greed Index reaching 10 — a sign of extreme fear.
📉 What Is Happening in the Market?
Here are three developments worth watching:
1️⃣ Bitcoin Price Pressure
Bitcoin has faced renewed selling pressure, making its next recovery attempt important to watch.
2️⃣ Institutional ETF Outflows
Recent reports indicate continued withdrawals from US spot Bitcoin ETFs. This suggests that some institutional investors are reducing their exposure to risk.
3️⃣ Extreme Market Fear
When fear increases, investors often become more cautious. However, fear alone does not tell us where the market will move next.
💡 My Personal View
I believe this is a time for patience rather than emotional decisions.
A market correction can create opportunities, but it can also bring more downside risk. Understanding market conditions, managing risk, and doing proper research are essential.
🔥 Let's Talk!
Do you think Bitcoin can recover from this market pressure, or could we see another correction?
Are you currently:
🟢 Bullish
🔴 Bearish
🟡 Waiting for confirmation
Share your thoughts below!
$BTC $ETH $BNB
#Bitcoin #CryptoNews #BinanceSquare #BitcoinAnalysis #Ethereum

·
--
📉 Bitcoin (BTC) Market Update: Is Another Drop Coming?
Bitcoin is currently facing selling pressure in the crypto market. According to the Binance BTC/USDT chart, Bitcoin is trading at $62,694.01, down approximately 2.68% over the last 24 hours.
📊 Market Overview
Current Price: $62,694.01
24H High: $64,952.92
24H Low: $62,062.97
MA(7): $62,719.89
MA(25): $63,639.07
MA(99): $64,433.83
🔍 Technical Analysis
BTC is currently trading below the MA(25) and MA(99), indicating short-term market weakness.
Key Levels to Watch:
🟢 Support Levels:
$62,000
$61,500
🔴 Resistance Levels:
$64,000
$66,500
💡 What Could Happen Next?
If Bitcoin holds above the $62,000 support zone, a short-term recovery could be possible.
However, if the price breaks below this level, further downside pressure may follow.
On the other hand, a strong move above $64,000 could improve bullish momentum.
📝 My Market View
Bitcoin is at an important price level. Traders should carefully monitor price action, trading volume, and key support and resistance zones before making any decisions.
The crypto market is highly volatile, so patience and proper risk management are essential.
⚠️ This post is for educational purposes only and is not financial advice. Always do your own research (DYOR).
#Bitcoin #BTC #BTCUSDT #CryptoMarket #BinanceSquare #BitcoinAnalysis #CryptoTrading
📉 Bitcoin (BTC) Market Update: Is Another Drop Coming?
Bitcoin is currently facing selling pressure in the crypto market. According to the Binance BTC/USDT chart, Bitcoin is trading at $62,694.01, down approximately 2.68% over the last 24 hours.
📊 Market Overview
Current Price: $62,694.01
24H High: $64,952.92
24H Low: $62,062.97
MA(7): $62,719.89
MA(25): $63,639.07
MA(99): $64,433.83
🔍 Technical Analysis
BTC is currently trading below the MA(25) and MA(99), indicating short-term market weakness.
Key Levels to Watch:
🟢 Support Levels:
$62,000
$61,500
🔴 Resistance Levels:
$64,000
$66,500
💡 What Could Happen Next?
If Bitcoin holds above the $62,000 support zone, a short-term recovery could be possible.
However, if the price breaks below this level, further downside pressure may follow.
On the other hand, a strong move above $64,000 could improve bullish momentum.
📝 My Market View
Bitcoin is at an important price level. Traders should carefully monitor price action, trading volume, and key support and resistance zones before making any decisions.
The crypto market is highly volatile, so patience and proper risk management are essential.
⚠️ This post is for educational purposes only and is not financial advice. Always do your own research (DYOR).
#Bitcoin #BTC #BTCUSDT #CryptoMarket #BinanceSquare #BitcoinAnalysis #CryptoTrading
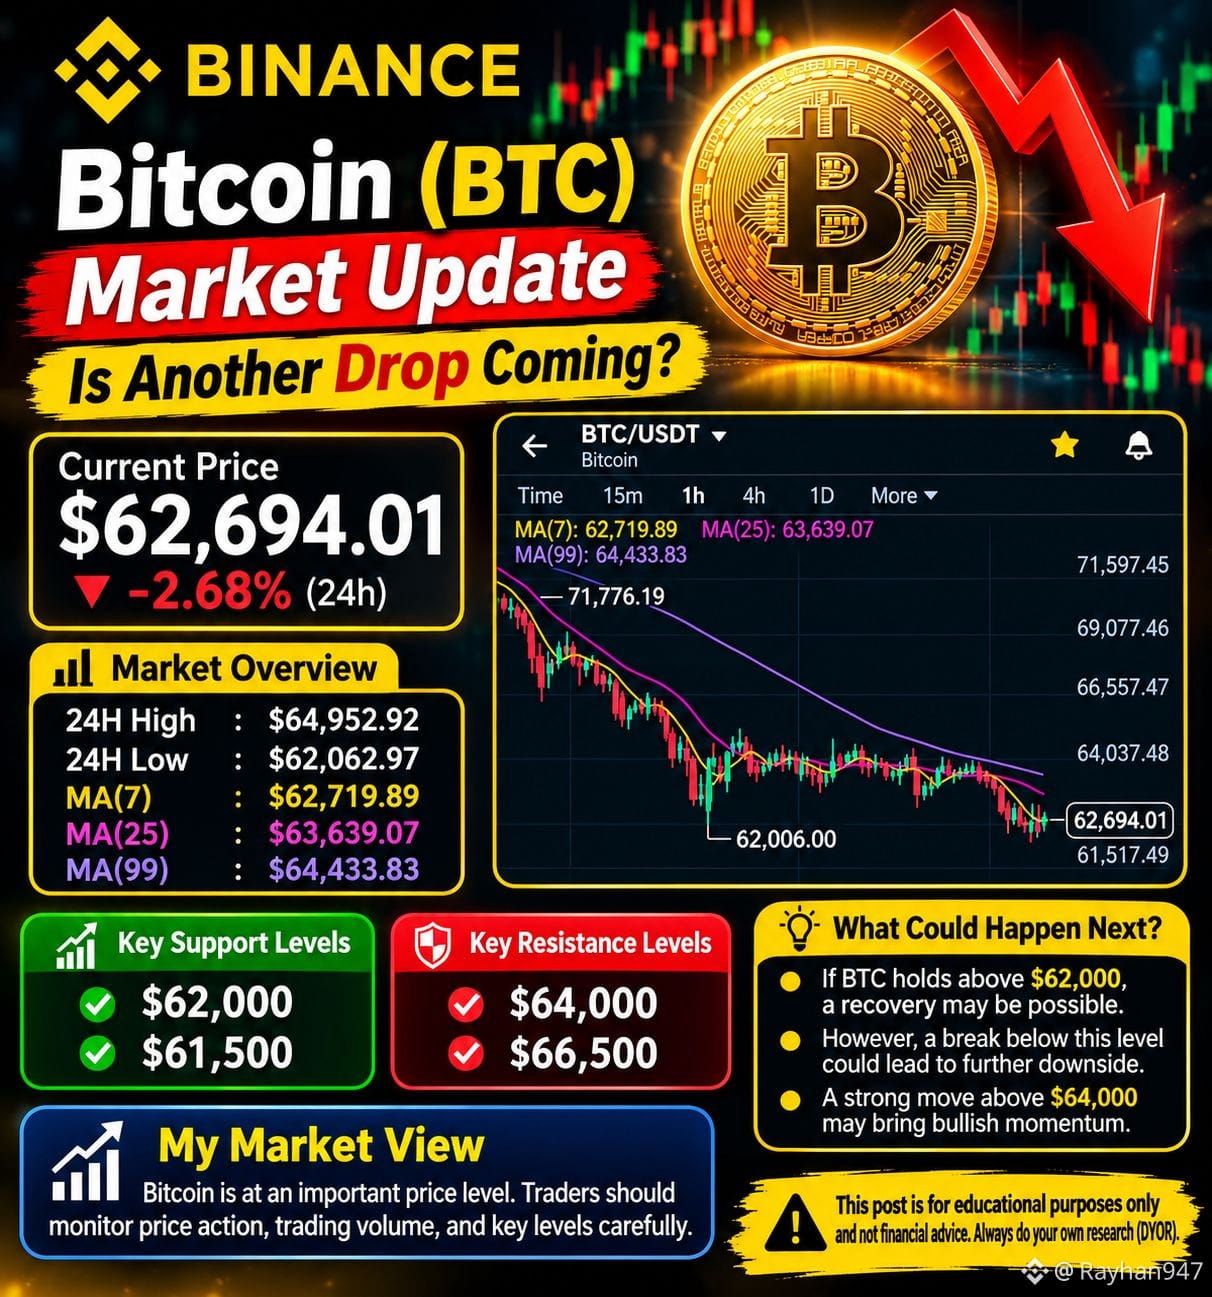
Bitcoin is currently facing selling pressure in the crypto market. According to the Binance BTC/USDT chart, Bitcoin is trading at $62,694.01, down approximately 2.68% over the last 24 hours.
📊 Market Overview
Current Price: $62,694.01
24H High: $64,952.92
24H Low: $62,062.97
MA(7): $62,719.89
MA(25): $63,639.07
MA(99): $64,433.83
🔍 Technical Analysis
BTC is currently trading below the MA(25) and MA(99), indicating short-term market weakness.
Key Levels to Watch:
🟢 Support Levels:
$62,000
$61,500
🔴 Resistance Levels:
$64,000
$66,500
💡 What Could Happen Next?
If Bitcoin holds above the $62,000 support zone, a short-term recovery could be possible.
However, if the price breaks below this level, further downside pressure may follow.
On the other hand, a strong move above $64,000 could improve bullish momentum.
📝 My Market View
Bitcoin is at an important price level. Traders should carefully monitor price action, trading volume, and key support and resistance zones before making any decisions.
The crypto market is highly volatile, so patience and proper risk management are essential.
⚠️ This post is for educational purposes only and is not financial advice. Always do your own research (DYOR).
#Bitcoin #BTC #BTCUSDT #CryptoMarket #BinanceSquare #BitcoinAnalysis #CryptoTrading
63

·
--
Bitcoin broke its 200 week average, and history says the pain may not be over. 📊
Bitcoin fell below its 200 week average near $68,000, and Binance Market Update notes that the last three times this happened, Bitcoin dropped another 10 to 17 percent, implying $54,000 to $59,000, before moving higher three months later. 🔴 My reading is that the average is a line in the sand for long term holders, and losing it does not mean the cycle is over, but it does mean the next leg down is the normal path, not the exception, so I plan for $58,000 before I plan for $66,000. ⚠️
Does Bitcoin find its low near $54,000, or does $60,000 hold first? 🤔
Follow for more trades.
#Crypto #Bitcoin #FuturesTrading #TradingSignals #BitcoinAnalysis
Bitcoin broke its 200 week average, and history says the pain may not be over. 📊
Bitcoin fell below its 200 week average near $68,000, and Binance Market Update notes that the last three times this happened, Bitcoin dropped another 10 to 17 percent, implying $54,000 to $59,000, before moving higher three months later. 🔴 My reading is that the average is a line in the sand for long term holders, and losing it does not mean the cycle is over, but it does mean the next leg down is the normal path, not the exception, so I plan for $58,000 before I plan for $66,000. ⚠️
Does Bitcoin find its low near $54,000, or does $60,000 hold first? 🤔
Follow for more trades.
#Crypto #Bitcoin #FuturesTrading #TradingSignals #BitcoinAnalysis
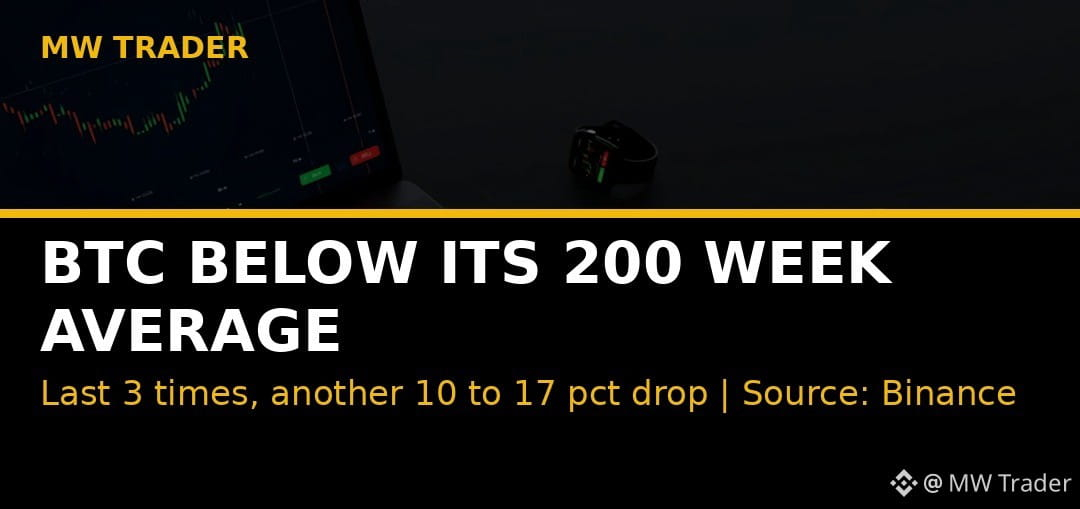
Bitcoin fell below its 200 week average near $68,000, and Binance Market Update notes that the last three times this happened, Bitcoin dropped another 10 to 17 percent, implying $54,000 to $59,000, before moving higher three months later. 🔴 My reading is that the average is a line in the sand for long term holders, and losing it does not mean the cycle is over, but it does mean the next leg down is the normal path, not the exception, so I plan for $58,000 before I plan for $66,000. ⚠️
Does Bitcoin find its low near $54,000, or does $60,000 hold first? 🤔
Follow for more trades.
#Crypto #Bitcoin #FuturesTrading #TradingSignals #BitcoinAnalysis
28

$BTC : Bitcoin Faces Another Important $65K Market Test
Bitcoin is trading around $64,052 in the November 18 market snapshot. The market is showing weakness after another unsuccessful attempt to break above the $65,000 area.
What Should Traders Watch?
Resistance: The $65K area remains an important level to monitor.
Support: Traders should watch whether buyers can defend the recent trading range.
Volume: A breakout needs stronger trading activity for confirmation.
Market Sentiment: Fear remains high across the crypto market.
Bullish Scenario: A strong move above $65K with volume confirmation could improve short-term sentiment.
Bearish Scenario: Another rejection could increase selling pressure.
My Take: Bitcoin needs stronger buying interest before traders can become confident about a recovery.
Do you think BTC can break above $65K, or will sellers remain in control?
#bitcoin #btc #CryptoMarket #BitcoinAnalysis
{spot}(BTCUSDT)
$BTC : Bitcoin Faces Another Important $65K Market Test
Bitcoin is trading around $64,052 in the November 18 market snapshot. The market is showing weakness after another unsuccessful attempt to break above the $65,000 area.
What Should Traders Watch?
Resistance: The $65K area remains an important level to monitor.
Support: Traders should watch whether buyers can defend the recent trading range.
Volume: A breakout needs stronger trading activity for confirmation.
Market Sentiment: Fear remains high across the crypto market.
Bullish Scenario: A strong move above $65K with volume confirmation could improve short-term sentiment.
Bearish Scenario: Another rejection could increase selling pressure.
My Take: Bitcoin needs stronger buying interest before traders can become confident about a recovery.
Do you think BTC can break above $65K, or will sellers remain in control?
#bitcoin #btc #CryptoMarket #BitcoinAnalysis
Bitcoin is trading around $64,052 in the November 18 market snapshot. The market is showing weakness after another unsuccessful attempt to break above the $65,000 area.
What Should Traders Watch?
Resistance: The $65K area remains an important level to monitor.
Support: Traders should watch whether buyers can defend the recent trading range.
Volume: A breakout needs stronger trading activity for confirmation.
Market Sentiment: Fear remains high across the crypto market.
Bullish Scenario: A strong move above $65K with volume confirmation could improve short-term sentiment.
Bearish Scenario: Another rejection could increase selling pressure.
My Take: Bitcoin needs stronger buying interest before traders can become confident about a recovery.
Do you think BTC can break above $65K, or will sellers remain in control?
#bitcoin #btc #CryptoMarket #BitcoinAnalysis
28

Bitcoin (BTC) is currently showing a period of sideways consolidation, hinting at potential re-accumulation after its recent price adjustments. This phase often precedes a more significant directional shift, with traders closely watching key support and resistance zones.
An opportunity could arise from strong bounces off established support levels, potentially offering long entries for a move towards the upper bound of the current trading range as buying interest rebuilds. However, a significant risk remains: if current support fails to hold, we could see further downward pressure, especially if broader market sentiment doesn't improve. Lower volumes during this consolidation also suggest caution.
What factors are you prioritizing to gauge BTC's next major trend?
#BTC #CryptoMarket #BitcoinAnalysis
Bitcoin (BTC) is currently showing a period of sideways consolidation, hinting at potential re-accumulation after its recent price adjustments. This phase often precedes a more significant directional shift, with traders closely watching key support and resistance zones.
An opportunity could arise from strong bounces off established support levels, potentially offering long entries for a move towards the upper bound of the current trading range as buying interest rebuilds. However, a significant risk remains: if current support fails to hold, we could see further downward pressure, especially if broader market sentiment doesn't improve. Lower volumes during this consolidation also suggest caution.
What factors are you prioritizing to gauge BTC's next major trend?
#BTC #CryptoMarket #BitcoinAnalysis
An opportunity could arise from strong bounces off established support levels, potentially offering long entries for a move towards the upper bound of the current trading range as buying interest rebuilds. However, a significant risk remains: if current support fails to hold, we could see further downward pressure, especially if broader market sentiment doesn't improve. Lower volumes during this consolidation also suggest caution.
What factors are you prioritizing to gauge BTC's next major trend?
#BTC #CryptoMarket #BitcoinAnalysis
107
·
--
🚨 BITCOIN AT A CRITICAL ZONE — IS A RECOVERY COMING?
Bitcoin is facing an important market test, and the next move could influence the direction of the entire crypto market.
$BTC has recently dropped toward the $61K–$63K region, putting buyers under pressure. However, lower prices are also attracting attention from investors looking for potential opportunities.
Here are the key levels I'm watching:
📍 Support Zone: $62,000 – $60,000
📍 Resistance 1: $65,400
📍 Resistance 2: $67,000
📍 Major Resistance: $72,000
Two possible scenarios:
🟢 Bullish Scenario: If BTC reclaims $65,400 with strong buying volume, a recovery toward $67K could become possible.
🔴 Bearish Scenario: If Bitcoin loses the $62K support, further downside pressure toward $60K may follow.
My view: I don't think traders should rush into positions just because BTC looks oversold. A sustainable recovery needs stronger demand, not just a temporary bounce.
Let's discuss! 👇
Do you believe Bitcoin will recover before the end of November, or could we see another leg down?
#bitcoin #BTC #CryptoMarket #BitcoinAnalysis #BinanceSquare
🚨 BITCOIN AT A CRITICAL ZONE — IS A RECOVERY COMING?
Bitcoin is facing an important market test, and the next move could influence the direction of the entire crypto market.
$BTC has recently dropped toward the $61K–$63K region, putting buyers under pressure. However, lower prices are also attracting attention from investors looking for potential opportunities.
Here are the key levels I'm watching:
📍 Support Zone: $62,000 – $60,000
📍 Resistance 1: $65,400
📍 Resistance 2: $67,000
📍 Major Resistance: $72,000
Two possible scenarios:
🟢 Bullish Scenario: If BTC reclaims $65,400 with strong buying volume, a recovery toward $67K could become possible.
🔴 Bearish Scenario: If Bitcoin loses the $62K support, further downside pressure toward $60K may follow.
My view: I don't think traders should rush into positions just because BTC looks oversold. A sustainable recovery needs stronger demand, not just a temporary bounce.
Let's discuss! 👇
Do you believe Bitcoin will recover before the end of November, or could we see another leg down?
#bitcoin #BTC #CryptoMarket #BitcoinAnalysis #BinanceSquare
Bitcoin is facing an important market test, and the next move could influence the direction of the entire crypto market.
$BTC has recently dropped toward the $61K–$63K region, putting buyers under pressure. However, lower prices are also attracting attention from investors looking for potential opportunities.
Here are the key levels I'm watching:
📍 Support Zone: $62,000 – $60,000
📍 Resistance 1: $65,400
📍 Resistance 2: $67,000
📍 Major Resistance: $72,000
Two possible scenarios:
🟢 Bullish Scenario: If BTC reclaims $65,400 with strong buying volume, a recovery toward $67K could become possible.
🔴 Bearish Scenario: If Bitcoin loses the $62K support, further downside pressure toward $60K may follow.
My view: I don't think traders should rush into positions just because BTC looks oversold. A sustainable recovery needs stronger demand, not just a temporary bounce.
Let's discuss! 👇
Do you believe Bitcoin will recover before the end of November, or could we see another leg down?
#bitcoin #BTC #CryptoMarket #BitcoinAnalysis #BinanceSquare
1
184

🚀 BTC/USDT PRICE PREDICTION – BULLS OR BEARS? ₿
📊 Bitcoin Market Analysis | November 18, 2026
Bitcoin is currently facing selling pressure around the $64,000 zone. The short-term market structure remains bearish, but an oversold RSI could create opportunities for a temporary recovery.
🔴 Key Resistance Levels
$64,900
$65,500
$66,000
🟢 Key Support Levels
$63,900
$63,300
$62,000
📈 Bullish Scenario:
If BTC breaks and holds above $65,500, we could see a recovery toward $66,000–$68,000.
📉 Bearish Scenario:
If BTC loses $63,300, further downside toward $62,000 or even $60,000 could become possible.
🎯 My Prediction:
Short-term outlook: BEARISH / SIDEWAYS.
Watch the $63,300 support and $65,500 resistance closely. A confirmed breakout will determine the next major move.
💬 What's your prediction?
BTC to $68K or $60K first?
#BTC #Bitcoin #BTCUSDT #CryptoPrediction #BinanceSquare #CryptoTrading #BitcoinAnalysis
🚀 BTC/USDT PRICE PREDICTION – BULLS OR BEARS? ₿
📊 Bitcoin Market Analysis | November 18, 2026
Bitcoin is currently facing selling pressure around the $64,000 zone. The short-term market structure remains bearish, but an oversold RSI could create opportunities for a temporary recovery.
🔴 Key Resistance Levels
$64,900
$65,500
$66,000
🟢 Key Support Levels
$63,900
$63,300
$62,000
📈 Bullish Scenario:
If BTC breaks and holds above $65,500, we could see a recovery toward $66,000–$68,000.
📉 Bearish Scenario:
If BTC loses $63,300, further downside toward $62,000 or even $60,000 could become possible.
🎯 My Prediction:
Short-term outlook: BEARISH / SIDEWAYS.
Watch the $63,300 support and $65,500 resistance closely. A confirmed breakout will determine the next major move.
💬 What's your prediction?
BTC to $68K or $60K first?
#BTC #Bitcoin #BTCUSDT #CryptoPrediction #BinanceSquare #CryptoTrading #BitcoinAnalysis
📊 Bitcoin Market Analysis | November 18, 2026
Bitcoin is currently facing selling pressure around the $64,000 zone. The short-term market structure remains bearish, but an oversold RSI could create opportunities for a temporary recovery.
🔴 Key Resistance Levels
$64,900
$65,500
$66,000
🟢 Key Support Levels
$63,900
$63,300
$62,000
📈 Bullish Scenario:
If BTC breaks and holds above $65,500, we could see a recovery toward $66,000–$68,000.
📉 Bearish Scenario:
If BTC loses $63,300, further downside toward $62,000 or even $60,000 could become possible.
🎯 My Prediction:
Short-term outlook: BEARISH / SIDEWAYS.
Watch the $63,300 support and $65,500 resistance closely. A confirmed breakout will determine the next major move.
💬 What's your prediction?
BTC to $68K or $60K first?
#BTC #Bitcoin #BTCUSDT #CryptoPrediction #BinanceSquare #CryptoTrading #BitcoinAnalysis

1
103
Log in to explore more content
Join global crypto users on Binance Square
⚡️ Get latest and useful information about crypto.
💬 Trusted by the world’s largest crypto exchange.
👍 Discover real insights from verified creators.
Email / Phone number
Trending Topics
1
#IsAnthropic’s$1.5TMarketCapJustified?
58,164 views
292 Discussing
2
#BTCBelow$62KAmidHikeFearsAndShiftToAnthropic
15,591 views
97 Discussing
3
#NvidiaBoardReportedlySplitOverHuang’sReturn
243,558 views
1,933 Discussing
4
#CanGTA6'sLaunchLiftTTWOShares?
195,645 views
1,374 Discussing
5
#HongKongProposesSFCLicensingForFourVirtualAssetServices
269 views
7 Discussing
6
#BlackRockBitcoinETFRecordsLargestDailyOutflow
12,242 views
137 Discussing
7
#LedgerProbesTamperedWalletsInBerlinAndDubai
22,444 views
294 Discussing
8
#13FInstitutionsBitcoinSpotETPHoldingsHitRecord
38,499 views
351 Discussing
9
#BTCRemainsUnderPressureAfterHawkishFOMCMinutes
412,538 views
2,620 Discussing
10
#StrategySTRCPreferredSlips3.65%Below$100Par
14,094 views
104 Discussing