
#63
63
11,435 views
43 Discussing
Hot
Latest

·
--
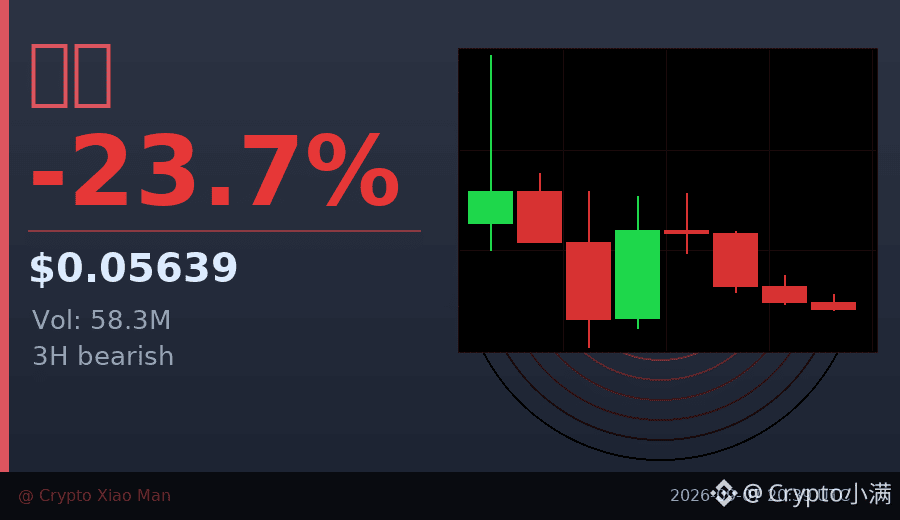
63% of people are shorting, and the lobster is already down by nearly 24%.
Such one-sided positioning often hides two possibilities: either everyone keeps getting swept up in the stampede, or a sudden short squeeze hits. The past 3 hourly K-lines have all been bearish, which shows the shorts are currently in control.
Trading volume of $58 million isn’t small, but the price has been dumped from 0.075 to 0.056—there’s strong sell pressure. The funding rate is only 0.005%, suggesting neither side is being overly aggressive.
I’m not going to rush to bottom-fish now. I’ll wait until the positioning ratio normalizes a bit. Under this kind of extreme sentiment, the volatility often isn’t over yet.
$Lobster #轧空预警 #63% Shorts
Click the small card below to quickly check the market trend👇
63% of people are shorting, and the lobster is already down by nearly 24%.
Such one-sided positioning often hides two possibilities: either everyone keeps getting swept up in the stampede, or a sudden short squeeze hits. The past 3 hourly K-lines have all been bearish, which shows the shorts are currently in control.
Trading volume of $58 million isn’t small, but the price has been dumped from 0.075 to 0.056—there’s strong sell pressure. The funding rate is only 0.005%, suggesting neither side is being overly aggressive.
I’m not going to rush to bottom-fish now. I’ll wait until the positioning ratio normalizes a bit. Under this kind of extreme sentiment, the volatility often isn’t over yet.
$Lobster #轧空预警 #63% Shorts
Click the small card below to quickly check the market trend👇
Such one-sided positioning often hides two possibilities: either everyone keeps getting swept up in the stampede, or a sudden short squeeze hits. The past 3 hourly K-lines have all been bearish, which shows the shorts are currently in control.
Trading volume of $58 million isn’t small, but the price has been dumped from 0.075 to 0.056—there’s strong sell pressure. The funding rate is only 0.005%, suggesting neither side is being overly aggressive.
I’m not going to rush to bottom-fish now. I’ll wait until the positioning ratio normalizes a bit. Under this kind of extreme sentiment, the volatility often isn’t over yet.
$Lobster #轧空预警 #63% Shorts
Click the small card below to quickly check the market trend👇
1
383
·
--
63% gain, but more than half of people are short?
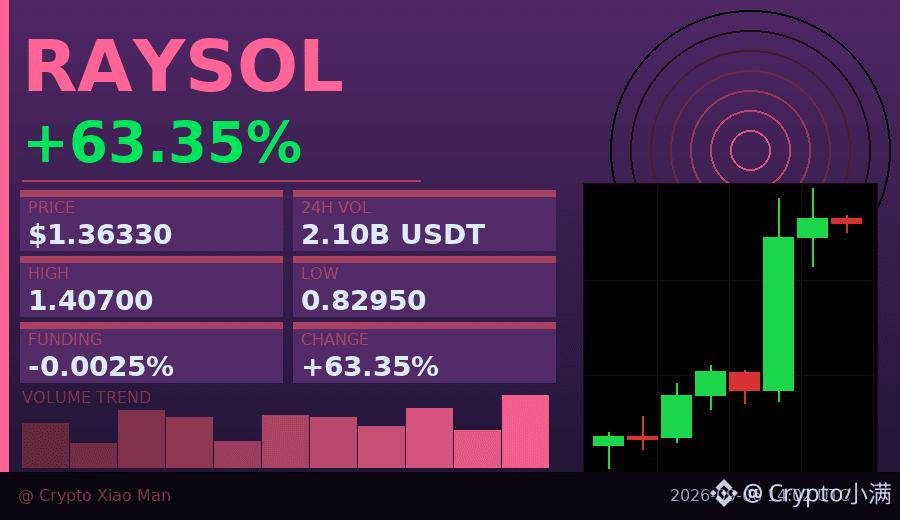
RAYSOL moved from 0.83 to 1.40 today, and has now pulled back to 1.36. Trading volume reached $210 million, and the trend has been very strong over the past 8 hours.
What’s interesting is that the funding rate is negative (-0.00247), and the long/short ratio is 48% to 52% — more people are shorting.
The price has surged, but short positions have actually increased. This usually suggests two possibilities: either shorts are buying the dip against the trend, or they’re betting on a pullback. If the price continues to break above 1.40, these shorts may get squeezed.
Key level: 1.40 is today’s high, and if it holds, short-term momentum is still intact. A drop below 1.30 could deepen the pullback.
$RAYSOL #逼空行情 #63%
Click the small card below to quickly check the market 👇
63% gain, but more than half of people are short?
RAYSOL moved from 0.83 to 1.40 today, and has now pulled back to 1.36. Trading volume reached $210 million, and the trend has been very strong over the past 8 hours.
What’s interesting is that the funding rate is negative (-0.00247), and the long/short ratio is 48% to 52% — more people are shorting.
The price has surged, but short positions have actually increased. This usually suggests two possibilities: either shorts are buying the dip against the trend, or they’re betting on a pullback. If the price continues to break above 1.40, these shorts may get squeezed.
Key level: 1.40 is today’s high, and if it holds, short-term momentum is still intact. A drop below 1.30 could deepen the pullback.
$RAYSOL #逼空行情 #63%
Click the small card below to quickly check the market 👇
RAYSOL moved from 0.83 to 1.40 today, and has now pulled back to 1.36. Trading volume reached $210 million, and the trend has been very strong over the past 8 hours.
What’s interesting is that the funding rate is negative (-0.00247), and the long/short ratio is 48% to 52% — more people are shorting.
The price has surged, but short positions have actually increased. This usually suggests two possibilities: either shorts are buying the dip against the trend, or they’re betting on a pullback. If the price continues to break above 1.40, these shorts may get squeezed.
Key level: 1.40 is today’s high, and if it holds, short-term momentum is still intact. A drop below 1.30 could deepen the pullback.
$RAYSOL #逼空行情 #63%
Click the small card below to quickly check the market 👇
49
·
--
Behind the 27% increase, longs have already accounted for 63%.
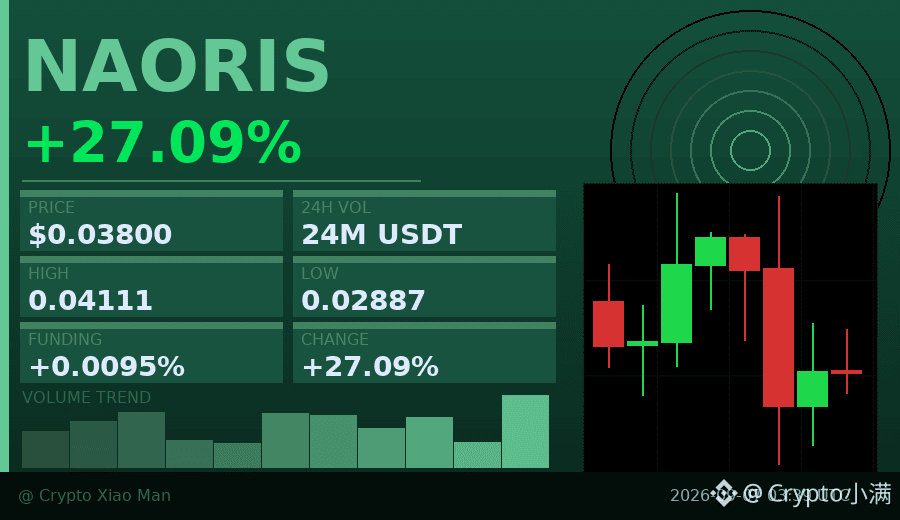
NAORIS has been pumped from 0.02887 to 0.038 now, with three consecutive hourly bullish candles and trading volume of 24.1 million USDT, which is not small.
But note that the funding rate is only 0.0095%, which is not high — this shows the rise has not yet reached the point of crazy leverage.
The risk lies in crowded longs: 63% of people are long, and once it pulls back, the sell-off could be steeper than usual.
I’d prefer to wait for an hourly retest of the 0.036-0.037 area before looking at it again; the risk-reward ratio for chasing the rally is average at best right now.
$NAORIS #资金费率 #63% longs
Click the small card below to quickly view the market 👇
Behind the 27% increase, longs have already accounted for 63%.
NAORIS has been pumped from 0.02887 to 0.038 now, with three consecutive hourly bullish candles and trading volume of 24.1 million USDT, which is not small.
But note that the funding rate is only 0.0095%, which is not high — this shows the rise has not yet reached the point of crazy leverage.
The risk lies in crowded longs: 63% of people are long, and once it pulls back, the sell-off could be steeper than usual.
I’d prefer to wait for an hourly retest of the 0.036-0.037 area before looking at it again; the risk-reward ratio for chasing the rally is average at best right now.
$NAORIS #资金费率 #63% longs
Click the small card below to quickly view the market 👇
NAORIS has been pumped from 0.02887 to 0.038 now, with three consecutive hourly bullish candles and trading volume of 24.1 million USDT, which is not small.
But note that the funding rate is only 0.0095%, which is not high — this shows the rise has not yet reached the point of crazy leverage.
The risk lies in crowded longs: 63% of people are long, and once it pulls back, the sell-off could be steeper than usual.
I’d prefer to wait for an hourly retest of the 0.036-0.037 area before looking at it again; the risk-reward ratio for chasing the rally is average at best right now.
$NAORIS #资金费率 #63% longs
Click the small card below to quickly view the market 👇
28
·
--
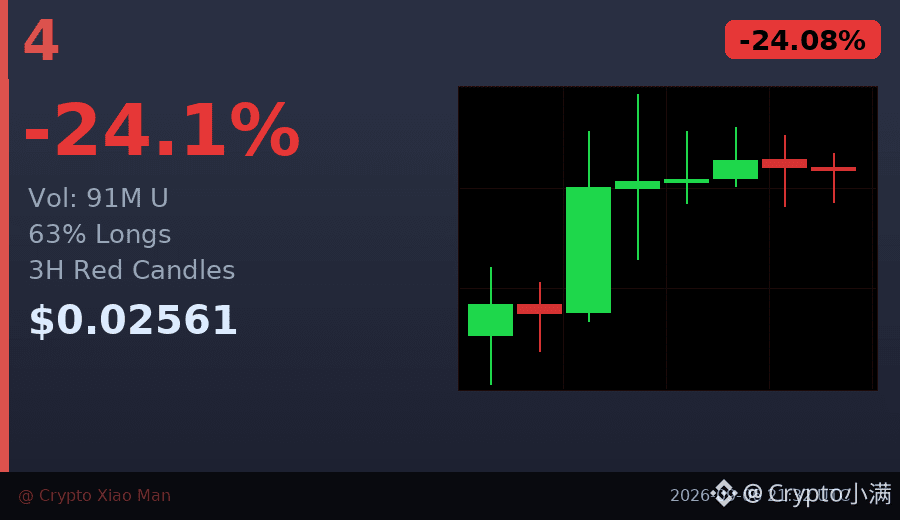
63% of people are going long, yet the price has dropped 24% — a classic crowded trade is being liquidated.
$4 today’s trading volume surged to 91 million U, but the hourly chart printed three consecutive bearish candles, dumping from the high of 0.0344 all the way to 0.0256. When longs are too crowded, even a little selling pressure can trigger a chain of stop-losses.
Right now the price is near the intraday low around 0.0224. If this level can’t hold, the next wave of stop-loss orders could come even faster. On the flip side, if shorts start taking profits, the rebound could be sharp too — just don’t rush to bottom-fish.
In this kind of market, I usually wait for two signals: either see an hourly candle close green and stabilize, or wait until volume clearly dries up before considering a move.
$4 #拥挤交易 #63% longs
Click the card below to quickly check the market👇
63% of people are going long, yet the price has dropped 24% — a classic crowded trade is being liquidated.
$4 today’s trading volume surged to 91 million U, but the hourly chart printed three consecutive bearish candles, dumping from the high of 0.0344 all the way to 0.0256. When longs are too crowded, even a little selling pressure can trigger a chain of stop-losses.
Right now the price is near the intraday low around 0.0224. If this level can’t hold, the next wave of stop-loss orders could come even faster. On the flip side, if shorts start taking profits, the rebound could be sharp too — just don’t rush to bottom-fish.
In this kind of market, I usually wait for two signals: either see an hourly candle close green and stabilize, or wait until volume clearly dries up before considering a move.
$4 #拥挤交易 #63% longs
Click the card below to quickly check the market👇
$4 today’s trading volume surged to 91 million U, but the hourly chart printed three consecutive bearish candles, dumping from the high of 0.0344 all the way to 0.0256. When longs are too crowded, even a little selling pressure can trigger a chain of stop-losses.
Right now the price is near the intraday low around 0.0224. If this level can’t hold, the next wave of stop-loss orders could come even faster. On the flip side, if shorts start taking profits, the rebound could be sharp too — just don’t rush to bottom-fish.
In this kind of market, I usually wait for two signals: either see an hourly candle close green and stabilize, or wait until volume clearly dries up before considering a move.
$4 #拥挤交易 #63% longs
Click the card below to quickly check the market👇
39
·
--
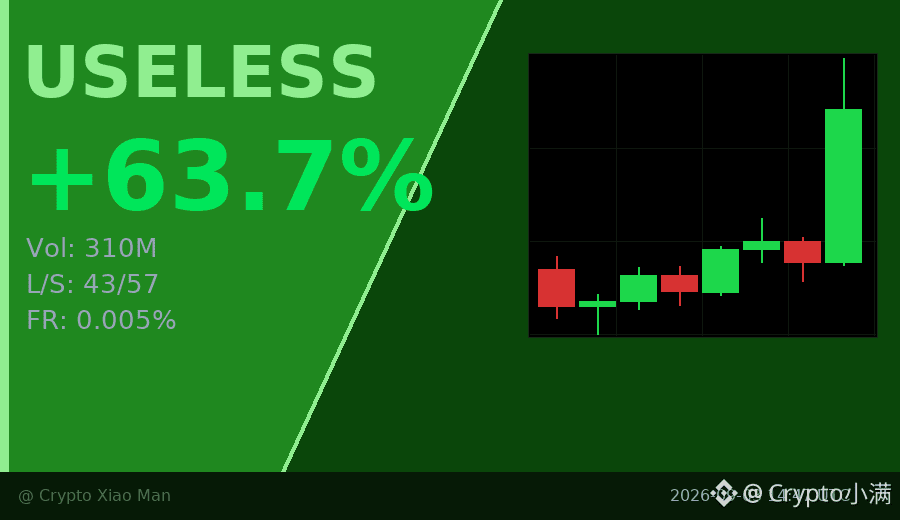
Behind the 63% surge, the funding rate is only 0.005%—what does this indicate?
USELESS Today, USELESS was pushed up from 0.11 all the way to 0.19. Trading volume spiked to 310 million USDT, yet longs account for only 43% while shorts are 57%. Most people are still guessing where the top is, but the price answers the question with a single high-volume bullish candle.
Over the past 8 hours, the trend has kept strengthening. The final candlestick shows a clear increase in volume, indicating that capital is continuing to absorb at higher levels. This combination of “new price highs + short-side dominance + low funding rate” often means the move is not over yet.
$USELESS #低费率逼空 #63%
Click the small card below to quickly view the market trend👇
Behind the 63% surge, the funding rate is only 0.005%—what does this indicate?
USELESS Today, USELESS was pushed up from 0.11 all the way to 0.19. Trading volume spiked to 310 million USDT, yet longs account for only 43% while shorts are 57%. Most people are still guessing where the top is, but the price answers the question with a single high-volume bullish candle.
Over the past 8 hours, the trend has kept strengthening. The final candlestick shows a clear increase in volume, indicating that capital is continuing to absorb at higher levels. This combination of “new price highs + short-side dominance + low funding rate” often means the move is not over yet.
$USELESS #低费率逼空 #63%
Click the small card below to quickly view the market trend👇
USELESS Today, USELESS was pushed up from 0.11 all the way to 0.19. Trading volume spiked to 310 million USDT, yet longs account for only 43% while shorts are 57%. Most people are still guessing where the top is, but the price answers the question with a single high-volume bullish candle.
Over the past 8 hours, the trend has kept strengthening. The final candlestick shows a clear increase in volume, indicating that capital is continuing to absorb at higher levels. This combination of “new price highs + short-side dominance + low funding rate” often means the move is not over yet.
$USELESS #低费率逼空 #63%
Click the small card below to quickly view the market trend👇
30
·
--
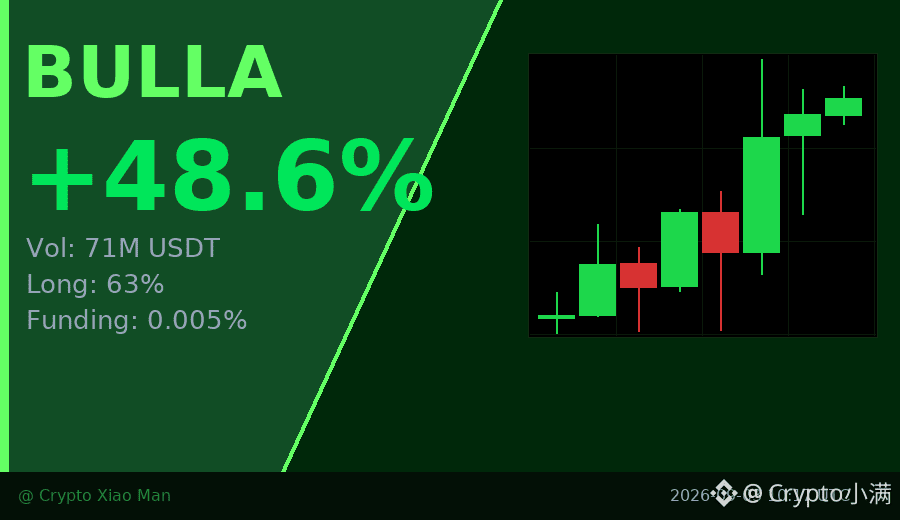
Behind the 48% surge, there’s a detail worth paying attention to: BULLA’s trading volume today hit 71 million U, but the funding rate is only 0.005%, far below the level that such a move usually corresponds to.
The long-to-short ratio is 63%. It looks crowded on the long side, but the funding rate hasn’t caught up, suggesting leverage isn’t going crazy yet. The hourly chart has already logged three consecutive bullish candles. It’s risen from 0.018 to the current 0.0285, with no obvious profit-taking pullbacks in between.
I’ve posted about BULLA before, but that time it was just for the excitement. This time I’m looking for the underlying signals—the volume comes first, the funding rate follows late. This combination is either a real breakout… or a calm before the storm.
I lean toward the former, because 71 million in volume isn’t something retail traders can easily pile up.
$BULLA #资金费率滞后 #63% Longs
Click the small card below to quickly check the market 👇
Behind the 48% surge, there’s a detail worth paying attention to: BULLA’s trading volume today hit 71 million U, but the funding rate is only 0.005%, far below the level that such a move usually corresponds to.
The long-to-short ratio is 63%. It looks crowded on the long side, but the funding rate hasn’t caught up, suggesting leverage isn’t going crazy yet. The hourly chart has already logged three consecutive bullish candles. It’s risen from 0.018 to the current 0.0285, with no obvious profit-taking pullbacks in between.
I’ve posted about BULLA before, but that time it was just for the excitement. This time I’m looking for the underlying signals—the volume comes first, the funding rate follows late. This combination is either a real breakout… or a calm before the storm.
I lean toward the former, because 71 million in volume isn’t something retail traders can easily pile up.
$BULLA #资金费率滞后 #63% Longs
Click the small card below to quickly check the market 👇
The long-to-short ratio is 63%. It looks crowded on the long side, but the funding rate hasn’t caught up, suggesting leverage isn’t going crazy yet. The hourly chart has already logged three consecutive bullish candles. It’s risen from 0.018 to the current 0.0285, with no obvious profit-taking pullbacks in between.
I’ve posted about BULLA before, but that time it was just for the excitement. This time I’m looking for the underlying signals—the volume comes first, the funding rate follows late. This combination is either a real breakout… or a calm before the storm.
I lean toward the former, because 71 million in volume isn’t something retail traders can easily pile up.
$BULLA #资金费率滞后 #63% Longs
Click the small card below to quickly check the market 👇
43
·
--
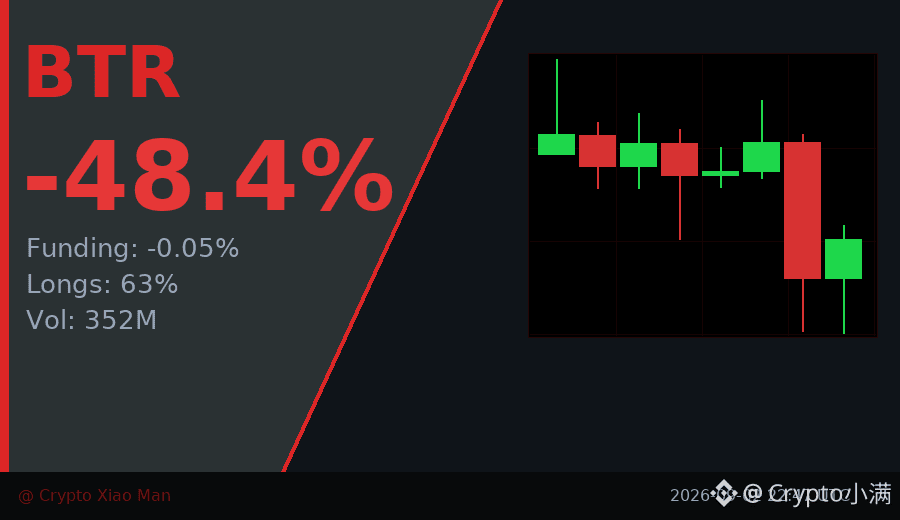
48% drop, but funding rate is skyrocketing to -0.05%—what signal is this?
Today, BTR fell directly from 0.099 to 0.046, with trading volume of $350 million. The shorts fully dominate. But interestingly, long positions still account for 63%—with so many people still holding on.
A negative funding rate means shorts are paying longs, yet the price keeps falling. What does that imply? Either longs are stubbornly holding out for a rebound, or they just haven’t had a liquidation cascade yet.
In the last 8 hours, the trend has been weakening all the way. Each small bounce gets smashed even lower. In this situation, crowded long positions are actually a risk—if the price keeps dropping, it may trigger a chain of liquidations.
I’m not in a rush to buy the dip. I’ll wait until the funding rate returns to normal, or until I see a clear stabilization signal.
$BTR #资金费率 #63% long
Click the small card below to quickly check the行情👇
48% drop, but funding rate is skyrocketing to -0.05%—what signal is this?
Today, BTR fell directly from 0.099 to 0.046, with trading volume of $350 million. The shorts fully dominate. But interestingly, long positions still account for 63%—with so many people still holding on.
A negative funding rate means shorts are paying longs, yet the price keeps falling. What does that imply? Either longs are stubbornly holding out for a rebound, or they just haven’t had a liquidation cascade yet.
In the last 8 hours, the trend has been weakening all the way. Each small bounce gets smashed even lower. In this situation, crowded long positions are actually a risk—if the price keeps dropping, it may trigger a chain of liquidations.
I’m not in a rush to buy the dip. I’ll wait until the funding rate returns to normal, or until I see a clear stabilization signal.
$BTR #资金费率 #63% long
Click the small card below to quickly check the行情👇
Today, BTR fell directly from 0.099 to 0.046, with trading volume of $350 million. The shorts fully dominate. But interestingly, long positions still account for 63%—with so many people still holding on.
A negative funding rate means shorts are paying longs, yet the price keeps falling. What does that imply? Either longs are stubbornly holding out for a rebound, or they just haven’t had a liquidation cascade yet.
In the last 8 hours, the trend has been weakening all the way. Each small bounce gets smashed even lower. In this situation, crowded long positions are actually a risk—if the price keeps dropping, it may trigger a chain of liquidations.
I’m not in a rush to buy the dip. I’ll wait until the funding rate returns to normal, or until I see a clear stabilization signal.
$BTR #资金费率 #63% long
Click the small card below to quickly check the行情👇
59
·
--
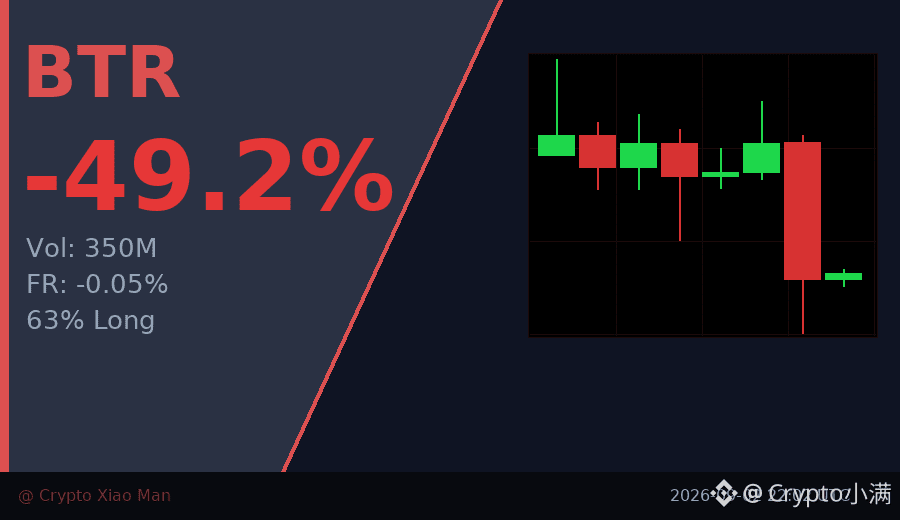
-49% In a single day, the funding rate is -0.05%, and 63% of people are still going long.
The BTR 8-hour chart is very typical: it drops from the high around 0.099, each rebound is weaker than the last, and the final long bearish candle directly smashes through 0.045.
Trading volume is $350 million—not small—but the price didn’t hold up. This suggests the sell pressure is real, not just a shakeout.
With the funding rate this deeply negative, longs are paying the shorts. But long-term longs haven’t truly admitted defeat yet, and positioning is still crowded.
In this kind of setup, wait for two signals: either the funding rate returns to neutral plus the price holds above 0.05, or there’s another selloff that flushes out the 63% of long positions.
Buying in now is essentially betting that others will run faster than you.
$BTR #资金费率 #63% Longs
Click the small card below to quickly view the chart👇
-49% In a single day, the funding rate is -0.05%, and 63% of people are still going long.
The BTR 8-hour chart is very typical: it drops from the high around 0.099, each rebound is weaker than the last, and the final long bearish candle directly smashes through 0.045.
Trading volume is $350 million—not small—but the price didn’t hold up. This suggests the sell pressure is real, not just a shakeout.
With the funding rate this deeply negative, longs are paying the shorts. But long-term longs haven’t truly admitted defeat yet, and positioning is still crowded.
In this kind of setup, wait for two signals: either the funding rate returns to neutral plus the price holds above 0.05, or there’s another selloff that flushes out the 63% of long positions.
Buying in now is essentially betting that others will run faster than you.
$BTR #资金费率 #63% Longs
Click the small card below to quickly view the chart👇
The BTR 8-hour chart is very typical: it drops from the high around 0.099, each rebound is weaker than the last, and the final long bearish candle directly smashes through 0.045.
Trading volume is $350 million—not small—but the price didn’t hold up. This suggests the sell pressure is real, not just a shakeout.
With the funding rate this deeply negative, longs are paying the shorts. But long-term longs haven’t truly admitted defeat yet, and positioning is still crowded.
In this kind of setup, wait for two signals: either the funding rate returns to neutral plus the price holds above 0.05, or there’s another selloff that flushes out the 63% of long positions.
Buying in now is essentially betting that others will run faster than you.
$BTR #资金费率 #63% Longs
Click the small card below to quickly view the chart👇
47
·
--
The long/short ratio can explain a lot.
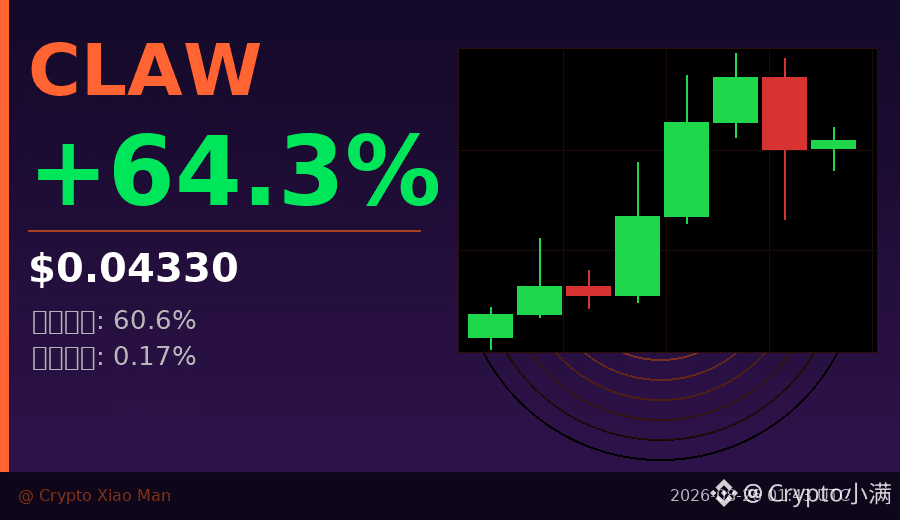
Now the short positions in the lobster (CLAW) are 60.6%, while longs are only 39.4%—most people are actually shorting.
But for some reason, within 8 hours the price surged from 0.032 to 0.048, an increase of more than 63%.
That’s quite interesting: the more shorts there are, the greater the pressure to liquidate, which in turn pushes the price even higher. There’s a force in the market called “short covering.” The more people bet on a drop, the more traders will be forced to buy back to stop the loss if the market moves in the opposite direction.
From the candlestick chart, the recent bars show increasing volume, with each one larger than the last—especially the third-to-last candle, where the trading volume is close to 500 million. The price jumped directly from 0.034 to 0.046. This one indicates that money is truly flowing in.
The funding rate at 0.17% is relatively high, suggesting that there are still a large number of leveraged longs in the market.
Next, you should watch whether volume can sustain. If trading volume starts to shrink but the price still holds, that would be overextended; if, after a contraction, volume ramps up again and pushes higher, that’s a healthier pattern.
With 60% shorting while the market goes the other way—this is the most common “most people lose money” scenario in futures markets.
$CLAW #空头回补 #63% skyrockets
Click the small card below to quickly check the行情👇
The long/short ratio can explain a lot.
Now the short positions in the lobster (CLAW) are 60.6%, while longs are only 39.4%—most people are actually shorting.
But for some reason, within 8 hours the price surged from 0.032 to 0.048, an increase of more than 63%.
That’s quite interesting: the more shorts there are, the greater the pressure to liquidate, which in turn pushes the price even higher. There’s a force in the market called “short covering.” The more people bet on a drop, the more traders will be forced to buy back to stop the loss if the market moves in the opposite direction.
From the candlestick chart, the recent bars show increasing volume, with each one larger than the last—especially the third-to-last candle, where the trading volume is close to 500 million. The price jumped directly from 0.034 to 0.046. This one indicates that money is truly flowing in.
The funding rate at 0.17% is relatively high, suggesting that there are still a large number of leveraged longs in the market.
Next, you should watch whether volume can sustain. If trading volume starts to shrink but the price still holds, that would be overextended; if, after a contraction, volume ramps up again and pushes higher, that’s a healthier pattern.
With 60% shorting while the market goes the other way—this is the most common “most people lose money” scenario in futures markets.
$CLAW #空头回补 #63% skyrockets
Click the small card below to quickly check the行情👇
Now the short positions in the lobster (CLAW) are 60.6%, while longs are only 39.4%—most people are actually shorting.
But for some reason, within 8 hours the price surged from 0.032 to 0.048, an increase of more than 63%.
That’s quite interesting: the more shorts there are, the greater the pressure to liquidate, which in turn pushes the price even higher. There’s a force in the market called “short covering.” The more people bet on a drop, the more traders will be forced to buy back to stop the loss if the market moves in the opposite direction.
From the candlestick chart, the recent bars show increasing volume, with each one larger than the last—especially the third-to-last candle, where the trading volume is close to 500 million. The price jumped directly from 0.034 to 0.046. This one indicates that money is truly flowing in.
The funding rate at 0.17% is relatively high, suggesting that there are still a large number of leveraged longs in the market.
Next, you should watch whether volume can sustain. If trading volume starts to shrink but the price still holds, that would be overextended; if, after a contraction, volume ramps up again and pushes higher, that’s a healthier pattern.
With 60% shorting while the market goes the other way—this is the most common “most people lose money” scenario in futures markets.
$CLAW #空头回补 #63% skyrockets
Click the small card below to quickly check the行情👇
49


·
--
I’ve been scanning CoinGecko’s trending list and three names jump out. Solana (SOL) surged +5.2% today, reclaiming momentum after a short dip. Hyperliquid (HYPE) rallied +8.7%, showing the DeFi‑centric community is still hungry. Bitcoin (BTC) remains the king, edging up +0.9% as risk‑off sentiment eases. 🚀
I’m also keeping an eye on the mid‑cap crowd. Bitway (BTW) climbed +3.4% despite its #46 rank, hinting at a possible breakout. Pump.fun (PUMP) spiked +6.1% from a modest #63 spot, driven by viral memes. Ondo (ONDO) nudged +2.0% as its #49 position gains traction. 🌟
I’m confident these moves signal fresh opportunities, and I’ll be tracking them closely for the next swing. Stay tuned for more insights! 🎯
$HEMI, $ACM, $BTW
I’ve been scanning CoinGecko’s trending list and three names jump out. Solana (SOL) surged +5.2% today, reclaiming momentum after a short dip. Hyperliquid (HYPE) rallied +8.7%, showing the DeFi‑centric community is still hungry. Bitcoin (BTC) remains the king, edging up +0.9% as risk‑off sentiment eases. 🚀
I’m also keeping an eye on the mid‑cap crowd. Bitway (BTW) climbed +3.4% despite its #46 rank, hinting at a possible breakout. Pump.fun (PUMP) spiked +6.1% from a modest #63 spot, driven by viral memes. Ondo (ONDO) nudged +2.0% as its #49 position gains traction. 🌟
I’m confident these moves signal fresh opportunities, and I’ll be tracking them closely for the next swing. Stay tuned for more insights! 🎯
$HEMI , $ACM , $BTW
I’m also keeping an eye on the mid‑cap crowd. Bitway (BTW) climbed +3.4% despite its #46 rank, hinting at a possible breakout. Pump.fun (PUMP) spiked +6.1% from a modest #63 spot, driven by viral memes. Ondo (ONDO) nudged +2.0% as its #49 position gains traction. 🌟
I’m confident these moves signal fresh opportunities, and I’ll be tracking them closely for the next swing. Stay tuned for more insights! 🎯
$HEMI , $ACM , $BTW
99

·
--
$PUMP On the current chart, basically it’s a turnover zone after a 30-day +61% run. The price was pushed from 0.001695 all the way up to 0.0029, and it’s now pulling back to 0.002748. In the past 24 hours it’s down 3.32%, and volume has shrunk from yesterday’s 93M to today’s 57M—no panic, but it’s not a real offensive either.
With a market cap of 1.08B ranked at #63, it suggests the funds are treating it as a mid-sized asset rather than the kind of meme-like impulse it used to be. What’s truly worth noting is that over the last 7 days it’s still up +13.88%, meaning this pullback is only flattening the steepness of the surge, without breaking the underlying trend. However, it’s still 68.84% away from its ATH—this number implies extremely heavy overhead trapped supply, and any time the price spikes higher, it will run into selling pressure from positions seeking to break even.
What I care about more is the interplay between volume and price: during the up-move from August 10 to 13, volume was consistently above 100M. Now the price is elevated and volume is contracting. If over the next few days it can hold the 0.0025–0.0026 area and volume can pick back up, then this move is likely just a continuation (a relay). If it breaks down, then only around 0.0023 do you get any meaningful support and follow-through. Since the ATH is still far away, there’s no need to rush looking at that. For now, only one thing needs confirmation: is the shrinking volume a sign of building up energy, or does it mean the buy side is genuinely not strong enough? We’ll have to wait for next week’s volume to provide the answer.
$PUMP On the current chart, basically it’s a turnover zone after a 30-day +61% run. The price was pushed from 0.001695 all the way up to 0.0029, and it’s now pulling back to 0.002748. In the past 24 hours it’s down 3.32%, and volume has shrunk from yesterday’s 93M to today’s 57M—no panic, but it’s not a real offensive either.
With a market cap of 1.08B ranked at #63, it suggests the funds are treating it as a mid-sized asset rather than the kind of meme-like impulse it used to be. What’s truly worth noting is that over the last 7 days it’s still up +13.88%, meaning this pullback is only flattening the steepness of the surge, without breaking the underlying trend. However, it’s still 68.84% away from its ATH—this number implies extremely heavy overhead trapped supply, and any time the price spikes higher, it will run into selling pressure from positions seeking to break even.
What I care about more is the interplay between volume and price: during the up-move from August 10 to 13, volume was consistently above 100M. Now the price is elevated and volume is contracting. If over the next few days it can hold the 0.0025–0.0026 area and volume can pick back up, then this move is likely just a continuation (a relay). If it breaks down, then only around 0.0023 do you get any meaningful support and follow-through. Since the ATH is still far away, there’s no need to rush looking at that. For now, only one thing needs confirmation: is the shrinking volume a sign of building up energy, or does it mean the buy side is genuinely not strong enough? We’ll have to wait for next week’s volume to provide the answer.
With a market cap of 1.08B ranked at #63, it suggests the funds are treating it as a mid-sized asset rather than the kind of meme-like impulse it used to be. What’s truly worth noting is that over the last 7 days it’s still up +13.88%, meaning this pullback is only flattening the steepness of the surge, without breaking the underlying trend. However, it’s still 68.84% away from its ATH—this number implies extremely heavy overhead trapped supply, and any time the price spikes higher, it will run into selling pressure from positions seeking to break even.
What I care about more is the interplay between volume and price: during the up-move from August 10 to 13, volume was consistently above 100M. Now the price is elevated and volume is contracting. If over the next few days it can hold the 0.0025–0.0026 area and volume can pick back up, then this move is likely just a continuation (a relay). If it breaks down, then only around 0.0023 do you get any meaningful support and follow-through. Since the ATH is still far away, there’s no need to rush looking at that. For now, only one thing needs confirmation: is the shrinking volume a sign of building up energy, or does it mean the buy side is genuinely not strong enough? We’ll have to wait for next week’s volume to provide the answer.
82
·
--
$PEPE has been stuck at the $0.000003 level for a month. Daily trading volume has shrunk from $313M on July 27 to $92M now. The price hasn’t moved a bit, but the “water” in the pool has dropped by seventy percent. This doesn’t look like bottoming—it looks like nobody is willing to tell a story at this price anymore.
What’s truly worth noting is its position: market cap rank #63, down 90% from ATH. That number means that even if $PEPE someday returns to its previous high, to repair back to $0.000028 would require roughly a 9x move. Meme-sector capital always chases something new; old-school favorites are the easiest to be treated as a cash machine during narrative rotations—not exactly sold off, but simply forgotten.
What I care about more is where the liquidity went. In the same meme track, newly issued cat-and-dog coins are absorbing incremental capital, while the volume curve of $PEPE keeps sloping downward. If, over the next few weeks, trading volume continues to grind around $100M, it will very likely enter a low-volatility, low-attention “standoff zone.” Holders are waiting for some catalyst, but there’s no sign of it in the current tape.
Of course, on the flip side, this kind of condition might not be a bad thing. If $PEPE can continue to consolidate with shrinking volume near $0.000003 and rotate floating supply cleanly, then the resistance for the rebound could actually be lower. The key confirmation signal is: on a given day, volume reclaims above $200M and the price breaks out of this consolidation range. Until then, it’s just a frog lying still. What funding clues are you seeing that are influencing $PEPE ’s next move?
$PEPE has been stuck at the $0.000003 level for a month. Daily trading volume has shrunk from $313M on July 27 to $92M now. The price hasn’t moved a bit, but the “water” in the pool has dropped by seventy percent. This doesn’t look like bottoming—it looks like nobody is willing to tell a story at this price anymore.
What’s truly worth noting is its position: market cap rank #63, down 90% from ATH. That number means that even if $PEPE someday returns to its previous high, to repair back to $0.000028 would require roughly a 9x move. Meme-sector capital always chases something new; old-school favorites are the easiest to be treated as a cash machine during narrative rotations—not exactly sold off, but simply forgotten.
What I care about more is where the liquidity went. In the same meme track, newly issued cat-and-dog coins are absorbing incremental capital, while the volume curve of $PEPE keeps sloping downward. If, over the next few weeks, trading volume continues to grind around $100M, it will very likely enter a low-volatility, low-attention “standoff zone.” Holders are waiting for some catalyst, but there’s no sign of it in the current tape.
Of course, on the flip side, this kind of condition might not be a bad thing. If $PEPE can continue to consolidate with shrinking volume near $0.000003 and rotate floating supply cleanly, then the resistance for the rebound could actually be lower. The key confirmation signal is: on a given day, volume reclaims above $200M and the price breaks out of this consolidation range. Until then, it’s just a frog lying still. What funding clues are you seeing that are influencing $PEPE ’s next move?
What’s truly worth noting is its position: market cap rank #63, down 90% from ATH. That number means that even if $PEPE someday returns to its previous high, to repair back to $0.000028 would require roughly a 9x move. Meme-sector capital always chases something new; old-school favorites are the easiest to be treated as a cash machine during narrative rotations—not exactly sold off, but simply forgotten.
What I care about more is where the liquidity went. In the same meme track, newly issued cat-and-dog coins are absorbing incremental capital, while the volume curve of $PEPE keeps sloping downward. If, over the next few weeks, trading volume continues to grind around $100M, it will very likely enter a low-volatility, low-attention “standoff zone.” Holders are waiting for some catalyst, but there’s no sign of it in the current tape.
Of course, on the flip side, this kind of condition might not be a bad thing. If $PEPE can continue to consolidate with shrinking volume near $0.000003 and rotate floating supply cleanly, then the resistance for the rebound could actually be lower. The key confirmation signal is: on a given day, volume reclaims above $200M and the price breaks out of this consolidation range. Until then, it’s just a frog lying still. What funding clues are you seeing that are influencing $PEPE ’s next move?
1
163

·
--
🔥 1. PENGU +14% – climbing fast, now #107 in market cap.
2. PUMP +9% – surging to rank #63, showing strong community buzz. 🚀
3. ETH +3% – solid at #2, ETHFI +7%, CASHCAT +5%, STONKBROKER +2% keep us optimistic. 🐱
$EDEN, $SCRT, $EDEN
🔥 1. PENGU +14% – climbing fast, now #107 in market cap.
2. PUMP +9% – surging to rank #63, showing strong community buzz. 🚀
3. ETH +3% – solid at #2, ETHFI +7%, CASHCAT +5%, STONKBROKER +2% keep us optimistic. 🐱
$EDEN , $SCRT, $EDEN
2. PUMP +9% – surging to rank #63, showing strong community buzz. 🚀
3. ETH +3% – solid at #2, ETHFI +7%, CASHCAT +5%, STONKBROKER +2% keep us optimistic. 🐱
$EDEN , $SCRT, $EDEN
185
·
--
At a glance, $PUMP has risen 93.78% over these past 30 days, yet I don’t feel this is the starting point of a brand-new trend. The price climbed from 0.0015 to 0.0027, but the daily trading volume has been declining: August 10 was 132M, the 11th was 138M, and by the 13th it dropped to only 83M—latest at 74M. The price is holding flat, but the volume has shrunk by half. A volume contraction can be read as “tightening supply” (holders being reluctant to sell), or it can mean “insufficient follow-through.” I lean toward the latter.
There’s another easy-to-miss point: even after doubling, $PUMP is still 68.57% away from its ATH. With a market cap of 1.09B, it ranks at #63. Above this level is a trapped supply zone—not a vacuum. A 24-hour gain of +2.19% looks more like a brief balance between longs and shorts around 0.0027, not a strong confirmation.
What current holders most need is not a target price, but confirmation of whether volume can still stay contained when price retraces to 0.0023–0.0024. If afterward it expands in volume and reclaims that level, then my judgment here will be invalid. Conversely, if you think this leg can go farther, what variable are you watching? Is it some yet-unannounced catalyst, or is external liquidity truly flowing back in?
At a glance, $PUMP has risen 93.78% over these past 30 days, yet I don’t feel this is the starting point of a brand-new trend. The price climbed from 0.0015 to 0.0027, but the daily trading volume has been declining: August 10 was 132M, the 11th was 138M, and by the 13th it dropped to only 83M—latest at 74M. The price is holding flat, but the volume has shrunk by half. A volume contraction can be read as “tightening supply” (holders being reluctant to sell), or it can mean “insufficient follow-through.” I lean toward the latter.
There’s another easy-to-miss point: even after doubling, $PUMP is still 68.57% away from its ATH. With a market cap of 1.09B, it ranks at #63. Above this level is a trapped supply zone—not a vacuum. A 24-hour gain of +2.19% looks more like a brief balance between longs and shorts around 0.0027, not a strong confirmation.
What current holders most need is not a target price, but confirmation of whether volume can still stay contained when price retraces to 0.0023–0.0024. If afterward it expands in volume and reclaims that level, then my judgment here will be invalid. Conversely, if you think this leg can go farther, what variable are you watching? Is it some yet-unannounced catalyst, or is external liquidity truly flowing back in?
There’s another easy-to-miss point: even after doubling, $PUMP is still 68.57% away from its ATH. With a market cap of 1.09B, it ranks at #63. Above this level is a trapped supply zone—not a vacuum. A 24-hour gain of +2.19% looks more like a brief balance between longs and shorts around 0.0027, not a strong confirmation.
What current holders most need is not a target price, but confirmation of whether volume can still stay contained when price retraces to 0.0023–0.0024. If afterward it expands in volume and reclaims that level, then my judgment here will be invalid. Conversely, if you think this leg can go farther, what variable are you watching? Is it some yet-unannounced catalyst, or is external liquidity truly flowing back in?
110
·
--
$PUMP my first impression is that this wave of gains doesn’t look like a meme-driven rotation of sentiment; it looks more like the logic of a platform token is being repriced. But this hunch needs data to validate: can it maintain trading volume during a pullback, instead of just lifting price with a message-driven spike?
On the numbers, there is indeed support. In the past 30 days, it flipped from $0.00146 to $0.0027, with market cap touching $1.07B and ranking #63, while today it’s only up 0.59% over 24 hours—after the short-term acceleration, the market seems to be hesitating. What I care about more is that it’s still 69% away from ATH, meaning there’s a batch of trapped chips sitting above between $0.006 and $0.008; the closer the rebound gets to that zone, the more real the sell pressure becomes.
The core of what this capital is betting on is the expectation that the token-issuing platform will retell the economic model story. So going forward, it’s not just about whether it’s bullish or bearish—it’s about the pattern: if it pulls back to $0.0024 with reduced volume and holds sideways there, then the continuation of this rally is still intact; if it breaks back down to below $0.002 on increased volume, then the prior 30 days can only be counted as one big-scale rebound, not a trend reversal.
There’s really only one question worth testing: $PUMP will the upcoming pullback complete with lower volume or with higher volume? That answer matters more than all my inferences above. Don’t rush to take sides—the chart will give the ticket.
$PUMP my first impression is that this wave of gains doesn’t look like a meme-driven rotation of sentiment; it looks more like the logic of a platform token is being repriced. But this hunch needs data to validate: can it maintain trading volume during a pullback, instead of just lifting price with a message-driven spike?
On the numbers, there is indeed support. In the past 30 days, it flipped from $0.00146 to $0.0027, with market cap touching $1.07B and ranking #63, while today it’s only up 0.59% over 24 hours—after the short-term acceleration, the market seems to be hesitating. What I care about more is that it’s still 69% away from ATH, meaning there’s a batch of trapped chips sitting above between $0.006 and $0.008; the closer the rebound gets to that zone, the more real the sell pressure becomes.
The core of what this capital is betting on is the expectation that the token-issuing platform will retell the economic model story. So going forward, it’s not just about whether it’s bullish or bearish—it’s about the pattern: if it pulls back to $0.0024 with reduced volume and holds sideways there, then the continuation of this rally is still intact; if it breaks back down to below $0.002 on increased volume, then the prior 30 days can only be counted as one big-scale rebound, not a trend reversal.
There’s really only one question worth testing: $PUMP will the upcoming pullback complete with lower volume or with higher volume? That answer matters more than all my inferences above. Don’t rush to take sides—the chart will give the ticket.
On the numbers, there is indeed support. In the past 30 days, it flipped from $0.00146 to $0.0027, with market cap touching $1.07B and ranking #63, while today it’s only up 0.59% over 24 hours—after the short-term acceleration, the market seems to be hesitating. What I care about more is that it’s still 69% away from ATH, meaning there’s a batch of trapped chips sitting above between $0.006 and $0.008; the closer the rebound gets to that zone, the more real the sell pressure becomes.
The core of what this capital is betting on is the expectation that the token-issuing platform will retell the economic model story. So going forward, it’s not just about whether it’s bullish or bearish—it’s about the pattern: if it pulls back to $0.0024 with reduced volume and holds sideways there, then the continuation of this rally is still intact; if it breaks back down to below $0.002 on increased volume, then the prior 30 days can only be counted as one big-scale rebound, not a trend reversal.
There’s really only one question worth testing: $PUMP will the upcoming pullback complete with lower volume or with higher volume? That answer matters more than all my inferences above. Don’t rush to take sides—the chart will give the ticket.
68

·
--
I've checked CoinGecko's trending tokens, and I'm excited to share my findings.
I see Pudgy Penguins and BOOK OF MEME are gaining attention, with market cap ranks #105 and #383, respectively.
I'm watching Pump.fun, ranked #63, and Sui, ranked #29, for potential growth, with Ethereum at #2 🚀.
I think these tokens show promise, with some already seeing significant % changes.
I believe it's worth keeping an eye on them, as their market cap ranks may change 📊.
I'm looking forward to seeing how they perform, and I hope they bring good returns 💰.
$BMT, $MUBARAK, $BMT
I've checked CoinGecko's trending tokens, and I'm excited to share my findings.
I see Pudgy Penguins and BOOK OF MEME are gaining attention, with market cap ranks #105 and #383, respectively.
I'm watching Pump.fun, ranked #63, and Sui, ranked #29, for potential growth, with Ethereum at #2 🚀.
I think these tokens show promise, with some already seeing significant % changes.
I believe it's worth keeping an eye on them, as their market cap ranks may change 📊.
I'm looking forward to seeing how they perform, and I hope they bring good returns 💰.
$BMT , $MUBARAK , $BMT
I see Pudgy Penguins and BOOK OF MEME are gaining attention, with market cap ranks #105 and #383, respectively.
I'm watching Pump.fun, ranked #63, and Sui, ranked #29, for potential growth, with Ethereum at #2 🚀.
I think these tokens show promise, with some already seeing significant % changes.
I believe it's worth keeping an eye on them, as their market cap ranks may change 📊.
I'm looking forward to seeing how they perform, and I hope they bring good returns 💰.
$BMT , $MUBARAK , $BMT
1
251

·
--
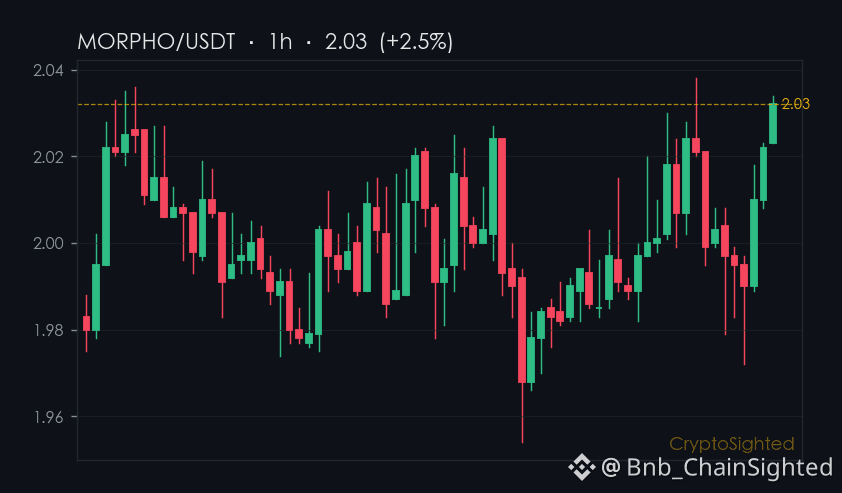
Morpho launches fixed-rate lending protocol on Base.
Fixed-rate lending is making a quiet comeback.
Morpho’s move on Base could be the spark that rekindles interest in a sector that’s been struggling to hold its ground.
Think of it like a savings account - predictable, stable, and not prone to wild swings.
That’s the appeal of fixed-rate lending, and Morpho is betting on it.
The protocol’s launch on Base isn’t just a technical upgrade; it’s a statement that DeFi doesn’t have to be chaotic to be functional.
—
Not financial advice. DYOR.
📌 News Take · #63 · #CryptoNews #CryptoSighted $MORPHO
Morpho launches fixed-rate lending protocol on Base.
Fixed-rate lending is making a quiet comeback.
Morpho’s move on Base could be the spark that rekindles interest in a sector that’s been struggling to hold its ground.
Think of it like a savings account - predictable, stable, and not prone to wild swings.
That’s the appeal of fixed-rate lending, and Morpho is betting on it.
The protocol’s launch on Base isn’t just a technical upgrade; it’s a statement that DeFi doesn’t have to be chaotic to be functional.
—
Not financial advice. DYOR.
📌 News Take · #63 · #CryptoNews #CryptoSighted $MORPHO
Fixed-rate lending is making a quiet comeback.
Morpho’s move on Base could be the spark that rekindles interest in a sector that’s been struggling to hold its ground.
Think of it like a savings account - predictable, stable, and not prone to wild swings.
That’s the appeal of fixed-rate lending, and Morpho is betting on it.
The protocol’s launch on Base isn’t just a technical upgrade; it’s a statement that DeFi doesn’t have to be chaotic to be functional.
—
Not financial advice. DYOR.
📌 News Take · #63 · #CryptoNews #CryptoSighted $MORPHO
232

·
--
Bullish

1
32
·
--
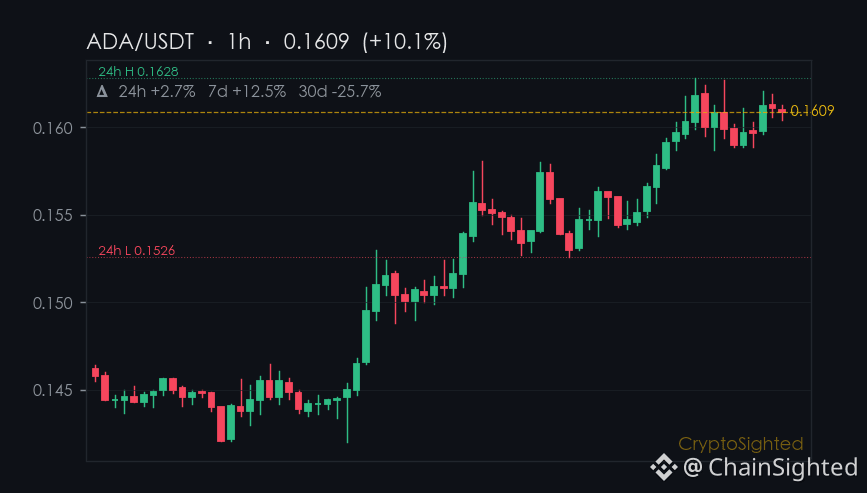
$ADA’s 3.01% rise in the past 24 hours isn’t the biggest story — it’s the quiet shift in focus that matters.
Look at $BTC: it’s trading near $61,533.83, up just 1.66% from its recent range. A news event tied to it landed — yet the price barely reacted. That’s not a sign of indifference, but a possible indication that the market already priced in the expectation.
Same with $BNB: it’s sitting at $557.15, up only 0.51% despite a news event. The market shrugged again.
Now consider ADA, which is up 3.01% — not because of hype, but because of a pattern. It’s been quietly climbing over the past 7 days, with a 11.6% gain, and its 30-day change is still down 19.7%. That’s not a sudden explosion — it’s a steady climb that’s gone unnoticed.
The broader market is moving, but not everyone is moving in the same direction. ADA is gaining traction without a loud fanfare.
What does that say about where the attention is shifting?
—
Not financial advice. Crypto assets are high-risk; do your own research.
📌 Hotspot Watch · #63
#CryptoTrends #灼见观察 $ADA
$ADA ’s 3.01% rise in the past 24 hours isn’t the biggest story — it’s the quiet shift in focus that matters.
Look at $BTC : it’s trading near $61,533.83, up just 1.66% from its recent range. A news event tied to it landed — yet the price barely reacted. That’s not a sign of indifference, but a possible indication that the market already priced in the expectation.
Same with $BNB : it’s sitting at $557.15, up only 0.51% despite a news event. The market shrugged again.
Now consider ADA, which is up 3.01% — not because of hype, but because of a pattern. It’s been quietly climbing over the past 7 days, with a 11.6% gain, and its 30-day change is still down 19.7%. That’s not a sudden explosion — it’s a steady climb that’s gone unnoticed.
The broader market is moving, but not everyone is moving in the same direction. ADA is gaining traction without a loud fanfare.
What does that say about where the attention is shifting?
—
Not financial advice. Crypto assets are high-risk; do your own research.
📌 Hotspot Watch · #63
#CryptoTrends #灼见观察 $ADA
Look at $BTC : it’s trading near $61,533.83, up just 1.66% from its recent range. A news event tied to it landed — yet the price barely reacted. That’s not a sign of indifference, but a possible indication that the market already priced in the expectation.
Same with $BNB : it’s sitting at $557.15, up only 0.51% despite a news event. The market shrugged again.
Now consider ADA, which is up 3.01% — not because of hype, but because of a pattern. It’s been quietly climbing over the past 7 days, with a 11.6% gain, and its 30-day change is still down 19.7%. That’s not a sudden explosion — it’s a steady climb that’s gone unnoticed.
The broader market is moving, but not everyone is moving in the same direction. ADA is gaining traction without a loud fanfare.
What does that say about where the attention is shifting?
—
Not financial advice. Crypto assets are high-risk; do your own research.
📌 Hotspot Watch · #63
#CryptoTrends #灼见观察 $ADA
112

·
--
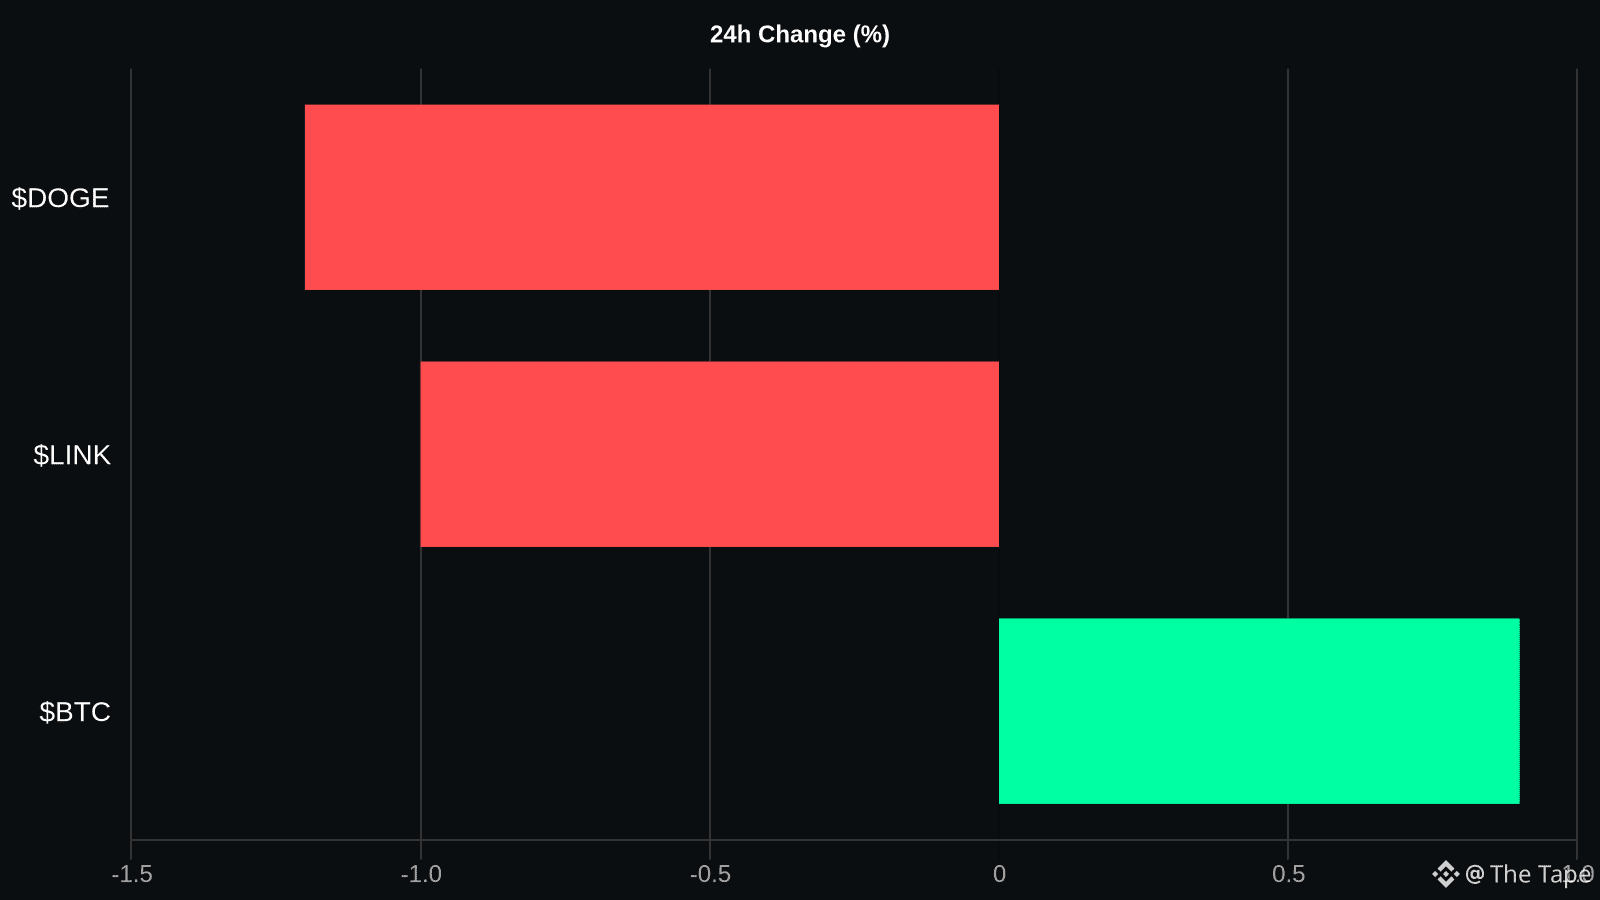
Trending on CoinGecko: $PI (rank #63), $SUI (rank #32), $ETH (rank #2). While $ETH holds a top spot, newer $SUI is gaining interest at a much lower rank, unlike $PI. Which one are you watching? Not financial advice. DYOR. #Crypto
Trending on CoinGecko: $PI (rank #63), $SUI (rank #32), $ETH (rank #2). While $ETH holds a top spot, newer $SUI is gaining interest at a much lower rank, unlike $PI. Which one are you watching? Not financial advice. DYOR. #Crypto
128
Log in to explore more content
Join global crypto users on Binance Square
⚡️ Get latest and useful information about crypto.
💬 Trusted by the world’s largest crypto exchange.
👍 Discover real insights from verified creators.
Email / Phone number
Trending Topics
1
#AppleDebutsFoldablePhone
17,129 views
364 Discussing
2
#IranSaysReadyToEscalateWarWithUS
0 views
4 Discussing
3
#EUExtendsCentralContactPointToCASPs
2,908 views
107 Discussing
4
#US10YTreasuryYieldHitsHighestSinceNov2023
18,837 views
329 Discussing
5
#USTreasuryToBuyBackUpTo$6BLongDatedDebt
13,944 views
158 Discussing
6
#BitcoinSurpasses$79K
63,102 views
275 Discussing
7
#BrentCrudeTops$100
119,212 views
397 Discussing
8
#USADPWeeklyEmploymentRises12000
101,454 views
1,244 Discussing
9
#BankOfAmericaGroupPilotsUSBDCStablecoin
74,359 views
1,003 Discussing
10
#RippleLobbiesToAdvanceCLARITYActVote
109,744 views
1,280 Discussing