

#499
499
252 views
6 Discussing
Hot
Latest

·
--
$NIL bounced +21% off the floor. But the floor it fell through is now the ceiling.
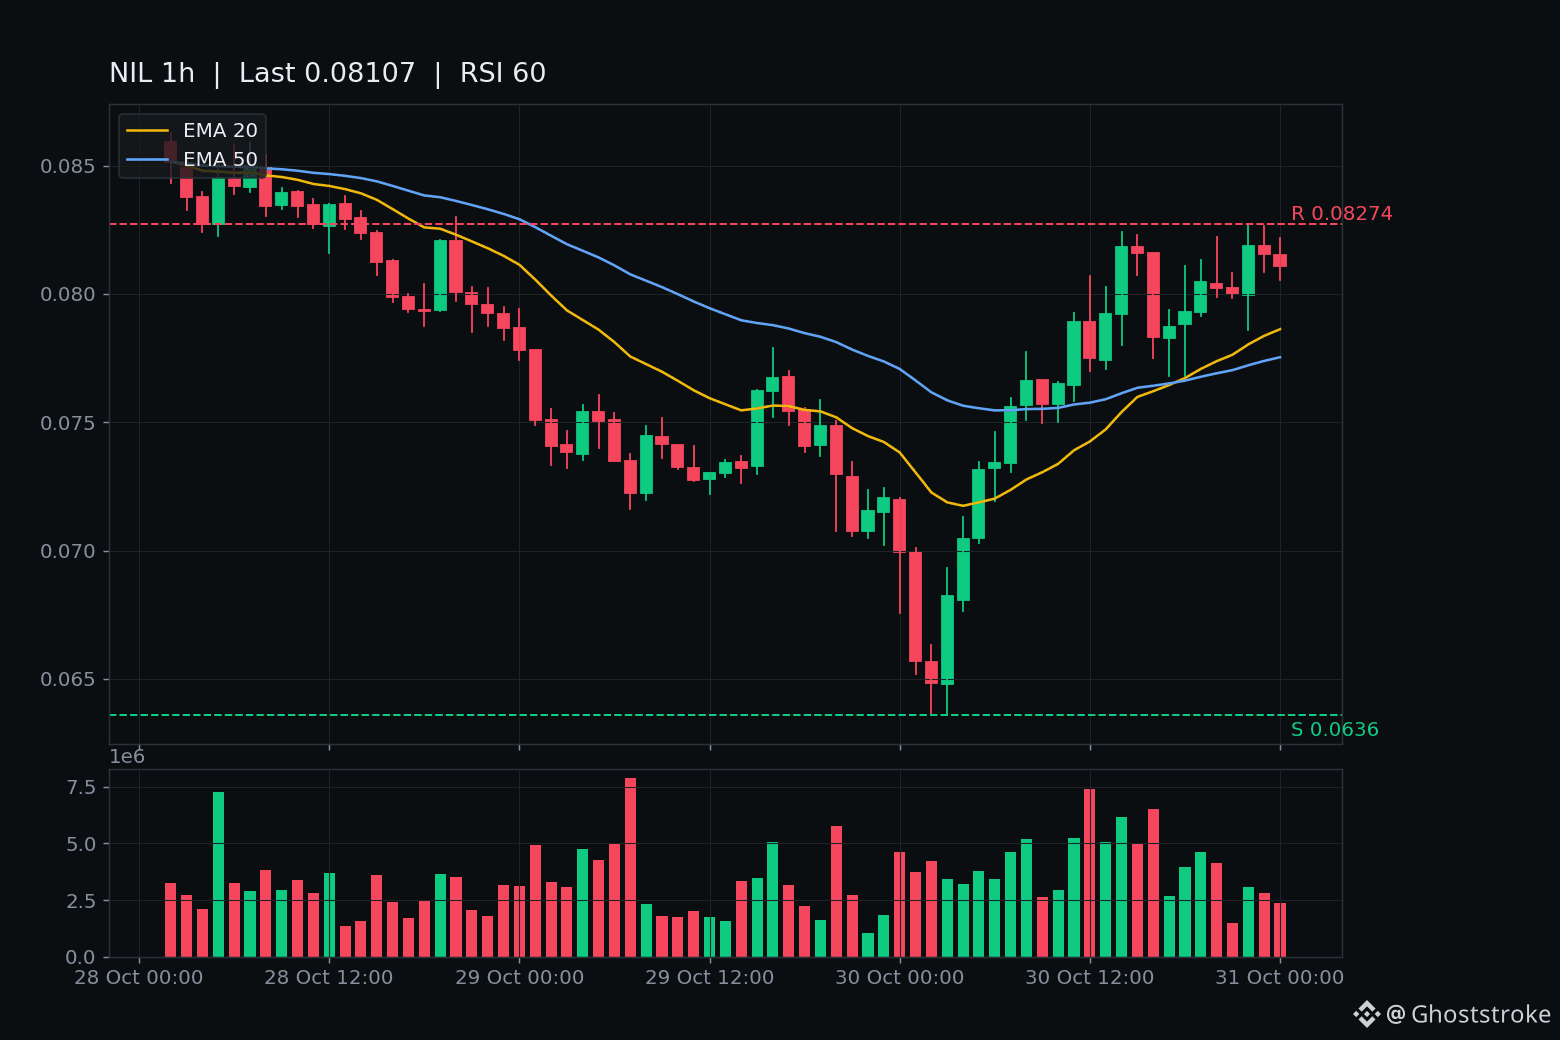
Here's the chapter nobody wrote. When post 289 left off (Oct 28, $0.0849), its named line was $0.08227 — "hourly close below = deeper air." Oct 30 at 00:59 UTC that close came: $0.06993 on $320k. Then the leg kept going — $0.06360 on the 03:59 bar. That's -54.5% off the Oct 27 spike, -25% under post 289's live, in about two days.
Then the turn. $0.06360 → $0.08274 across Oct 30's grind — a +30% bounce off the bottom, closes climbing $0.07046 → $0.08182 → $0.08188. Tonight: $0.08125, +21.4% 24h on $7.44M across 138k trades. The +21% is mostly window math — the washed low is still inside the 24h print.
And now the forensic detail. The $0.08227 line that broke on the way down is talking back on the way up: intraday tags at $0.08230, $0.08241, $0.08274 — zero closes above it. Four hours of price hugging a line it can't close through.
One correction to my own tape: post 255 said the Oct 27 blast had "no verified fresh catalyst." I missed it — Upbit opened NIL/KRW trading on Oct 27, the same day. The blast had a real driver, a real exchange listing. And the leg still unwound -54.5% in 48 hours. A real listing couldn't hold it. That's the entire lesson of this saga.
NIL: rank #499, $43.1M mcap, genuinely micro, -91% off its $0.897 ATH. Chart: RSI 60, price above 1h EMA20 $0.0786 and EMA50 $0.0775. Not washed out — but a bounce, not a base. The forming hour closes 02:00 UTC (07:30 IST) — its close decides whether $0.08227 gets its first close-above.
Levels: $0.08227 is the line (hourly close above = it finally gives); above, $0.09187 (the real reclaim — the unwind actually fails there); below, $0.06360 (24h low — a close under it is open air, no recent shelf in the window).
Not a call, either way. But does the 02:00 UTC close finally print above $0.08227 — or does the broken line talk back for the fourth time?
3

·
--
🔥 Calling out $BARD: On the daily chart, I’m on the 【bullish】 side
【View】$BARD (Lombard) → Bullish
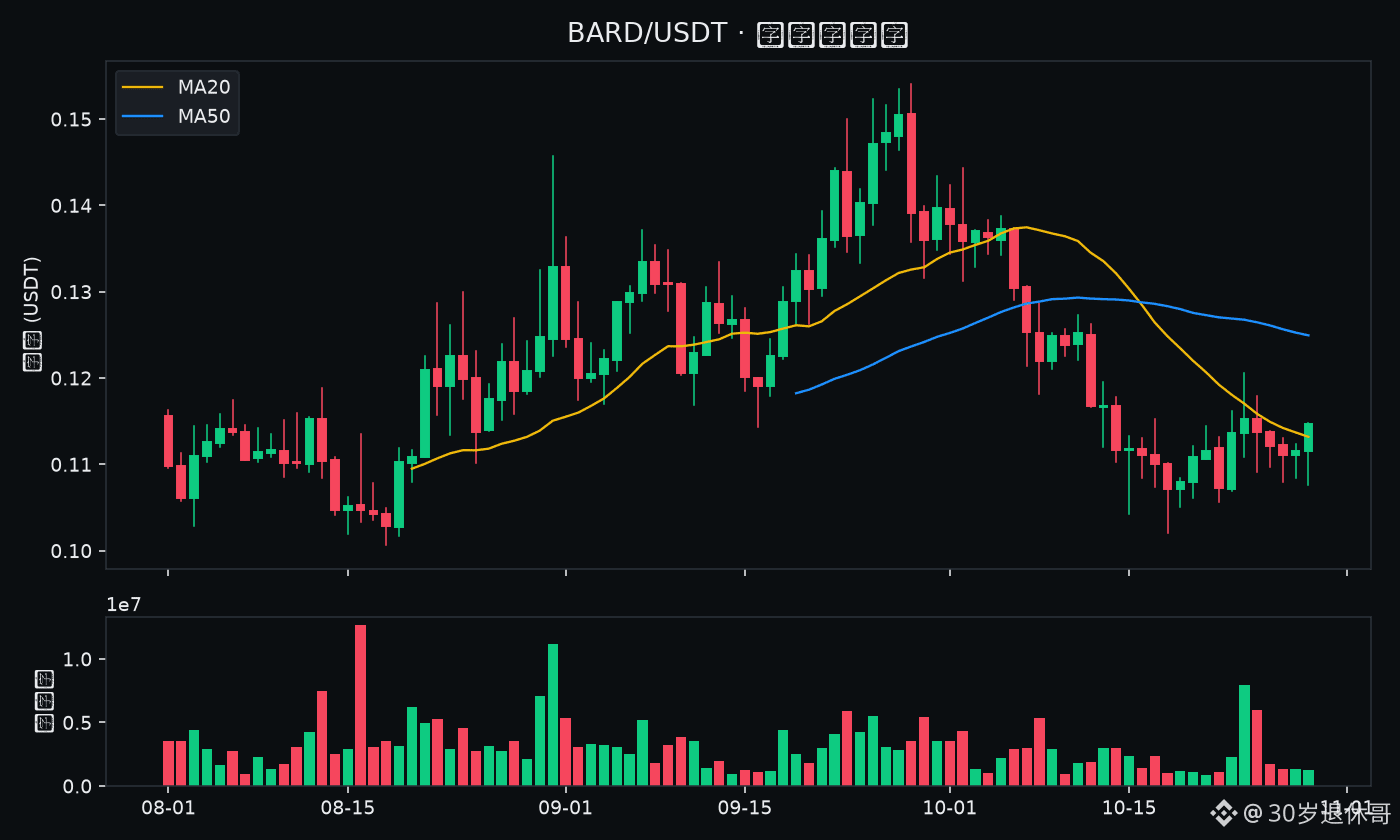
Market cap rank around #499, current price around 0.114700. MA20≈0.113185, MA50≈0.124936. The price is holding above the short-term moving averages, and several bearish attempts to push back haven’t changed the structure. When the trend is bullish, waiting for a much lower entry often means missing out. Key levels: support≈0.102100, resistance≈0.127300; invalidation level: 0.102100—if it breaks decisively, I’ll admit I’m wrong and turn neutral rather than stubbornly fighting the market. Volume has shrunk to 0.6 times the 20-day average; quiet periods often precede a move.
Key things to watch: whether buyers step in on a retest of 0.102100, and whether price can break above 0.127300 on rising volume.
Do you think support at $BARD can still hold? Share your thoughts in the comments.
⚠️ This is solely my personal technical observation of publicly available market data and is not investment advice. Crypto is extremely volatile—make your own decisions, manage risk strictly, and accept responsibility for your gains and losses.
$BTC $ETH $BARD #看多 #WriteToEarn
🔥 Calling out $BARD : On the daily chart, I’m on the 【bullish】 side
【View】$BARD (Lombard) → Bullish
Market cap rank around #499, current price around 0.114700. MA20≈0.113185, MA50≈0.124936. The price is holding above the short-term moving averages, and several bearish attempts to push back haven’t changed the structure. When the trend is bullish, waiting for a much lower entry often means missing out. Key levels: support≈0.102100, resistance≈0.127300; invalidation level: 0.102100—if it breaks decisively, I’ll admit I’m wrong and turn neutral rather than stubbornly fighting the market. Volume has shrunk to 0.6 times the 20-day average; quiet periods often precede a move.
Key things to watch: whether buyers step in on a retest of 0.102100, and whether price can break above 0.127300 on rising volume.
Do you think support at $BARD can still hold? Share your thoughts in the comments.
⚠️ This is solely my personal technical observation of publicly available market data and is not investment advice. Crypto is extremely volatile—make your own decisions, manage risk strictly, and accept responsibility for your gains and losses.
$BTC $ETH $BARD #看多 #WriteToEarn
1
519

·
--
AT order book flips instantly! The bid-ask spread widens abnormally—watch out for slippage in the short term00:49 (3 minutes ago) AT saw a surge of 3.6% during the session. As of 00:52:16, the current price is 0.1345, up 3.2% over the past 24h. Other assets with the same batch of abnormal movements include CYBER and MOVR.
📅 Data as of 00:52:16 (event trigger time is indicated in each note; prices are real-time snapshots at the time of writing)
📌 One-sentence highlight: The order book is getting thinner, causing slippage to increase; reduce speed for short-term orders first
Market Overview: BTC 80,977.70(-2.90%) · ETH 2,420.16(-5.73%); 57 gainers / 329 losers across the whole market over the past 24h; top gainer OGN+76.86%, top decliner SAND-19.07%.
—— Event Details ——
1. Key time points for urgent movement
AT order book flips instantly! The bid-ask spread widens abnormally—watch out for slippage in the short term
00:49 (3 minutes ago) AT saw a surge of 3.6% during the session. As of 00:52:16, the current price is 0.1345, up 3.2% over the past 24h. Other assets with the same batch of abnormal movements include CYBER and MOVR.
📅 Data as of 00:52:16 (event trigger time is indicated in each note; prices are real-time snapshots at the time of writing)
📌 One-sentence highlight: The order book is getting thinner, causing slippage to increase; reduce speed for short-term orders first
Market Overview: BTC 80,977.70(-2.90%) · ETH 2,420.16(-5.73%); 57 gainers / 329 losers across the whole market over the past 24h; top gainer OGN+76.86%, top decliner SAND-19.07%.
—— Event Details ——
1. Key time points for urgent movement
3
Log in to explore more content
Join global crypto users on Binance Square
⚡️ Get latest and useful information about crypto.
💬 Trusted by the world’s largest crypto exchange.
👍 Discover real insights from verified creators.
Email / Phone number
Trending Topics
1
#BinanceReports80%Recoveryof$6.3BillioninLossesfromHackIncident
1,605 views
43 Discussing
2
#HeYiSaysWithdrawalsExpectedtoResumeWithin42Hours
1,694 views
73 Discussing
3
#CZSaysCompensationIsinPlaceUsersAreProtected
1,060 views
51 Discussing
4
#RichardTengSaysBinanceWillCoverAllHackedLosseswithCompanyFunds
0 views
2 Discussing
5
#TRMCambodianCasinosReceived$1.07BInCrypto
423 views
26 Discussing
6
#USDCCirculationFallsAbout800MInSevenDays
1,672 views
65 Discussing
7
#SuspectedNorthKoreaAttacksAccountForNearly89%OfCryptoHackLosses
5,390 views
63 Discussing
8
#OpenAICutsFundraisingTargetBy$10B
997 views
50 Discussing
9
#ASICHasReceivedNoPredictionMarketApplications
17,222 views
474 Discussing
10
#RecallAnnouncesLiquidationPlansToBurn35.86%OfSupply
529 views
22 Discussing