Credit Suisse pulled U.S. stocks lower, but a positive sign is that Bitcoin and some altcoins remain near local highs.

On March 15, U.S. stocks plunged after Saudi National Bank, the Swiss bank’s largest investor, said it would not be able to provide more funding to Credit Suisse due to regulatory restrictions.
Investors are nervous because Credit Suisse, which has large U.S. and global operations, warned on March 14 that it had discovered "certain material deficiencies" in its financial reporting processes for 2021 and 2022. Credit Suisse shares plunged to an all-time low on March 15.
Following the events of the past few days, the S&P 500 gave up all of its gains for the year and was flat. In contrast, Bitcoin has held on to most of its gains, rising nearly 47% in 2023.
Trezor Bitcoin analyst Josef Tětek believes that the banking crisis could be beneficial for Bitcoin as it could become a safe-haven asset.

Charles Edwards, CEO and founder of Capriole, said Bitcoin has formed a “bumpy run reversal pattern” that targets $100,000 or more. However, Edwards cautioned traders that the pattern could fail and should not be used to make trading or investment plans.
Can Bitcoin and altcoins break above their overhead resistance and start the next leg higher? Let’s study a chart of the top 10 cryptocurrencies to find out.
Bitcoin Price Analysis
Bulls pushed Bitcoin towards overhead resistance at $25,250 on March 14, but the long wick on the candlestick suggests that bears are not ready to give up without a fight. The strong sell-off brought the price back below $25,250.

The 20-day exponential moving average ($23,012) has started to move upwards and the relative strength index (RSI) is in positive territory, indicating favorability for buyers.
If bulls do not give up too much ground from current levels, the chances of a breakout and close above $25,250 increase. If this happens, the BTC/USDT pair will complete a bullish Head and Shoulders (H&S) reversal pattern. This would signal a potential trend change. The pair could then head towards $32,000.
If the bears want to slow down the bullish momentum, they will have to pull the price back below the moving averages quickly.
Ethereum price analysis
Ethereum
There was a surge above the overhead resistance at $1,743 on March 14, but the bulls were unable to sustain higher levels. This suggests that the bears are trying to protect this level.

If the price consolidates between $1,743 and the 20-day EMA ($1,588), it would indicate that market sentiment has turned positive and traders are buying the dip. This would improve prospects for a breakout and close above $1,743. The ETH/USDT pair is then well-positioned to rebound strongly towards the psychological $2,000 level.
Contrary to this assumption, if the price turns down and breaks below the moving averages, it will suggest that the ETH/USDT pair might consolidate in a larger range between $1,743 and $1,352 for a while.
BNB price analysis
Binance Coin
It is retreating from strong resistance near $318. This suggests that the bears are trying to defend the area between $318 and $338.

A small positive in favor of buyers is that they did not allow the price to fall below the 50-day simple moving average ($306). Shallow pullbacks indicate buying on every minor dip.
The bulls will once again try to push the price above the overhead zone. If they do, the BNB/USDT pair could surge to $400. Conversely, if the price falls below the 50-day EMA, the pair could slide towards the 20-day EMA ($296). A break below this level will send a signal to the bears.
Ripple Price Analysis
Ripple declined from the 50-day EMA ($0.38) on March 14 and formed a doji candlestick pattern, indicating indecision between bulls and bears.
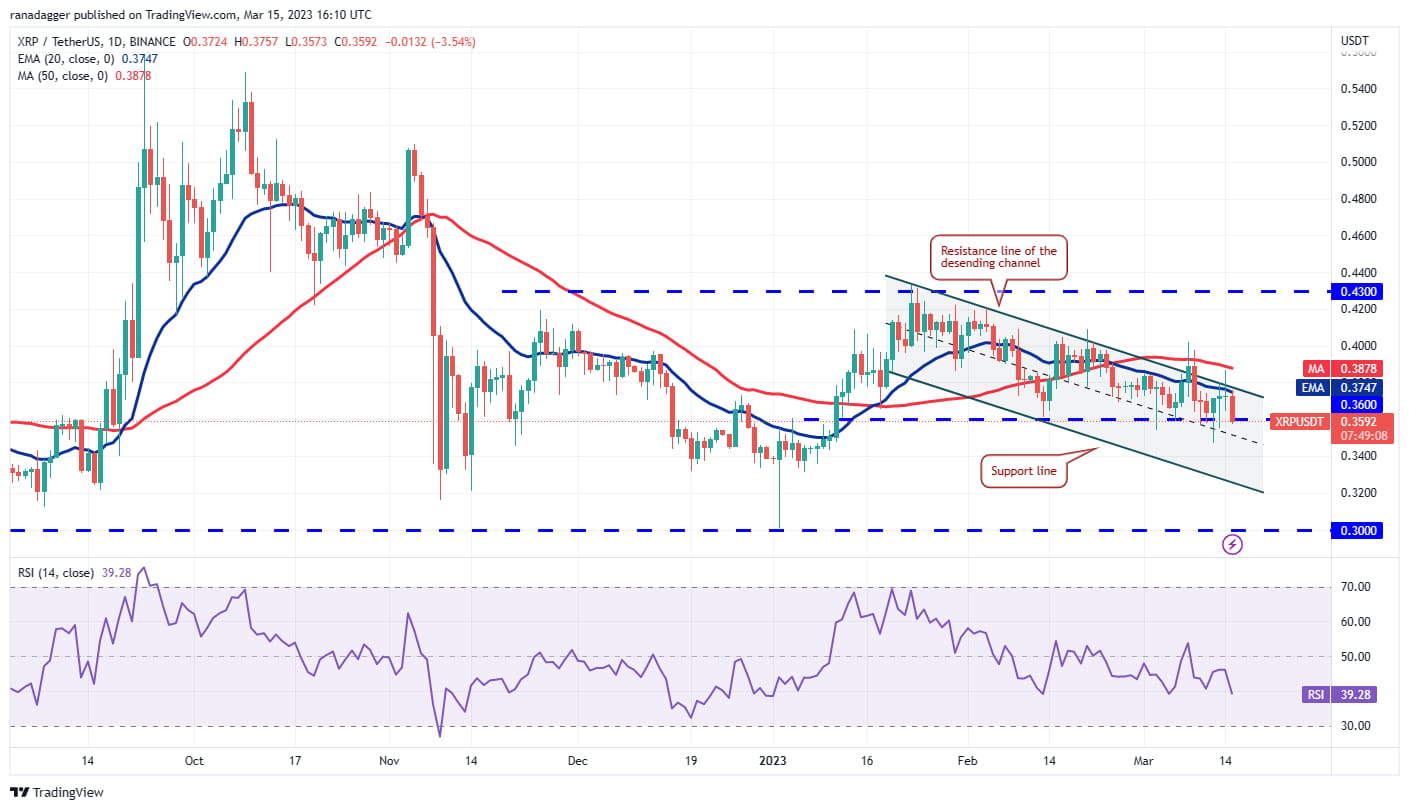
Uncertainty has turned negative on March 15 and the price has fallen to strong support at $0.36. If this level is breached, the XRP/USDT pair could fall towards the channel’s support line near $0.32.
On the other hand, if the price stays above $0.36, the bulls will once again try to overcome the 50-day SMA and $0.40 hurdles. If they succeed, the pair is likely to gain momentum and climb to $0.43.
Cardano Price Analysis
cardano
The rise accelerated on March 14 and hit the 50-day EMA ($0.36), but the long wick on the candlestick that day suggested that bears were selling on the rally.

Bears have pulled the price back below the 20-day EMA ($0.34) on March 15, clearing the way for a possible retest of $0.30. Buyers are likely to be fully protective of this level as the next support lies as low as $0.27.
Alternatively, if the price rebounds off the current levels or from $0.30, it will suggest that traders are buying on dips. This could keep the ADA/USDT pair range-bound between the 50-day EMA and $0.50 for a few days.
Dogecoin Price Analysis
Dogecoin
The recovery has reached the downtrend line and bears are forming strong resistance.

The downward sloping 20-day EMA ($0.07) and the RSI in negative territory suggest that the bears are in control. Sellers are trying to sink the price below the immediate support at $0.07. If this support collapses, the DOGE/USDT pair could drop to $0.06.
Conversely, if the price rebounds off the current levels, it will suggest that lower levels are attracting buyers. The downtrend line remains a crucial level to the upside as a breakout of it could start a rally to $0.10.
Polygon Price Analysis
Matic
The relief rally faces strong resistance at the 50-day EMA ($1.22). This has pulled the price below the 20-day EMA ($1.16) on March 15.

The MATIC/USDT pair is likely to crash towards the strong support at $1.05. This is an important level to watch because if it breaks, the pair could retest support at $0.94. A move below this level would open the door to a possible drop to $0.69.
Another possibility is that the price rebounds from the support at $1.05. If this happens, bulls will once again try to push the price above the 50-day EMA. If they succeed, the chances of a move above $1.30 will increase.
RELATED: 4 Signs Bitcoin Price Rally Could Now Top $26,000
Solana Price Analysis
Bears are trying to stop Solana's Sol
There was a rebound at the 50-day EMA ($22.40), but bulls attempted to hold the price above the immediate support at $19.68.

This indicates that bulls will once again try to push the price towards the downtrend line. This is an important resistance to watch closely, as a breakout and close above this resistance will signal a potential trend change. There is a small resistance at $28, but it is likely to be broken. The SOL/USDT pair could then surge towards $39.
Conversely, if the price continues lower and breaks below $19.68, it will be a sign that the bears have not given up yet. The pair may then drop to the strong support at $15.28.
Polkadot price analysis
Buyers try to push Polkadot points
The price was above the 50-day EMA ($6.42) on March 14, but the bears are not letting up. This shows that higher levels are attracting sellers.

Both moving averages are flattening and the RSI is just below the midpoint, indicating a balance between bulls and bears. If the price breaks and sustains below the 20-day EMA ($6.07), the DOT/USDT pair is likely to trade between the 50-day EMA and $5 for a few days.
If buyers push the price above the 50-day EMA, the pair could gain momentum and surge towards the neckline of the inverse H&S pattern. On the downside, bears will have to sink the pair below $5 to signal a comeback.
Shiba Inu Price Analysis
Shiba Inu SHIB
Trade within the descending channel pattern. The bulls tried to push the price above the channel, but the bears held their ground.

The bears will once again try to sink the price below the psychological support at $0.000010. If they manage to do so, the SHIB/USDT pair may fall towards the channel’s support line. Bulls are likely to defend the $0.000008 to $0.000007 area with full force.
If the price rebounds off this level, it will suggest that the pair might consolidate in a large range between $0.000018 and $0.000007 for a while.
In the short term, a breakout above the 50-day SMA ($0.000012) will tip the advantage in favor of the bulls. The pair might then attempt a rally to $0.000014 and above it to $0.000016.
C3 Tip: The views, thoughts and opinions expressed here are the author's own and do not constitute investment advice or recommendations. Every investment and transaction involves risk.