
Author: Nancy Lubale, CoinTelegraph; Translated by Tao Zhu, Golden Finance
Since March 11, BTC prices have been consolidating between $76,600 and $87,500.
According to technical and on-chain indicators, Bitcoin's consolidation may last for some time. The remaining key question is when Bitcoin will break out of the current multi-week range.
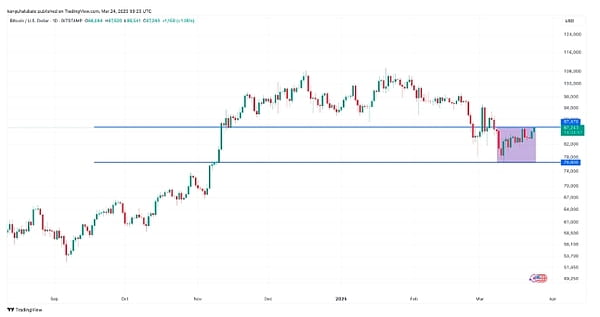
XRP/USD daily chart. Source: Cointelegraph/TradingView
BTC prices must rise above $90,000 to end the consolidation.
A well-known cryptocurrency analyst stated that Bitcoin may continue to consolidate in the current range for some time, especially if it cannot reclaim $90,000.
Market analyst Daan Crypto Trades stated in a March 23 post on X:
Since March 11, BTC price movements have been 'volatile,' failing to produce consecutive green or red candles within the daily timeframe.
Once the price returns to the previous range (above $90,000), sentiment and momentum will once again favor the bulls.
If this happens, 'new highs will be set soon.'
If not, a potential retest of the '2024/summer consolidation' between $73,000 and $74,000 could occur, which should at least provide some support.
“Currently, the price is essentially at the midpoint.”
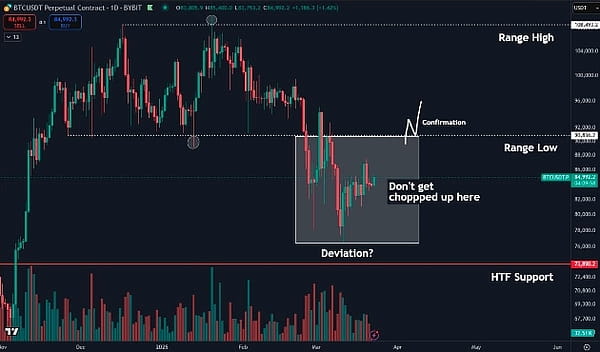
BTC/USD daily chart. Source: Daan Crypto Trades
Analyst Jelle also expressed the same view, stating that Bitcoin's current consolidation cycle may continue until the price breaks above $90,000.
“Breaking this point will make things very, very good again.”
For analyst Rekt Capital, Bitcoin's weekly closing price must be above $88,000 to confirm a higher breakout.
In an article on March 24, this analyst stated:
Bitcoin is about to retest the resistance provided by the 21-week exponential moving average (EMA) (green), which is the top of the triangular market structure formed by the 21-week EMA and the 50-week EMA.
BTC needs to close weekly above the green EMA at $88,400 and then retest to confirm a breakout above $93,500.
A similar price movement occurred in 2021 when Bitcoin's weekly closing price exceeded $40,000, followed by a candle retesting that level the next week before moving upward.
“If history repeats itself, such fluctuations near the 21-week EMA would not be surprising.”
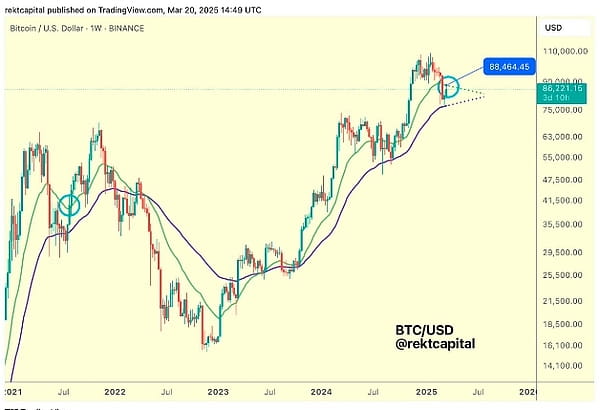
BTC/USD weekly chart. Source: Rekt Capital
BTC funding rates remain sluggish
One of the most obvious signs that Bitcoin's future price movements will be more volatile is the negative funding rates in its futures market and a decrease in open interest (OI).
Key Points:
The funding rate is a periodic payment between long and short traders in perpetual futures contracts to keep prices in line with the spot market.
When the indicator turns negative, bears pay bulls, indicating bearish sentiment.
The BTC funding rate is around 0%, indicating market indecision.
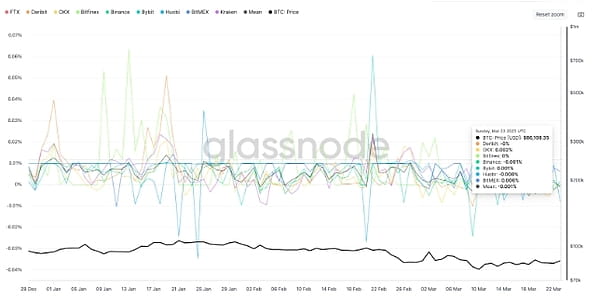
Funding rates for BTC perpetual futures across all exchanges. Source: Glassnode
When the funding rate is zero, the cost of holding positions is very low, reducing the pressure on traders to exit long or short positions.
This can stabilize Bitcoin's price in the short term, as neither side is paying a premium, thus dampening volatility and leading to continued consolidation.
This may also indicate accumulation before a potential rebound or distribution before another leg down.
Trading firm QCP Capital stated in a Telegram report to investors that although Bitcoin had a 'modest rebound' over the weekend, breaking above $85,000, 'the funding rates remain flat' and added:
“We remain cautious about the prospect of a sustained breakout to the upside.”
Bitcoin price consolidation is coming to an end—Bollinger Bands
The Bitcoin volatility indicator shows that expectations for a BTC price breakout are increasing.
Key Points:
The tightening conditions of the Bollinger Bands indicate that a breakout may be very close.
Weekly Bollinger Bands are at extreme oversold levels, touching their lower green line.
The width of the Bollinger Bands is as tight as it was from July 2024 to October 2024, when it consolidated between $63,000 and $69,000, setting the historical high of 2021.
Thereafter, BTC/USD rose 60% from $67,500 in October 2026 to reach the 2024 high of $106,000 in December 2024.
This indicator was similarly tight between June 2023 and September 2023, during which BTC prices rose 176% from $24,400 to $73,800 on March 14, 2024.
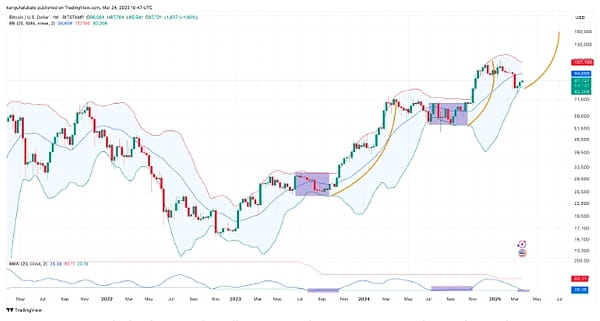
BTC/USD daily chart with Bollinger Bands. Source: Cointelegraph/TradingView
If history repeats itself, Bitcoin may soon break out of the current range in the coming weeks.