


Content of this chapter:
What are Support & Resistance Levels
Formation Principles
How to Determine the Direction
How to Use Major Contracts to Improve Judgment Accuracy
Today, let's talk about a phenomenon frequently observed in the cryptocurrency space.
Recall that when we look at the price trend of a stock, do we often find a pattern: for a period of time, such as several weeks or months, the stock price seems to always hover around a specific price level? The highs are almost at one position before descending, and the lows always bounce back near a certain price level?
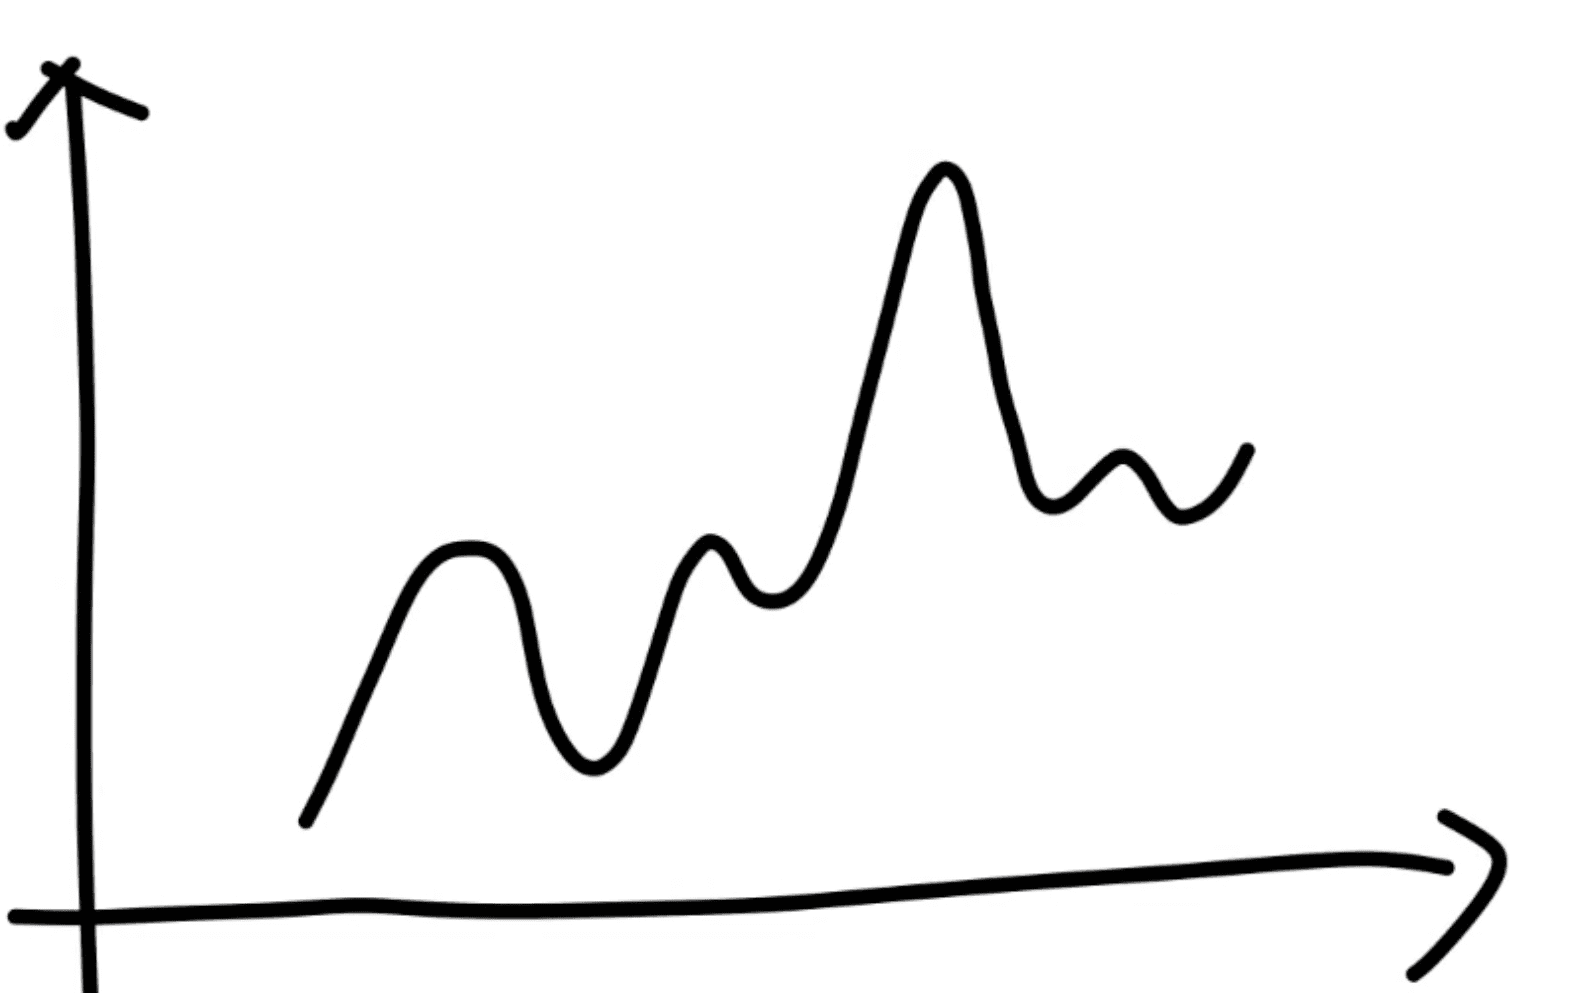
This is what we often refer to as "resistance levels" and "support levels."
In simple terms:
"Resistance level" is like a ceiling; once the stock price reaches this point, it can never go higher.
"Support level" is like a floor; when the stock price drops to this point, it always bounces back.
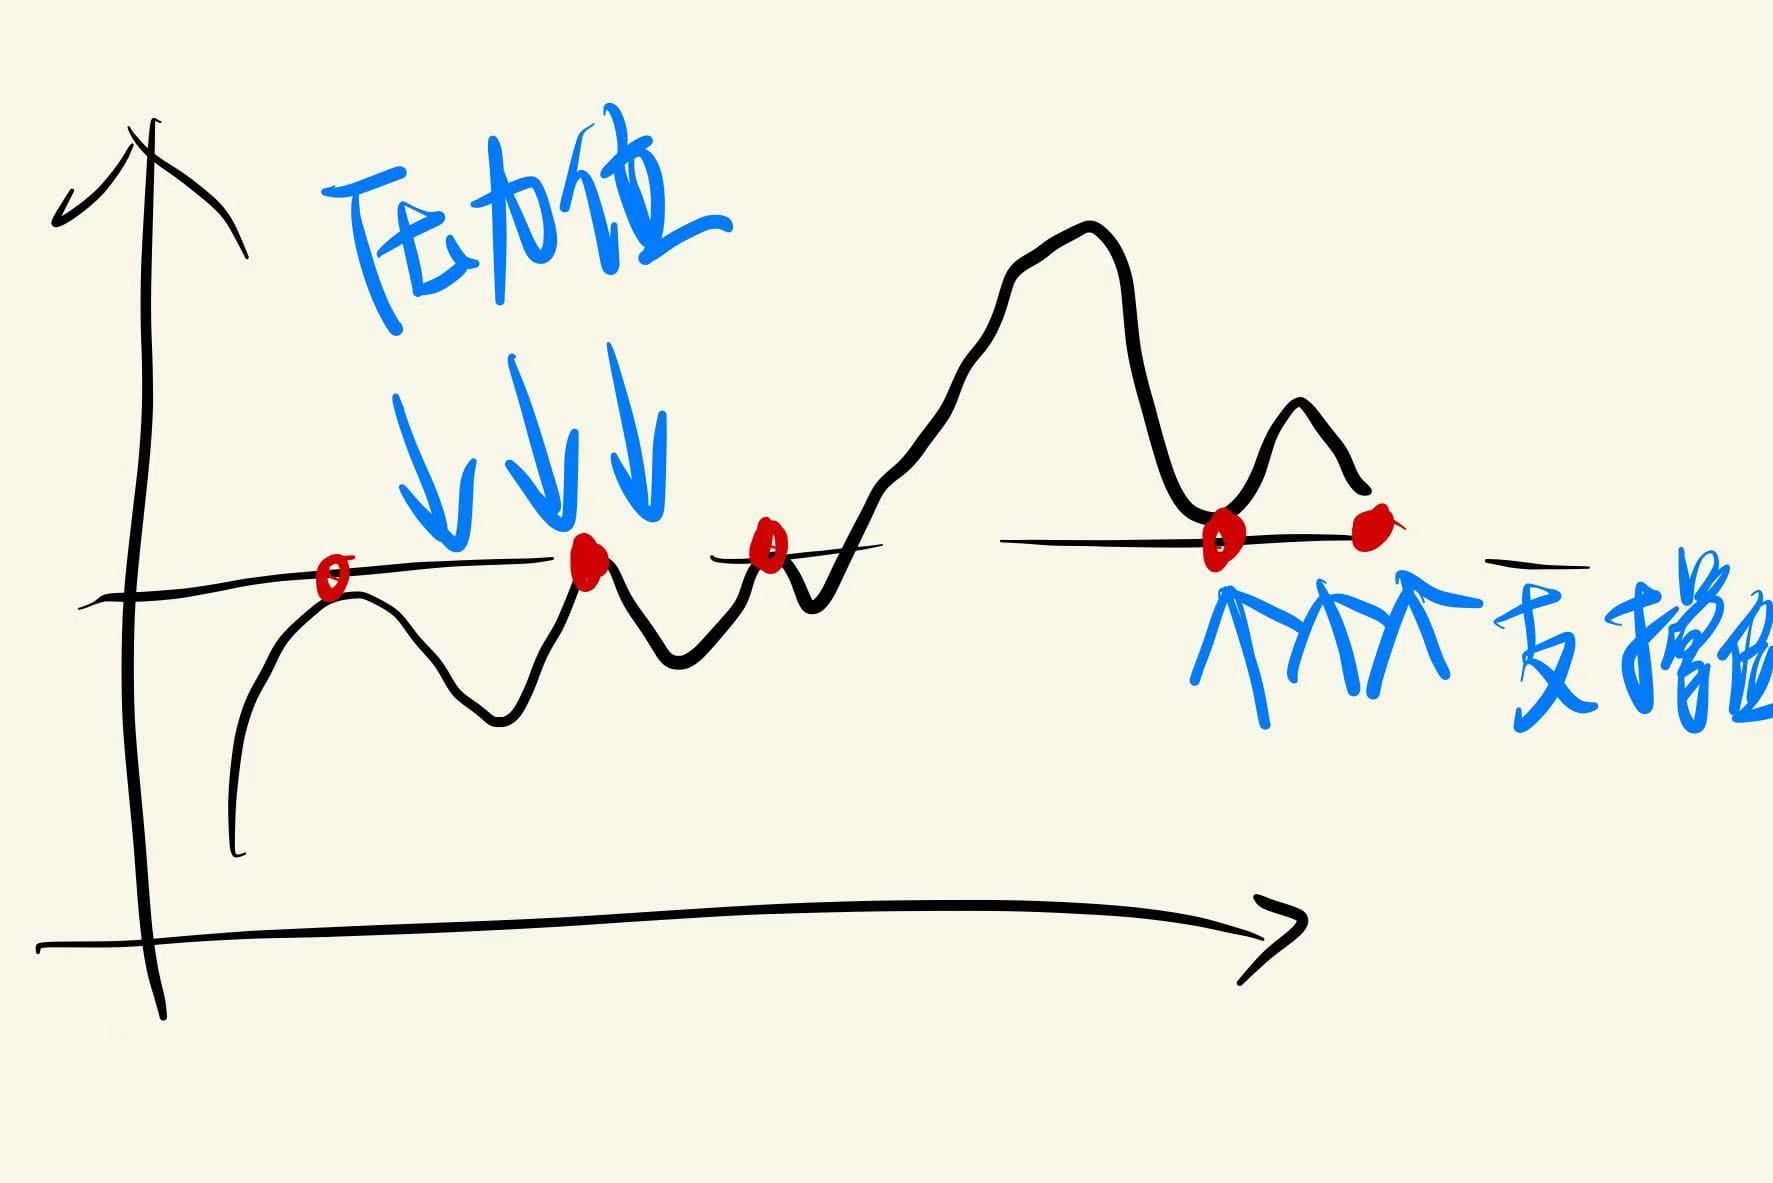
Many people believe that:
Once the price breaks through the resistance level, it is a bullish signal. And once the stock price drops below the support level, it is a bearish signal. The broken resistance level will become a new support level, and the breached support level will become a new resistance level.
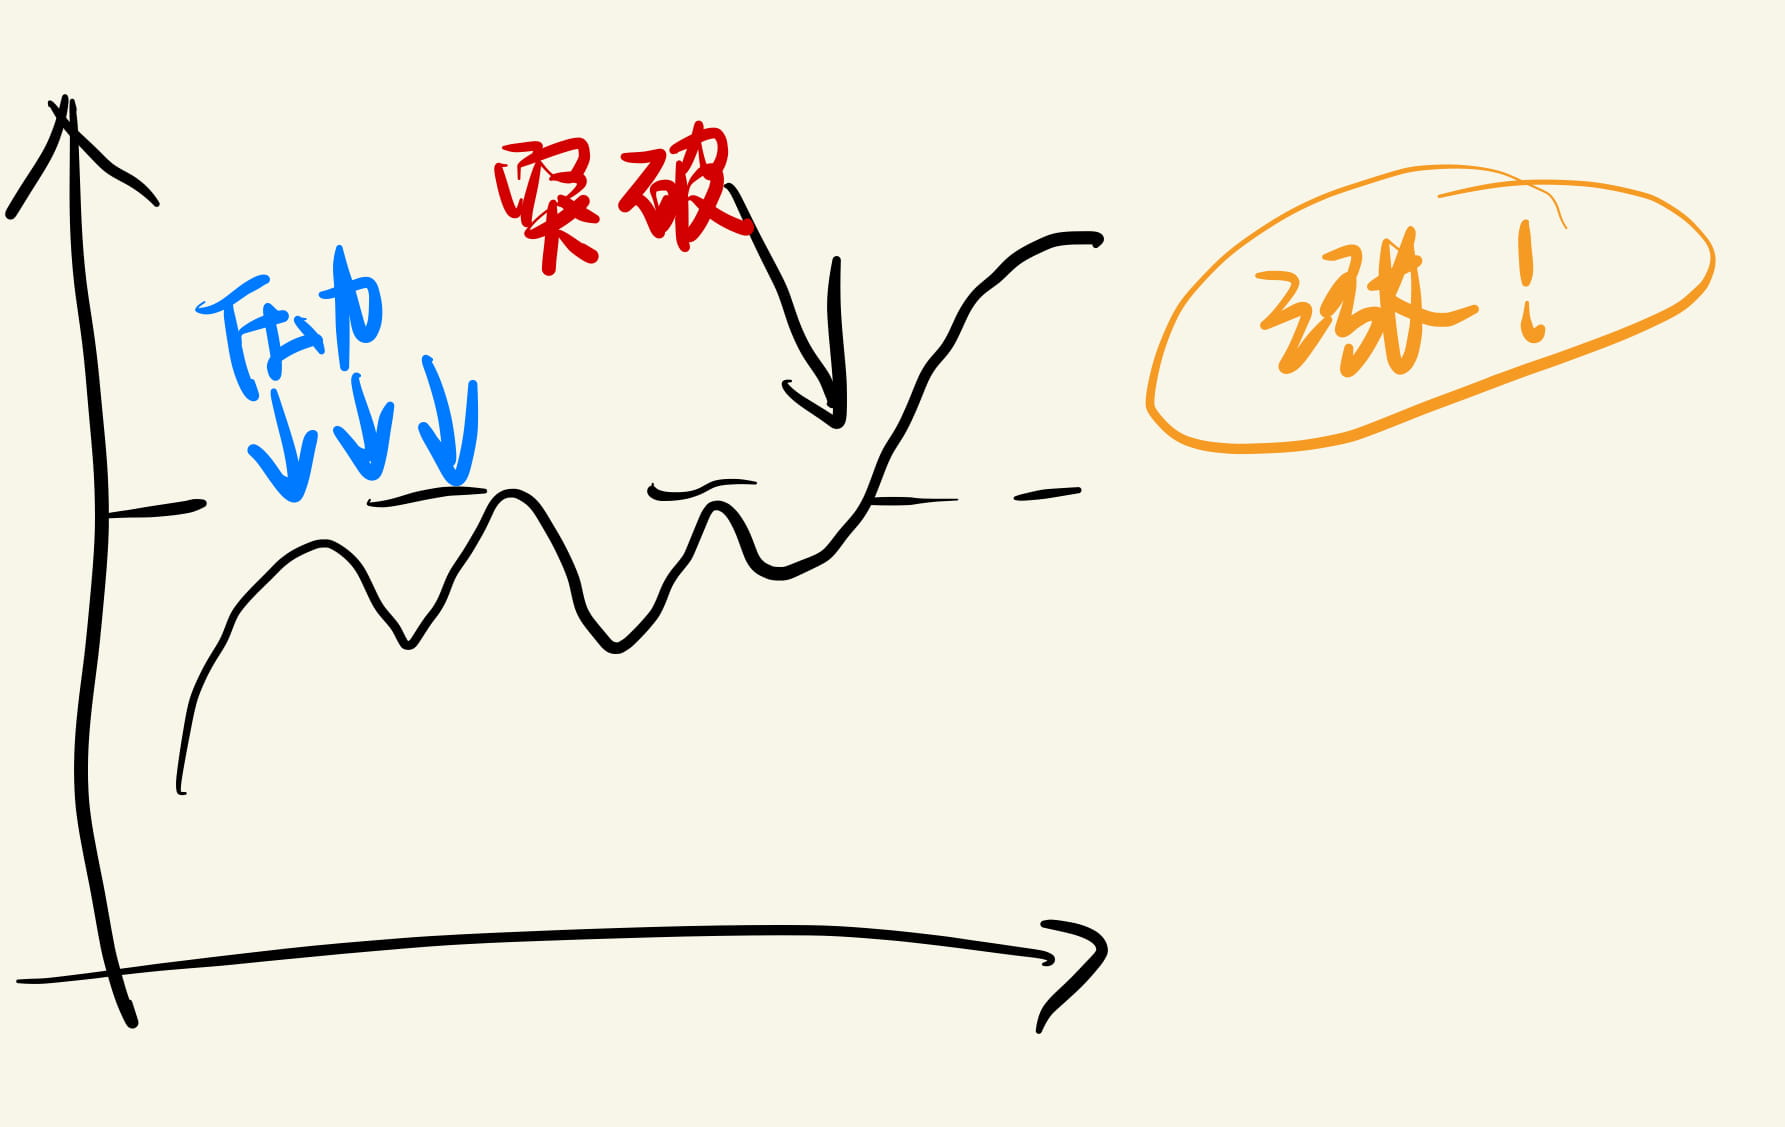
What are the principles behind these patterns??? Let's first take a look at how resistance and support levels are formed.
Part One: The Formation of Resistance Levels
Mr. A bought a large amount of punt spot at the stock price of 1.04u, and he found that there were many buyers for prices between 1.04 and 1.09. So Mr. A raised the price, and the stock price gradually increased from the initial 1.04 to 1.09. When Mr. A listed at 1.09, there were still buyers, but not as many as before. When he continued to raise the price to 1.1, he found that there were no customers left because other merchants were still selling at 1.09, which was cheaper, and buyers chose the cheaper channel.
So why did so many sellers suddenly emerge to grab business around the price of 1.09?
The reasons may include the following:
Disbelieving the breakout: Some people see that the highest point of this stock in the last phase was 1.09 and don’t really believe it can exceed this time, so they take the opportunity to sell more.
Regret selling: Some people had the opportunity to sell when it last reached 1.09 but didn’t, and they have regretted it ever since. Now that it has finally returned to the previous price, they decisively sell.
Break-even psychology: Some people bought at the price level of 1.09 last time. After they bought, they realized they had paid too much and fell into a loss state, deeply regretting it. Now they can finally break even, so they decisively sell.
Short-selling behavior: Some people think that since the price cannot exceed 1.09, they begin to short-sell, which means borrowing a lot of stocks to sell at 1.09, thinking they can buy back at a lower price later and profit from the difference.
Mr. A discovered his business was being taken, so he lowered the price further. Everyone rushed to lower prices. Thus, everyone scrambled to sell and pressured prices down.
Part Two: The Formation of Support Levels
During the continuous price decline, the number of sellers competing to lower prices decreased because everyone would incur losses if prices fell further. And when the price dropped to around 1.04, suddenly a large influx of buyers rushed in to buy.
Why did these buyers suddenly appear?
Bottom-fishing psychology: Some people see that the previous lowest price was around this level and think it won't go lower, so they hurry to buy.
Regret missing out: Some people had the opportunity to buy at 1.04 last time but didn’t, and they only regretted it after missing the chance. Now they finally have another opportunity in front of them, so they hurry to buy.
Low Price Buyback: There are still some people who sold at this price level last time, and as soon as they sold, the price skyrocketed, resulting in their deep regret. Now, there is finally another opportunity to buy at a low price in front of them, so they quickly buy in.
Due to a decrease in sellers and a sudden increase in buyers, the stock price has started to recover around 1.04.
In this way, the price oscillates back and forth between pressure and support, and we call this sustained phenomenon over a period of time a range-bound fluctuation.
Overall, the underlying logic of the emergence of this pressure and support is group psychology. It is also a consistency behavior, and interestingly, the more people discover this pattern, the more solid the formation of pressure and support becomes.
How are the resistance and support levels broken?
The price cannot keep oscillating back and forth in this range forever; what events could cause a breakout?
Positive news about cryptocurrencies spreads, attracting many people to buy. (For example, a popular punt)
Large funds entering the market, such as major institutions coming in
It's like two people arm wrestling, originally evenly matched, where the resistance and support levels are the boundaries of their strength balance. Once one side receives external assistance, or one side suddenly weakens, this dynamic balance is broken, and the price will break through the resistance or support level.
This balance being broken is also seen as an important signal:
Breaking the resistance level: Many people will consider it a bullish signal because breaking the resistance level will disrupt many people's psychological expectations, leading more people to follow and purchase. Those who originally shorted may worry about being unable to return stocks if the price continues to rise, so they hurry to buy back to stop losses. This behavior is called short covering and will also drive the price to continue to rise.
Breaking the support level: Similarly, if the support level is breached, it is also considered a bearish signal.
Good news is difficult to know in advance. However, we can further judge breakouts by mastering the timing of capital inflows.
In the cryptocurrency space, we can see the inflow & outflow of institutional funds on Binance to make rough judgments. But the issue is that institutions want to pursue better profits with less money, which leads to the use of contracts. We can judge the direction in which institutions are preparing to break through based on the direction of contract openings.
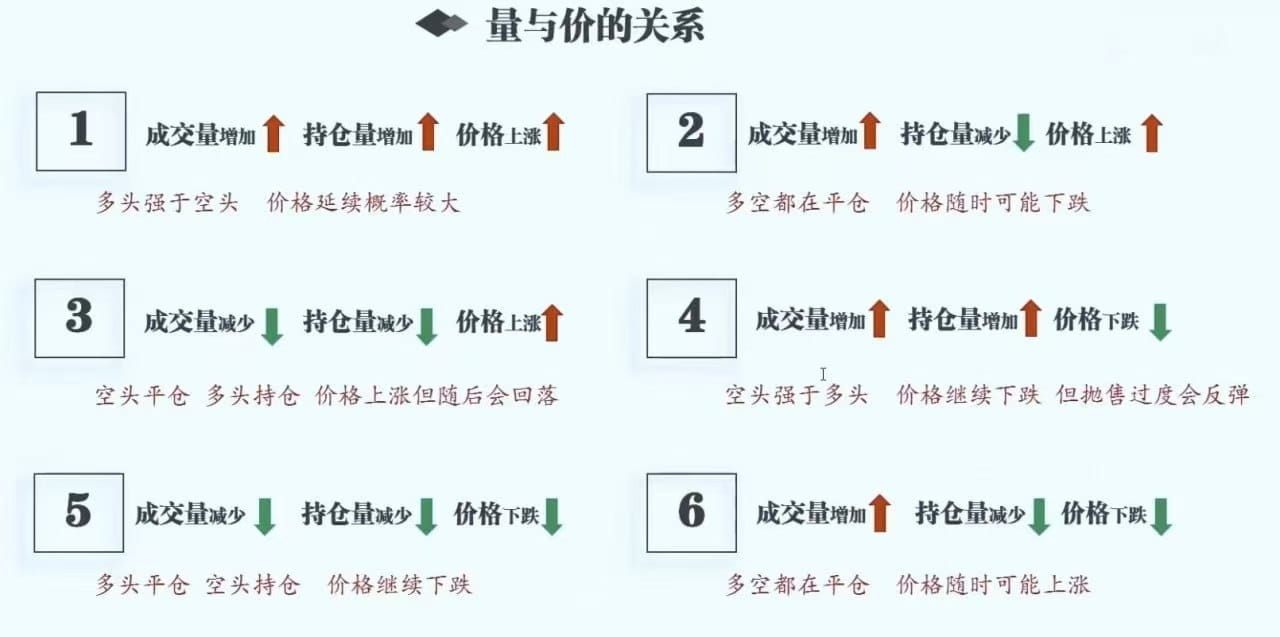
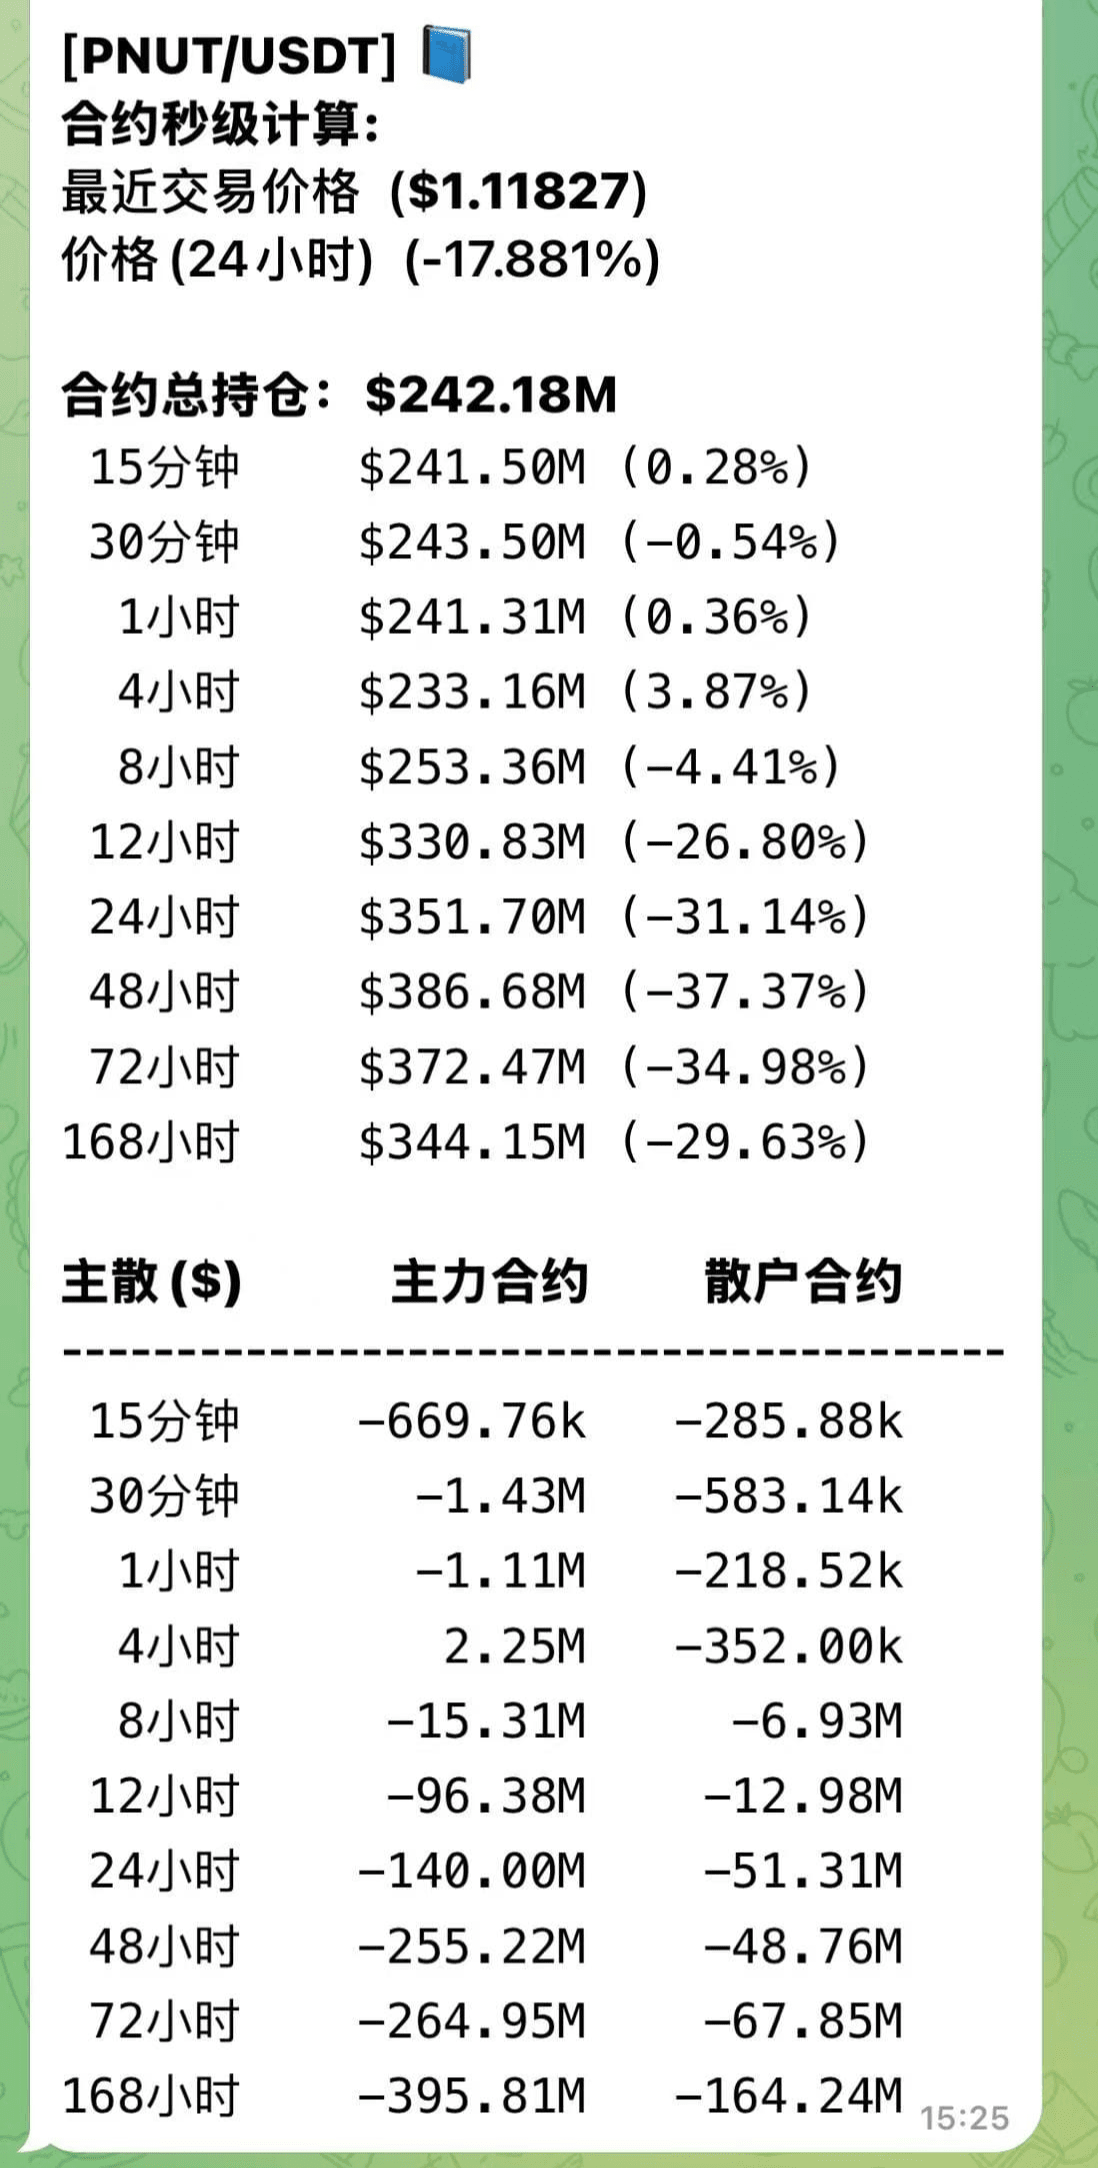
In the end, resistance and support levels are just one of the indicators when looking at candlestick charts. We also need to combine more indicators to see through market trends, rather than relying solely on one indicator. When multiple indicators align in one direction, the probability significantly increases. Regarding resistance and support levels, major institutions sometimes use reverse operations to create false breakouts. The most important thing for us is to manage our investment portfolio well!
Follow me to learn more tips.