

OG GrAcE
14 Beiträge

OG GrAcE
Melden
Nutzer blockieren
OG GrAcE 💰📊🤲
Trade eröffnen
Regelmäßiger Trader
3.5 Jahre
35 Following
34 Follower
44 Like gegeben
Beiträge
Portfolio
Alle
Zitierungen
PINNED
·
--
Artikel
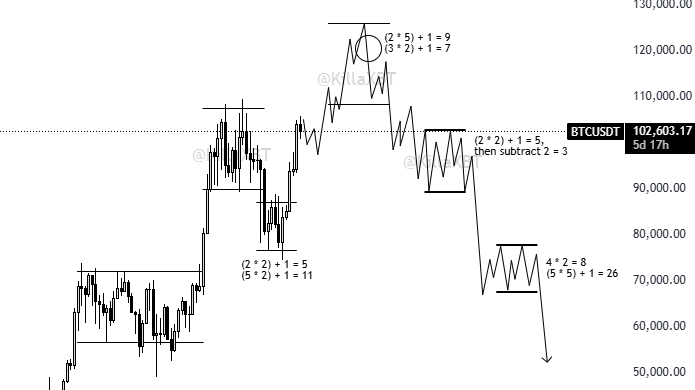
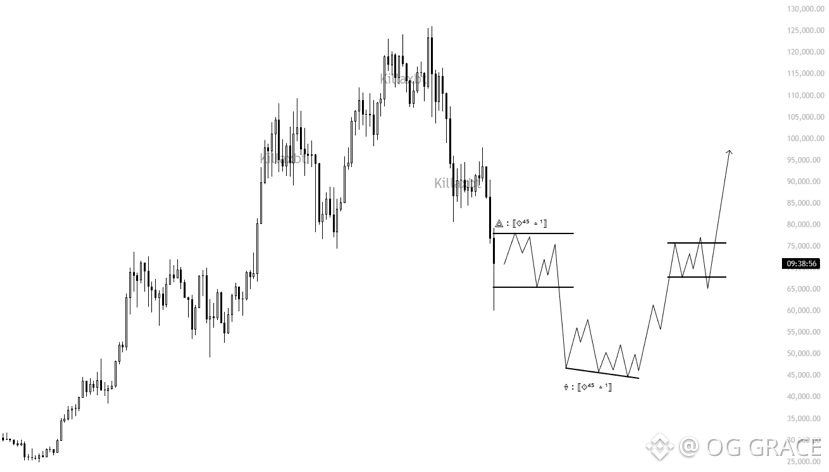
BTC Strukturzerlegung - Warum der Rückgang nicht zufällig wäreViele Menschen denken, dass Bitcoin einfach "aus dem Nichts" fällt, aber wenn man die Struktur wirklich studiert, beginnt man, wiederkehrende Muster zu sehen.
Dieses Diagramm ist ein gutes Beispiel dafür.
BTC ist nicht einfach gefallen - es hat zuerst Distribution aufgebaut.
Nach einem starken Anstieg begann der Preis, Folgendes zu bilden:
Bereichshochs
Fehlgeschlagene Ausbrüche
Kompression am Widerstand
Das ist normalerweise der Punkt, an dem kluge Anleger verkaufen, nicht wo sie kaufen.
Sobald dieser Bereich gescheitert ist, war die Abwärtsbewegung nicht emotional - sie war mechanisch.
Man kann sehen, wie der Preis:
Konsolidiert
BTC Strukturzerlegung - Warum der Rückgang nicht zufällig wäre
Viele Menschen denken, dass Bitcoin einfach "aus dem Nichts" fällt, aber wenn man die Struktur wirklich studiert, beginnt man, wiederkehrende Muster zu sehen.
Dieses Diagramm ist ein gutes Beispiel dafür.
BTC ist nicht einfach gefallen - es hat zuerst Distribution aufgebaut.
Nach einem starken Anstieg begann der Preis, Folgendes zu bilden:
Bereichshochs
Fehlgeschlagene Ausbrüche
Kompression am Widerstand
Das ist normalerweise der Punkt, an dem kluge Anleger verkaufen, nicht wo sie kaufen.
Sobald dieser Bereich gescheitert ist, war die Abwärtsbewegung nicht emotional - sie war mechanisch.
Man kann sehen, wie der Preis:
Konsolidiert
Dieses Diagramm ist ein gutes Beispiel dafür.
BTC ist nicht einfach gefallen - es hat zuerst Distribution aufgebaut.
Nach einem starken Anstieg begann der Preis, Folgendes zu bilden:
Bereichshochs
Fehlgeschlagene Ausbrüche
Kompression am Widerstand
Das ist normalerweise der Punkt, an dem kluge Anleger verkaufen, nicht wo sie kaufen.
Sobald dieser Bereich gescheitert ist, war die Abwärtsbewegung nicht emotional - sie war mechanisch.
Man kann sehen, wie der Preis:
Konsolidiert
1
3
224
·
--
Gut gesagt
Gut gesagt


CRYPTO MECHANIC
·
--
Jemand mit viel Geld wird liquidiert.
Jemand mit weniger Geld wird liquidiert.
Jemand mit jahrelanger Erfahrung wird erwischt.
Jemand, der gerade erst angefangen hat, wird erwischt.
Jemand mit viel Wissen kann den Leverage vermasseln.
Jemand kann die Positionsgröße vermasseln.
Jemand kann das Risikomanagement ignorieren.
Jemand kann übertraden.
Jemand kann zu emotional werden.
Jemand kann nach ein paar Gewinnen übermütig werden.
Jemand kann nach ein paar Verlusten in Panik geraten.
Jemand kann sich weigern zu akzeptieren, dass er falsch liegt.
Jemand kann weiter in eine verlierende Position „hineinaveragen“.
Jemand kann jedem Pump hinterherlaufen.
Der Markt hat unglaubliche Möglichkeiten, alle zu bestrafen.
Er kümmert sich nicht darum, wer du bist.
Respektiere das Risiko, oder der Markt wird es dir beibringen.
Jemand mit weniger Geld wird liquidiert.
Jemand mit jahrelanger Erfahrung wird erwischt.
Jemand, der gerade erst angefangen hat, wird erwischt.
Jemand mit viel Wissen kann den Leverage vermasseln.
Jemand kann die Positionsgröße vermasseln.
Jemand kann das Risikomanagement ignorieren.
Jemand kann übertraden.
Jemand kann zu emotional werden.
Jemand kann nach ein paar Gewinnen übermütig werden.
Jemand kann nach ein paar Verlusten in Panik geraten.
Jemand kann sich weigern zu akzeptieren, dass er falsch liegt.
Jemand kann weiter in eine verlierende Position „hineinaveragen“.
Jemand kann jedem Pump hinterherlaufen.
Der Markt hat unglaubliche Möglichkeiten, alle zu bestrafen.
Er kümmert sich nicht darum, wer du bist.
Respektiere das Risiko, oder der Markt wird es dir beibringen.
10
·
--
BTC ist nicht schwach — es tut einfach nur, was Bitcoin immer tut
Viele Menschen nennen Bitcoin gerade "schwach", aber das ist größtenteils Emotion, nicht Preisbewegung.
Wenn man einen Schritt zurücktritt und das Diagramm tatsächlich liest, bricht BTC nicht zusammen — es kühlt sich ab.
Diese Art von Bewegung hat sich viele Male vor großen Expansionen gezeigt.
Was der Preis wirklich tut
Bitcoin hatte einen starken Anstieg. Danach wurde ein Rückgang erwartet.
Was zählt, ist Folgendes:
• Der Preis hält immer noch wichtige Unterstützung
• Es gibt keinen aggressiven Verkaufsdruck
• Jeder Rückgang wird leise absorbiert
Das ist keine Angst. Das ist Balance.
Warum diese Phase die Menschen verwirrt
Das ist die Phase, in der:
• Bullen ungeduldig werden
• Bären einen Crash erwarten, der nie kommt
• Übermäßige Händler abgeschnitten werden
Bitcoin verlangsamt sich hier absichtlich.
Es schüttelt schwache Hände aus, bevor es die Richtung entscheidet.
Momentum-Check
RSI schreit nicht überverkauft oder überhitzt.
MACD flacht ab, beschleunigt nicht.
Das Volumen schwindet, explodiert nicht.
Alle Zeichen deuten auf eine Pause hin, nicht auf Panik.
Was ich persönlich beobachte
Solange BTC seine wichtige Unterstützungszone hält, mache ich mir keine Sorgen.
Einen echten Rückgang mit echtem Volumen?
Dann werde ich neu bewerten.
Bis dahin ist dies nur Bitcoin, das sich vor seinem nächsten Schritt zurücksetzt.
Zusammenfassung
Bitcoin bewegt sich nicht, um für jeden Sinn zu ergeben.
Es bewegt sich, um Geduld zu belohnen.
Wenn Sie mit Emotionen handeln, tut diese Phase weh.
Wenn Sie mit Struktur handeln, macht diese Phase Sinn.
Bleiben Sie scharf. Kapital schützen. Lassen Sie den Preis sprechen.
{future}(BTCUSDT)
BTC ist nicht schwach — es tut einfach nur, was Bitcoin immer tut
Viele Menschen nennen Bitcoin gerade "schwach", aber das ist größtenteils Emotion, nicht Preisbewegung.
Wenn man einen Schritt zurücktritt und das Diagramm tatsächlich liest, bricht BTC nicht zusammen — es kühlt sich ab.
Diese Art von Bewegung hat sich viele Male vor großen Expansionen gezeigt.
Was der Preis wirklich tut
Bitcoin hatte einen starken Anstieg. Danach wurde ein Rückgang erwartet.
Was zählt, ist Folgendes:
• Der Preis hält immer noch wichtige Unterstützung
• Es gibt keinen aggressiven Verkaufsdruck
• Jeder Rückgang wird leise absorbiert
Das ist keine Angst. Das ist Balance.
Warum diese Phase die Menschen verwirrt
Das ist die Phase, in der:
• Bullen ungeduldig werden
• Bären einen Crash erwarten, der nie kommt
• Übermäßige Händler abgeschnitten werden
Bitcoin verlangsamt sich hier absichtlich.
Es schüttelt schwache Hände aus, bevor es die Richtung entscheidet.
Momentum-Check
RSI schreit nicht überverkauft oder überhitzt.
MACD flacht ab, beschleunigt nicht.
Das Volumen schwindet, explodiert nicht.
Alle Zeichen deuten auf eine Pause hin, nicht auf Panik.
Was ich persönlich beobachte
Solange BTC seine wichtige Unterstützungszone hält, mache ich mir keine Sorgen.
Einen echten Rückgang mit echtem Volumen?
Dann werde ich neu bewerten.
Bis dahin ist dies nur Bitcoin, das sich vor seinem nächsten Schritt zurücksetzt.
Zusammenfassung
Bitcoin bewegt sich nicht, um für jeden Sinn zu ergeben.
Es bewegt sich, um Geduld zu belohnen.
Wenn Sie mit Emotionen handeln, tut diese Phase weh.
Wenn Sie mit Struktur handeln, macht diese Phase Sinn.
Bleiben Sie scharf. Kapital schützen. Lassen Sie den Preis sprechen.
Viele Menschen nennen Bitcoin gerade "schwach", aber das ist größtenteils Emotion, nicht Preisbewegung.
Wenn man einen Schritt zurücktritt und das Diagramm tatsächlich liest, bricht BTC nicht zusammen — es kühlt sich ab.
Diese Art von Bewegung hat sich viele Male vor großen Expansionen gezeigt.
Was der Preis wirklich tut
Bitcoin hatte einen starken Anstieg. Danach wurde ein Rückgang erwartet.
Was zählt, ist Folgendes:
• Der Preis hält immer noch wichtige Unterstützung
• Es gibt keinen aggressiven Verkaufsdruck
• Jeder Rückgang wird leise absorbiert
Das ist keine Angst. Das ist Balance.
Warum diese Phase die Menschen verwirrt
Das ist die Phase, in der:
• Bullen ungeduldig werden
• Bären einen Crash erwarten, der nie kommt
• Übermäßige Händler abgeschnitten werden
Bitcoin verlangsamt sich hier absichtlich.
Es schüttelt schwache Hände aus, bevor es die Richtung entscheidet.
Momentum-Check
RSI schreit nicht überverkauft oder überhitzt.
MACD flacht ab, beschleunigt nicht.
Das Volumen schwindet, explodiert nicht.
Alle Zeichen deuten auf eine Pause hin, nicht auf Panik.
Was ich persönlich beobachte
Solange BTC seine wichtige Unterstützungszone hält, mache ich mir keine Sorgen.
Einen echten Rückgang mit echtem Volumen?
Dann werde ich neu bewerten.
Bis dahin ist dies nur Bitcoin, das sich vor seinem nächsten Schritt zurücksetzt.
Zusammenfassung
Bitcoin bewegt sich nicht, um für jeden Sinn zu ergeben.
Es bewegt sich, um Geduld zu belohnen.
Wenn Sie mit Emotionen handeln, tut diese Phase weh.
Wenn Sie mit Struktur handeln, macht diese Phase Sinn.
Bleiben Sie scharf. Kapital schützen. Lassen Sie den Preis sprechen.
1
131
·
--
SOL/USDT: Der Kurs ist schwach, aber „Smart Money“ beobachtet diese Zone genau
Solana (SOL) wird derzeit um $83 auf dem 4H-Zeitrahmen gehandelt. Auch wenn der Chart auf den ersten Blick bärisch wirkt, erzählt die tiefere Struktur eine deutlich spannendere Geschichte.
Das ist die Art von Zone, in der Ungeduld bestraft und Disziplin belohnt wird.
⸻
Marktstruktur: Kontrollierter Abverkauf, keine Kapitulation
SOL befindet sich weiterhin in einem kurzfristigen Abwärtstrend und handelt unter wichtigen gleitenden Durchschnitten. Der Verkaufsdruck ist jedoch geordnet, nicht aggressiv.
• Keine Panikkerzen mit hohem Volumen
• Keine lange bärische Ausdehnung
• Der Kurs komprimiert sich nahe dem Support
Das deutet oft auf Distribution → Stabilisierung hin, nicht auf einen unmittelbaren Breakdown.
⸻
Kritische Support-Zone: $81–$82
Der Kurs hat zuletzt den Bereich um $81.8 verteidigt, der nun als Entscheidungsebene gilt.
• Wenn der Kurs oberhalb dieser Zone bleibt, bleibt SOL in einer Range-Formation
• Ein Breakdown unter $81 mit Volumen öffnet die Tür zu $76–$74
Bis dahin verlieren die Bären an Momentum — sie gewinnen nicht schneller.
⸻
Indikator-Übereinstimmung
RSI (4H):
• Liegt bei etwa 38–40
• Historisch konsolidiert SOL in diesem RSI-Bereich häufig oder prallt davon ab
MACD:
• Bärisch, aber flacht ab
• Das Momentum verlangsamt sich — ein typisches Vorzeichen für Seitwärtsbewegungen
Volumen:
• Rückläufiges Verkaufsvolumen = Verkaufserschöpfung
• Märkte pausieren meist, bevor sie sich für eine Richtung entscheiden
⸻
Was passieren muss, damit Stärke zurückkehrt
Damit SOL auf dem 4H-Zeitrahmen bullisch drehen kann:
• $85 zurückerobern
• Über $88 halten
• Mit Volumen die Struktur brechen
Bis dahin sind Rallyes eher Erholungsbewegungen — keine Trendwenden.
⸻
Das ist keine FOMO-Zone.
Das ist eine Zone für Positionierung und Geduld.
Erfahrene Trader warten auf Bestätigung.
Langfristige Investoren achten auf den Support — nicht auf Emotionen.
Der Chart fordert dich nicht auf, dich zu beeilen — er fordert dich auf, nachzudenken.
📉📈 Trade klug. Schütze dein Kapital.
SOL/USDT: Der Kurs ist schwach, aber „Smart Money“ beobachtet diese Zone genau
Solana (SOL) wird derzeit um $83 auf dem 4H-Zeitrahmen gehandelt. Auch wenn der Chart auf den ersten Blick bärisch wirkt, erzählt die tiefere Struktur eine deutlich spannendere Geschichte.
Das ist die Art von Zone, in der Ungeduld bestraft und Disziplin belohnt wird.
⸻
Marktstruktur: Kontrollierter Abverkauf, keine Kapitulation
SOL befindet sich weiterhin in einem kurzfristigen Abwärtstrend und handelt unter wichtigen gleitenden Durchschnitten. Der Verkaufsdruck ist jedoch geordnet, nicht aggressiv.
• Keine Panikkerzen mit hohem Volumen
• Keine lange bärische Ausdehnung
• Der Kurs komprimiert sich nahe dem Support
Das deutet oft auf Distribution → Stabilisierung hin, nicht auf einen unmittelbaren Breakdown.
⸻
Kritische Support-Zone: $81–$82
Der Kurs hat zuletzt den Bereich um $81.8 verteidigt, der nun als Entscheidungsebene gilt.
• Wenn der Kurs oberhalb dieser Zone bleibt, bleibt SOL in einer Range-Formation
• Ein Breakdown unter $81 mit Volumen öffnet die Tür zu $76–$74
Bis dahin verlieren die Bären an Momentum — sie gewinnen nicht schneller.
⸻
Indikator-Übereinstimmung
RSI (4H):
• Liegt bei etwa 38–40
• Historisch konsolidiert SOL in diesem RSI-Bereich häufig oder prallt davon ab
MACD:
• Bärisch, aber flacht ab
• Das Momentum verlangsamt sich — ein typisches Vorzeichen für Seitwärtsbewegungen
Volumen:
• Rückläufiges Verkaufsvolumen = Verkaufserschöpfung
• Märkte pausieren meist, bevor sie sich für eine Richtung entscheiden
⸻
Was passieren muss, damit Stärke zurückkehrt
Damit SOL auf dem 4H-Zeitrahmen bullisch drehen kann:
• $85 zurückerobern
• Über $88 halten
• Mit Volumen die Struktur brechen
Bis dahin sind Rallyes eher Erholungsbewegungen — keine Trendwenden.
⸻
Das ist keine FOMO-Zone.
Das ist eine Zone für Positionierung und Geduld.
Erfahrene Trader warten auf Bestätigung.
Langfristige Investoren achten auf den Support — nicht auf Emotionen.
Der Chart fordert dich nicht auf, dich zu beeilen — er fordert dich auf, nachzudenken.
📉📈 Trade klug. Schütze dein Kapital.
Solana (SOL) wird derzeit um $83 auf dem 4H-Zeitrahmen gehandelt. Auch wenn der Chart auf den ersten Blick bärisch wirkt, erzählt die tiefere Struktur eine deutlich spannendere Geschichte.
Das ist die Art von Zone, in der Ungeduld bestraft und Disziplin belohnt wird.
⸻
Marktstruktur: Kontrollierter Abverkauf, keine Kapitulation
SOL befindet sich weiterhin in einem kurzfristigen Abwärtstrend und handelt unter wichtigen gleitenden Durchschnitten. Der Verkaufsdruck ist jedoch geordnet, nicht aggressiv.
• Keine Panikkerzen mit hohem Volumen
• Keine lange bärische Ausdehnung
• Der Kurs komprimiert sich nahe dem Support
Das deutet oft auf Distribution → Stabilisierung hin, nicht auf einen unmittelbaren Breakdown.
⸻
Kritische Support-Zone: $81–$82
Der Kurs hat zuletzt den Bereich um $81.8 verteidigt, der nun als Entscheidungsebene gilt.
• Wenn der Kurs oberhalb dieser Zone bleibt, bleibt SOL in einer Range-Formation
• Ein Breakdown unter $81 mit Volumen öffnet die Tür zu $76–$74
Bis dahin verlieren die Bären an Momentum — sie gewinnen nicht schneller.
⸻
Indikator-Übereinstimmung
RSI (4H):
• Liegt bei etwa 38–40
• Historisch konsolidiert SOL in diesem RSI-Bereich häufig oder prallt davon ab
MACD:
• Bärisch, aber flacht ab
• Das Momentum verlangsamt sich — ein typisches Vorzeichen für Seitwärtsbewegungen
Volumen:
• Rückläufiges Verkaufsvolumen = Verkaufserschöpfung
• Märkte pausieren meist, bevor sie sich für eine Richtung entscheiden
⸻
Was passieren muss, damit Stärke zurückkehrt
Damit SOL auf dem 4H-Zeitrahmen bullisch drehen kann:
• $85 zurückerobern
• Über $88 halten
• Mit Volumen die Struktur brechen
Bis dahin sind Rallyes eher Erholungsbewegungen — keine Trendwenden.
⸻
Das ist keine FOMO-Zone.
Das ist eine Zone für Positionierung und Geduld.
Erfahrene Trader warten auf Bestätigung.
Langfristige Investoren achten auf den Support — nicht auf Emotionen.
Der Chart fordert dich nicht auf, dich zu beeilen — er fordert dich auf, nachzudenken.
📉📈 Trade klug. Schütze dein Kapital.
OG GrAcE
·
--
SOL/USDT 4H-Chartanalyse: Findet Solana wieder Halt oder steht ein weiterer Rückgang bevor?
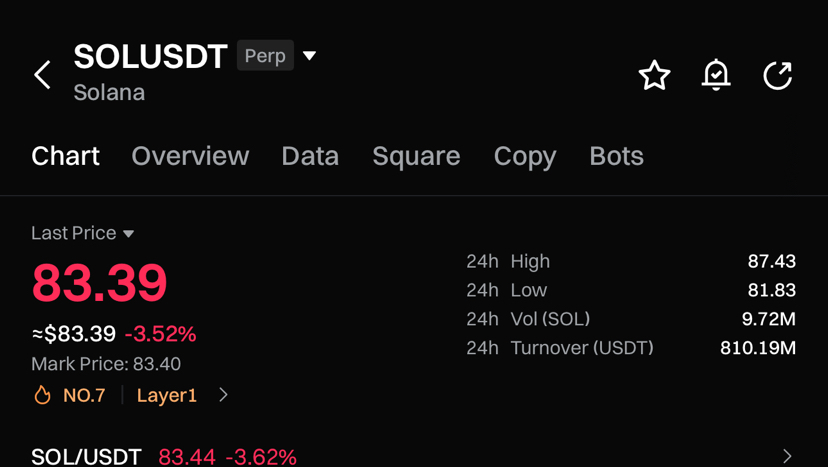
Solana (SOL) wird derzeit bei etwa 83 US-Dollar gehandelt, ist um über 3% gefallen, und der 4-Stunden-Chart erzählt eine wichtige Geschichte, die Trader und Investoren nicht ignorieren sollten.
Statt zu raten, schauen wir uns an, was die Kursbewegung, die Indikatoren und die Struktur ganz klar zeigen.
1. Marktstruktur: Steht weiterhin unter Druck
Im 4-Stunden-Zeitrahmen bleibt SOL in einem kurzfristigen Abwärtstrend.
Der Kurs handelt unter wichtigen gleitenden Durchschnitten (EMA 20, EMA 50 und MA 100/200).
Jede Erholung wird verkauft, wodurch niedrigere Hochs entstehen.
Das bestätigt, dass die Bären vorerst weiterhin die Kontrolle haben.
Statt zu raten, schauen wir uns an, was die Kursbewegung, die Indikatoren und die Struktur ganz klar zeigen.
1. Marktstruktur: Steht weiterhin unter Druck
Im 4-Stunden-Zeitrahmen bleibt SOL in einem kurzfristigen Abwärtstrend.
Der Kurs handelt unter wichtigen gleitenden Durchschnitten (EMA 20, EMA 50 und MA 100/200).
Jede Erholung wird verkauft, wodurch niedrigere Hochs entstehen.
Das bestätigt, dass die Bären vorerst weiterhin die Kontrolle haben.
1
93
·
--
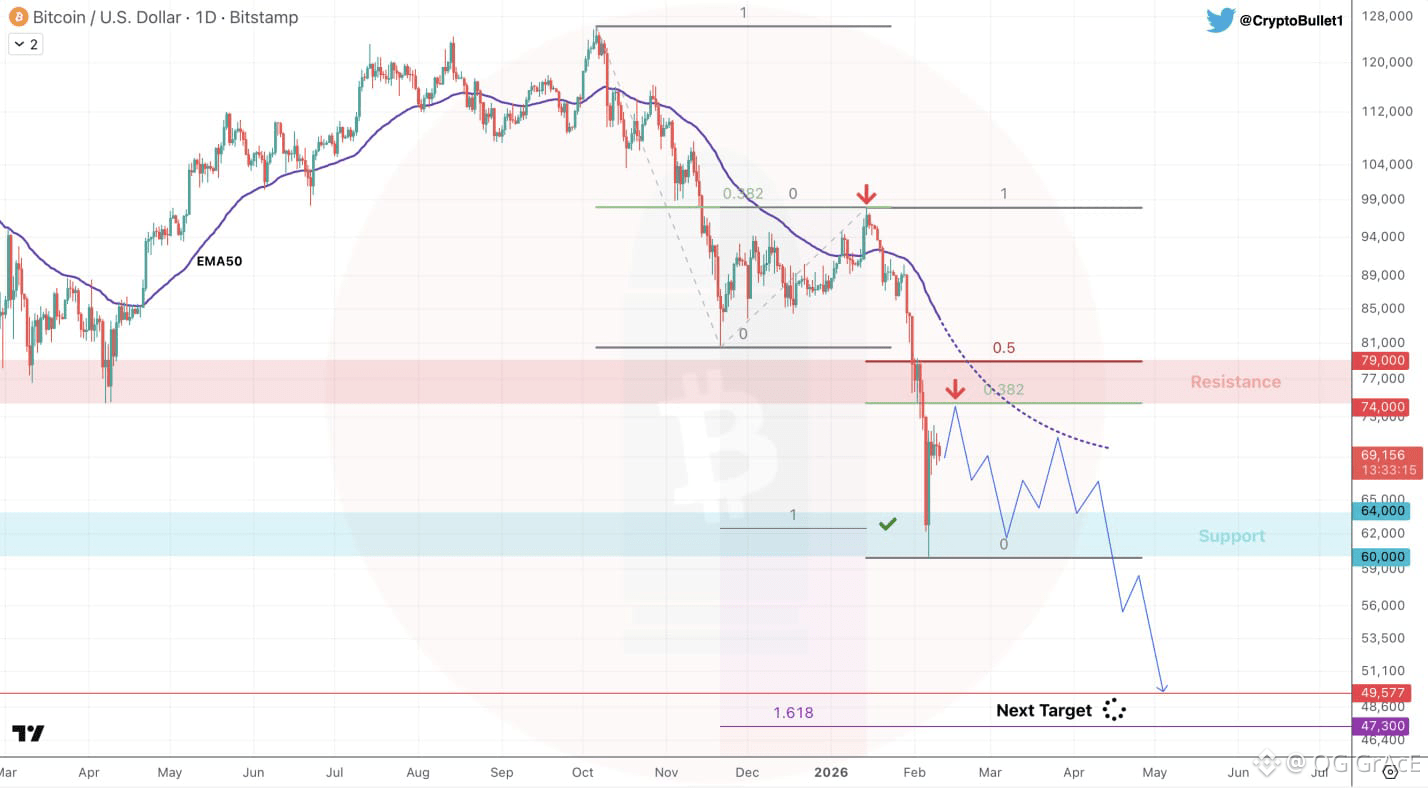
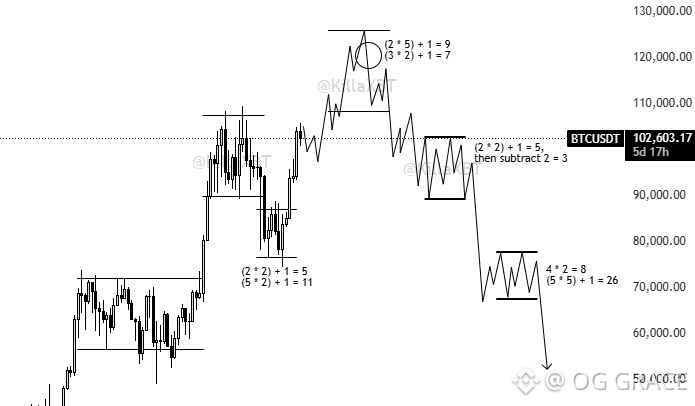
$BTC 1D-Chart | Strategie für die nächsten 2 Monate
Widerstand: $74-79k
Support: $60-64k
Ich denke, wir werden etwas Zeit zwischen diesen Kursbereichen verbringen, bevor der unvermeidliche Ausbruch nach unten kommt 📉
$BTC 1D-Chart | Strategie für die nächsten 2 Monate
Widerstand: $74-79k
Support: $60-64k
Ich denke, wir werden etwas Zeit zwischen diesen Kursbereichen verbringen, bevor der unvermeidliche Ausbruch nach unten kommt 📉
Widerstand: $74-79k
Support: $60-64k
Ich denke, wir werden etwas Zeit zwischen diesen Kursbereichen verbringen, bevor der unvermeidliche Ausbruch nach unten kommt 📉
2
107
·
--
Artikel
SOL/USDT 4H-Chartanalyse: Findet Solana wieder Halt oder steht ein weiterer Rückgang bevor?Solana (SOL) wird derzeit bei etwa 83 US-Dollar gehandelt, ist um über 3% gefallen, und der 4-Stunden-Chart erzählt eine wichtige Geschichte, die Trader und Investoren nicht ignorieren sollten.
Statt zu raten, schauen wir uns an, was die Kursbewegung, die Indikatoren und die Struktur ganz klar zeigen.
1. Marktstruktur: Steht weiterhin unter Druck
Im 4-Stunden-Zeitrahmen bleibt SOL in einem kurzfristigen Abwärtstrend.
Der Kurs handelt unter wichtigen gleitenden Durchschnitten (EMA 20, EMA 50 und MA 100/200).
Jede Erholung wird verkauft, wodurch niedrigere Hochs entstehen.
Das bestätigt, dass die Bären vorerst weiterhin die Kontrolle haben.
SOL/USDT 4H-Chartanalyse: Findet Solana wieder Halt oder steht ein weiterer Rückgang bevor?
Solana (SOL) wird derzeit bei etwa 83 US-Dollar gehandelt, ist um über 3% gefallen, und der 4-Stunden-Chart erzählt eine wichtige Geschichte, die Trader und Investoren nicht ignorieren sollten.
Statt zu raten, schauen wir uns an, was die Kursbewegung, die Indikatoren und die Struktur ganz klar zeigen.
1. Marktstruktur: Steht weiterhin unter Druck
Im 4-Stunden-Zeitrahmen bleibt SOL in einem kurzfristigen Abwärtstrend.
Der Kurs handelt unter wichtigen gleitenden Durchschnitten (EMA 20, EMA 50 und MA 100/200).
Jede Erholung wird verkauft, wodurch niedrigere Hochs entstehen.
Das bestätigt, dass die Bären vorerst weiterhin die Kontrolle haben.
Statt zu raten, schauen wir uns an, was die Kursbewegung, die Indikatoren und die Struktur ganz klar zeigen.
1. Marktstruktur: Steht weiterhin unter Druck
Im 4-Stunden-Zeitrahmen bleibt SOL in einem kurzfristigen Abwärtstrend.
Der Kurs handelt unter wichtigen gleitenden Durchschnitten (EMA 20, EMA 50 und MA 100/200).
Jede Erholung wird verkauft, wodurch niedrigere Hochs entstehen.
Das bestätigt, dass die Bären vorerst weiterhin die Kontrolle haben.
1
2
164
·
--
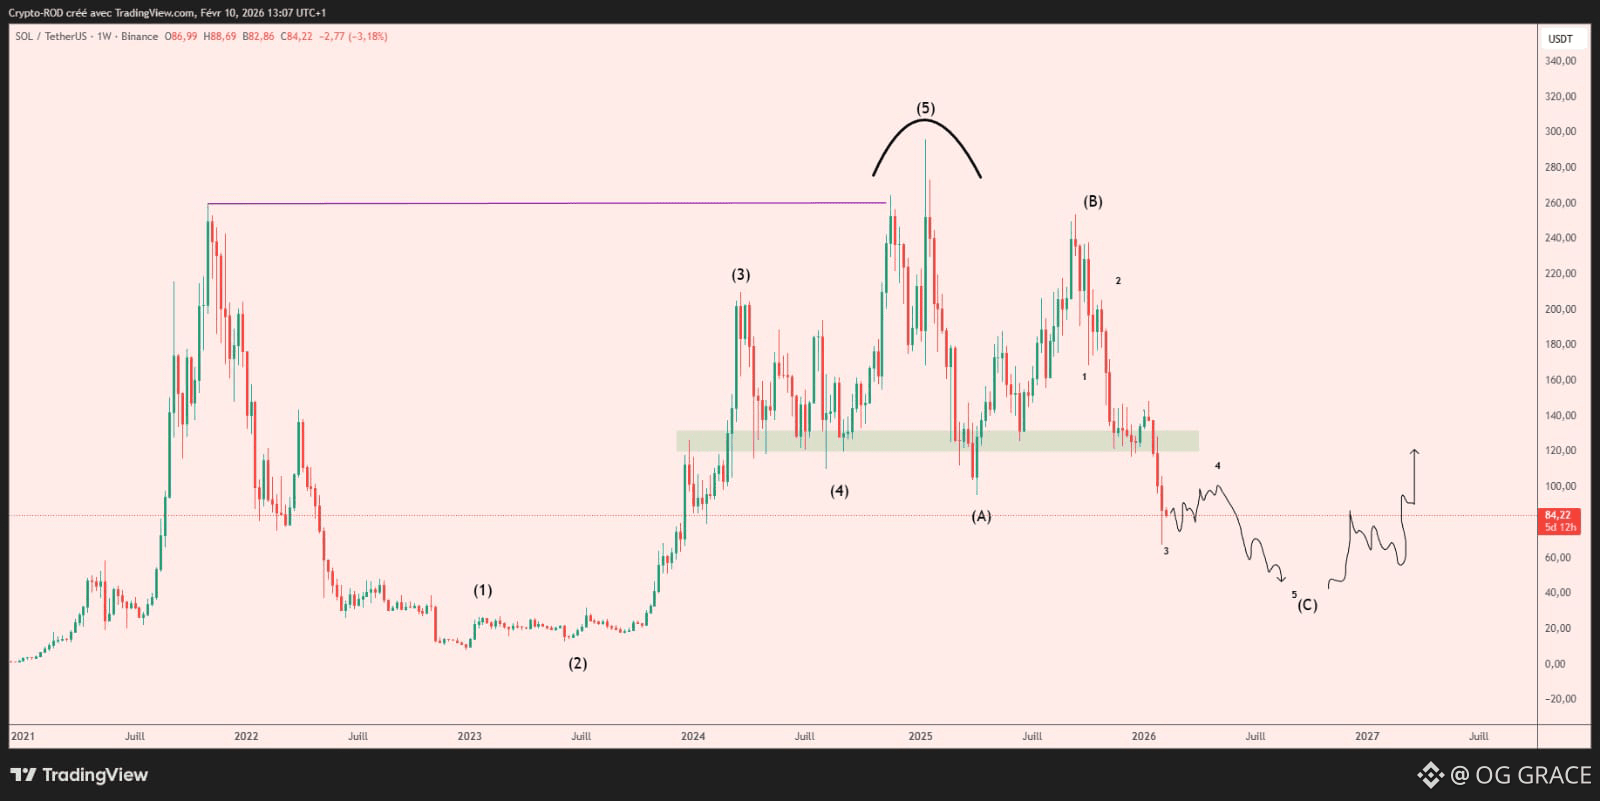
$SOL HTF bearish count update
Schöner Move seit den Hochs, jetzt denke ich, dass wir hier die Welle 4 aufbauen können & und mit einer weiteren Abwärtswelle für den Move 5 später abschließen ✍️
$SOL HTF bearish count update
Schöner Move seit den Hochs, jetzt denke ich, dass wir hier die Welle 4 aufbauen können & und mit einer weiteren Abwärtswelle für den Move 5 später abschließen ✍️
Schöner Move seit den Hochs, jetzt denke ich, dass wir hier die Welle 4 aufbauen können & und mit einer weiteren Abwärtswelle für den Move 5 später abschließen ✍️
1
21
·
--
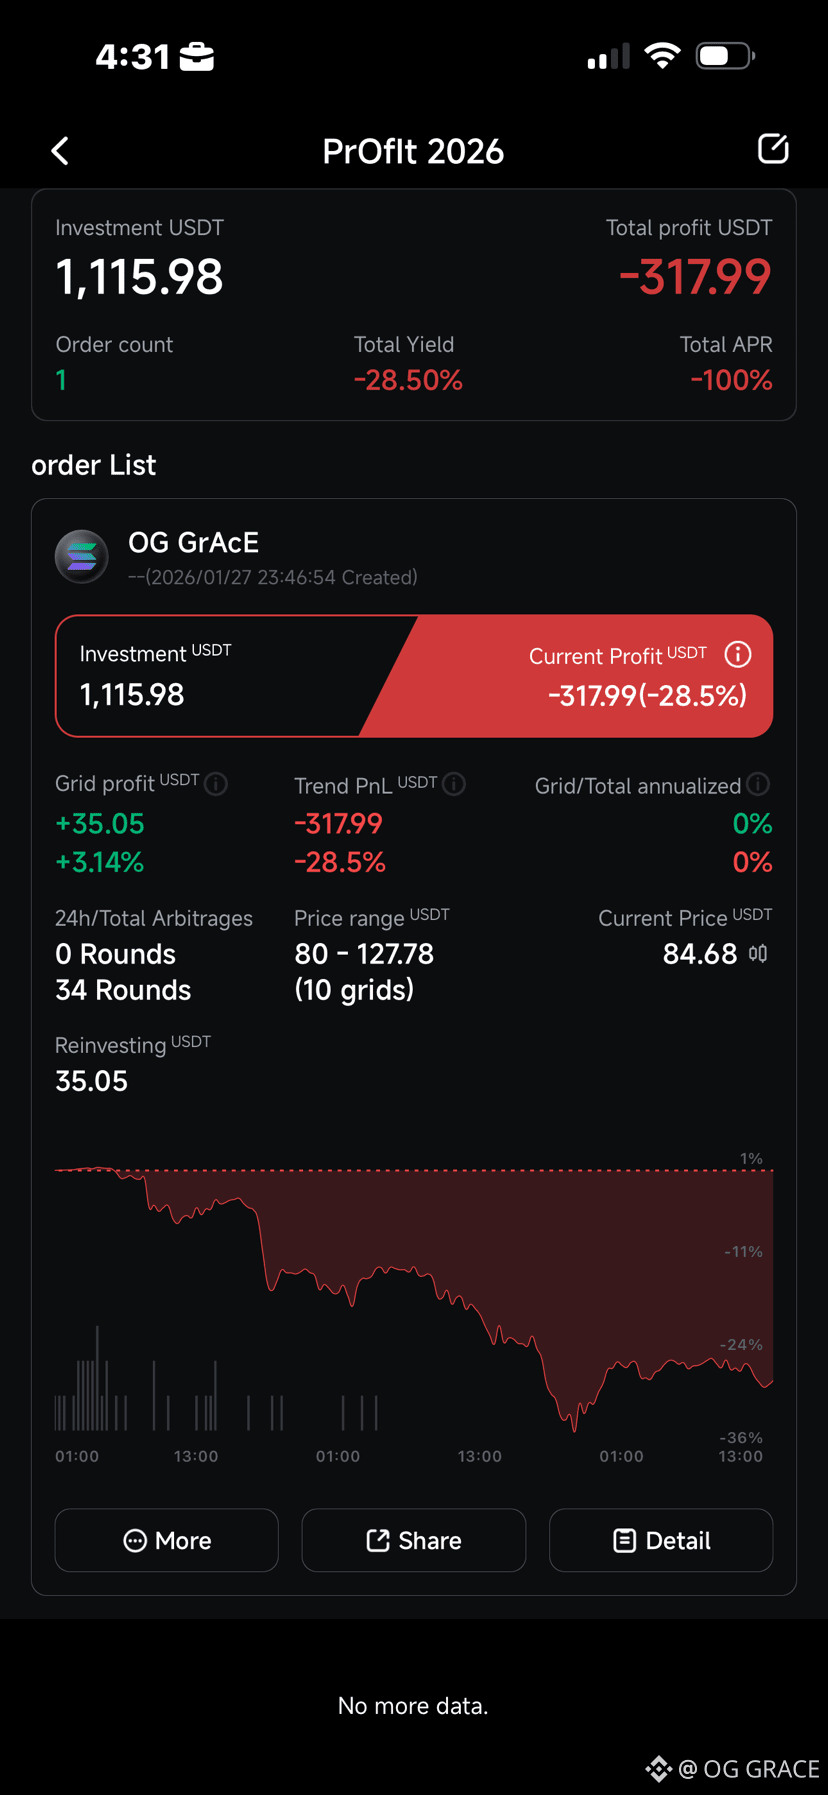
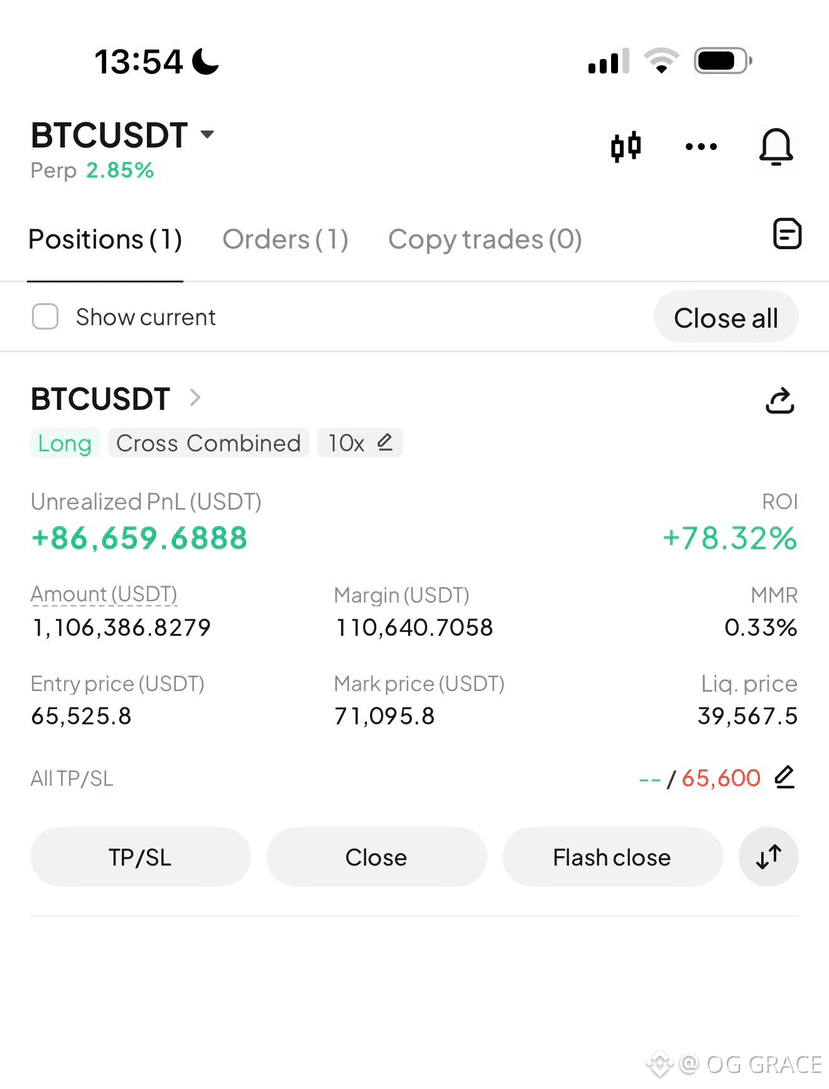
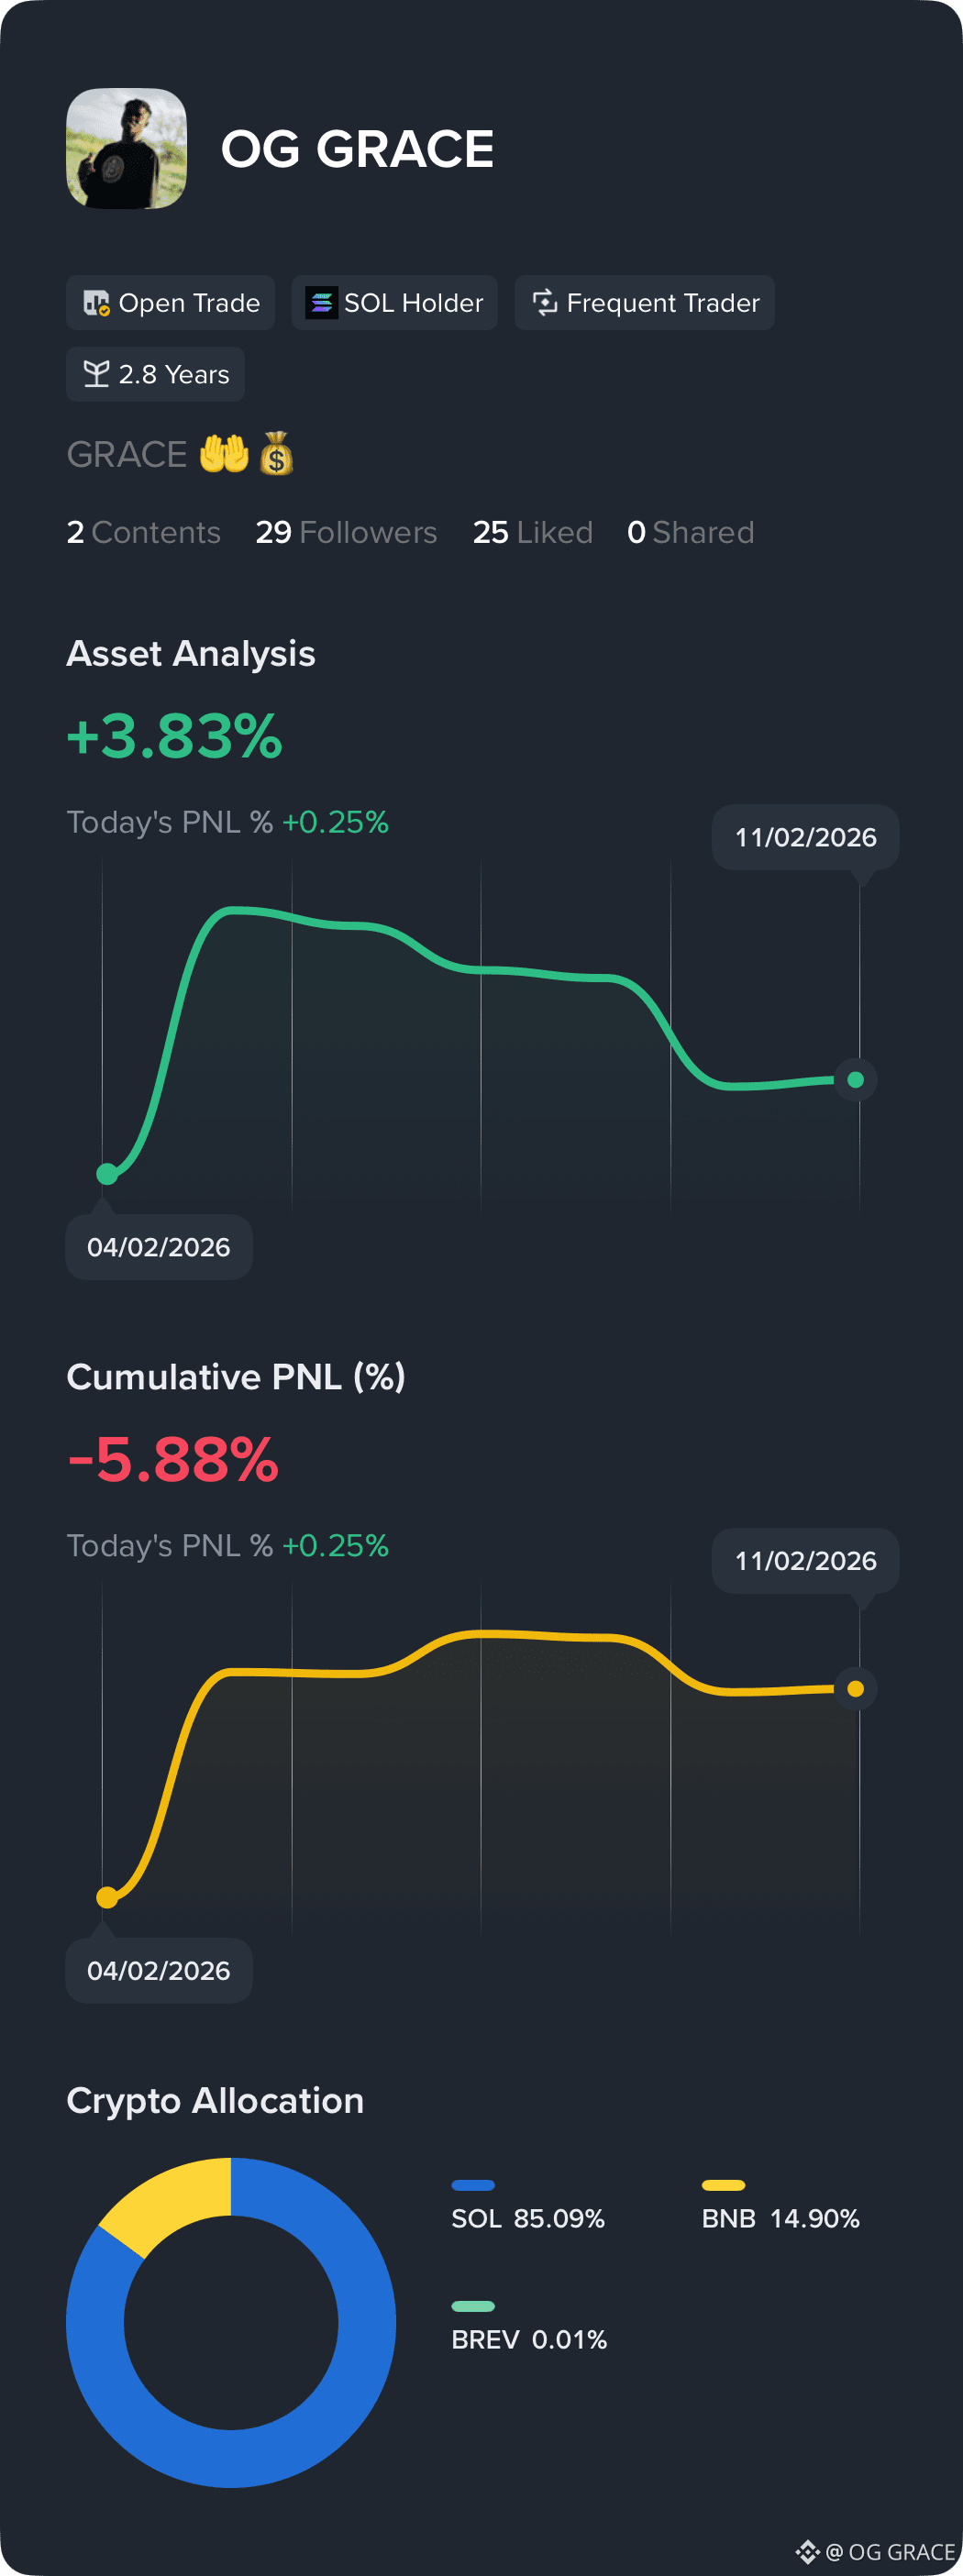
Sehen Sie meine Renditen und die Aufschlüsselung meines Portfolios. Folgen Sie mir für Investment-Tipps
Sehen Sie meine Renditen und die Aufschlüsselung meines Portfolios. Folgen Sie mir für Investment-Tipps
1
2
7
·
--
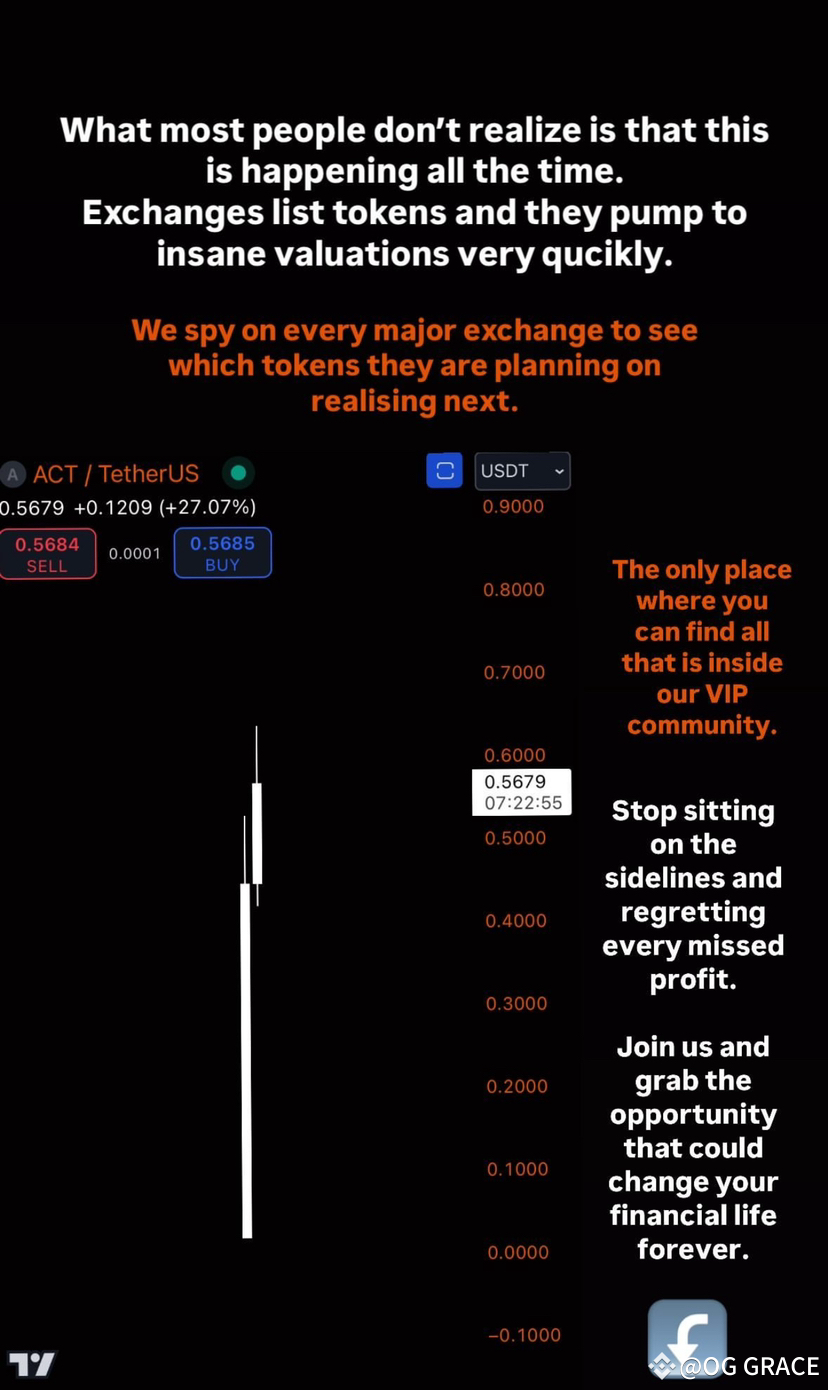
Was die meisten Leute nicht wissen, ist, dass das ständig passiert.
Börsen listen Token auf und treiben sie in Windeseile auf wahnsinnige Werte.
Was die meisten Leute nicht wissen, ist, dass das ständig passiert.
Börsen listen Token auf und treiben sie in Windeseile auf wahnsinnige Werte.
Börsen listen Token auf und treiben sie in Windeseile auf wahnsinnige Werte.
1
135
Anmelden und weiter Inhalte entdecken
Krypto-Nutzer weltweit auf Binance Square kennenlernen
⚡️ Bleib in Sachen Krypto stets am Puls.
💬 Die weltgrößte Kryptobörse vertraut darauf.
👍 Erhalte verlässliche Einblicke von verifizierten Creators.
E-Mail-Adresse/Telefonnummer
Trendthemen
NFPWatch
10.8M Aufrufe
19,007 Kommentare
Krypto-News | Bitcoin nähert sich der Marke von 85.000 US-Dollar, während die Renditen von US-Staatsanleihen vor dem Bericht zu den NFP zurückgehen
Binance News
·36 Likes
·47.1k Aufrufe
BitcoinFundingRateTriplesTo10%
116,987 Aufrufe
1,006 Kommentare
BitcoinSurpasses$86KUp2.99%
35,320 Aufrufe
96 Kommentare