
206 Atlas
84.3k Beiträge

206 Atlas
Melden
Nutzer blockieren
Atlas Research | Cryptoholic | Sharing Market insight and analysis | NFA | DYOR

BNB Halter
Regelmäßiger Trader
5.1 Jahre
8.0K+ Following
15.0K+ Follower
26.3K+ Like gegeben
Beiträge
Alle
Zitierungen
·
--
Bärisch
Übersetzung ansehen
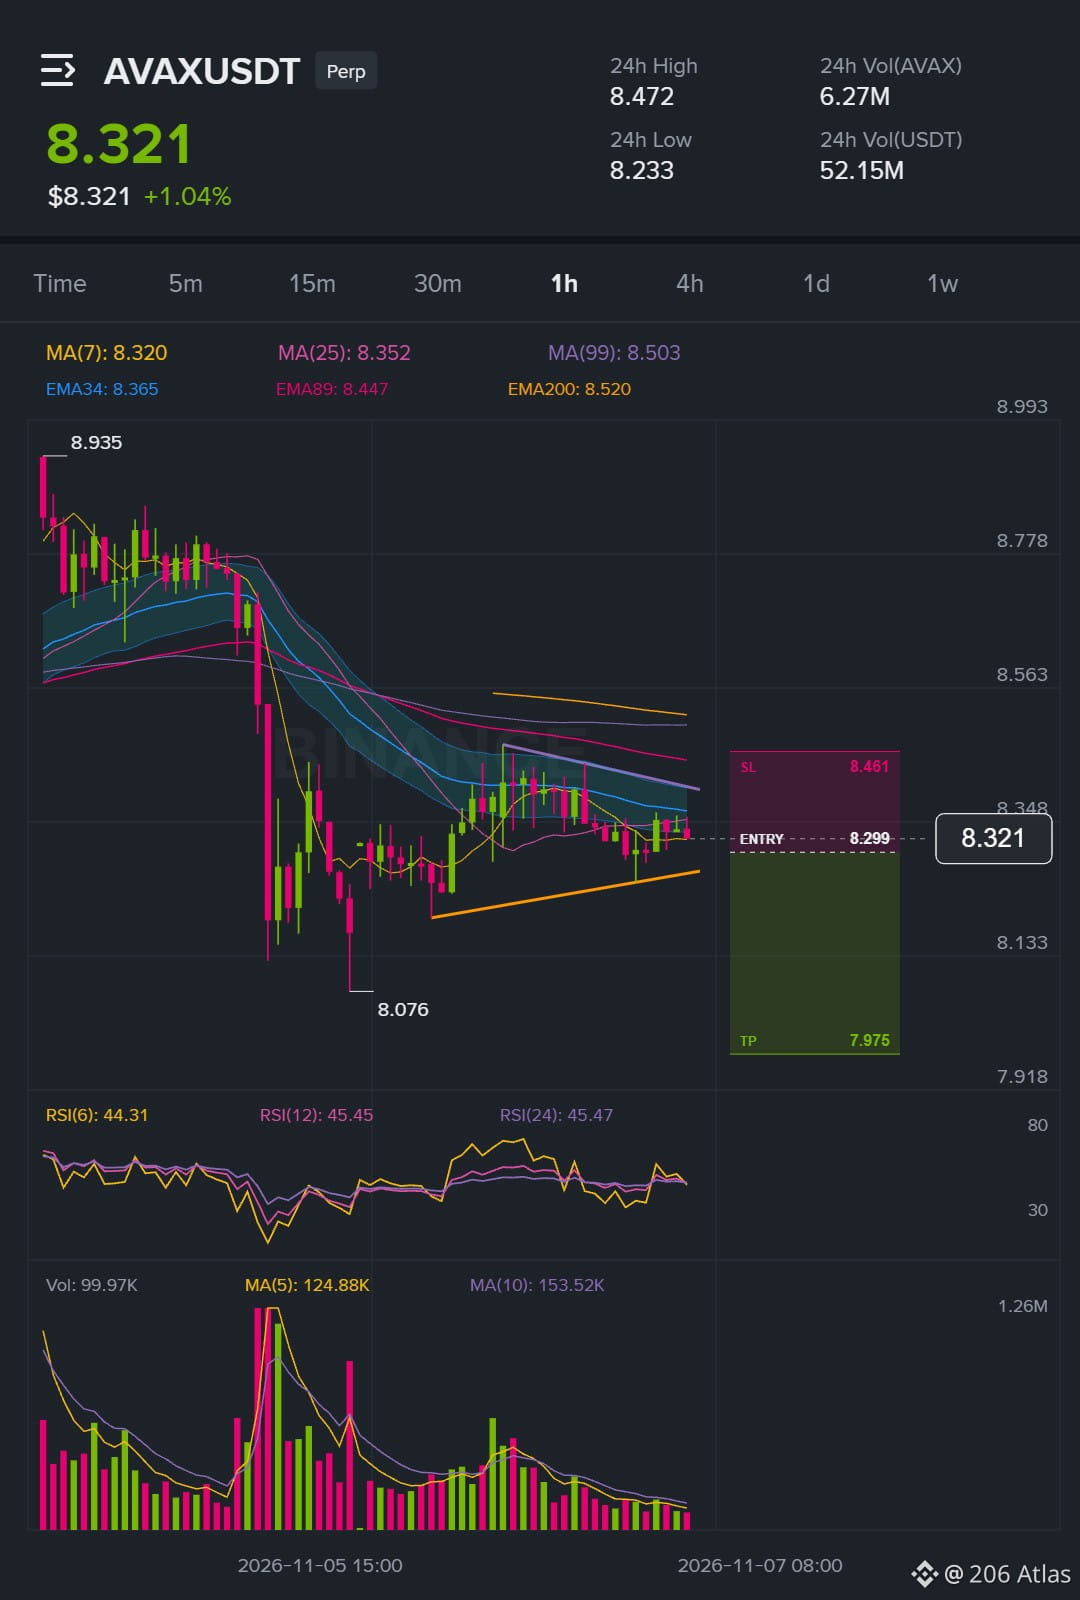
AVAX looks like a simple bounce, but the structure says otherwise.
AVAX is sitting in the entry zone right now and BTC is pushing higher on the 15m, yet the setup plays out with the trend on AVAX itself. The risk is against BTC momentum, so I am taking the path of least resistance down with the AVAX structure.
$AVAX /USDT - 🔴 SHORT
Trade Plan:
Entry: 8.2937 – 8.3043
SL: 8.4608
TP Area: 8.1777 - 7.9754
AVAX is already in the zone, so the plan is on.
Levels are marked on the chart 👇
{future}(AVAXUSDT)
Personal market analysis only. Not financial advice — manage risk and do your own research.
AVAX looks like a simple bounce, but the structure says otherwise.
AVAX is sitting in the entry zone right now and BTC is pushing higher on the 15m, yet the setup plays out with the trend on AVAX itself. The risk is against BTC momentum, so I am taking the path of least resistance down with the AVAX structure.
$AVAX /USDT - 🔴 SHORT
Trade Plan:
Entry: 8.2937 – 8.3043
SL: 8.4608
TP Area: 8.1777 - 7.9754
AVAX is already in the zone, so the plan is on.
Levels are marked on the chart 👇
Personal market analysis only. Not financial advice — manage risk and do your own research.
AVAX is sitting in the entry zone right now and BTC is pushing higher on the 15m, yet the setup plays out with the trend on AVAX itself. The risk is against BTC momentum, so I am taking the path of least resistance down with the AVAX structure.
$AVAX /USDT - 🔴 SHORT
Trade Plan:
Entry: 8.2937 – 8.3043
SL: 8.4608
TP Area: 8.1777 - 7.9754
AVAX is already in the zone, so the plan is on.
Levels are marked on the chart 👇
Personal market analysis only. Not financial advice — manage risk and do your own research.
54
·
--
Bullisch
Übersetzung ansehen
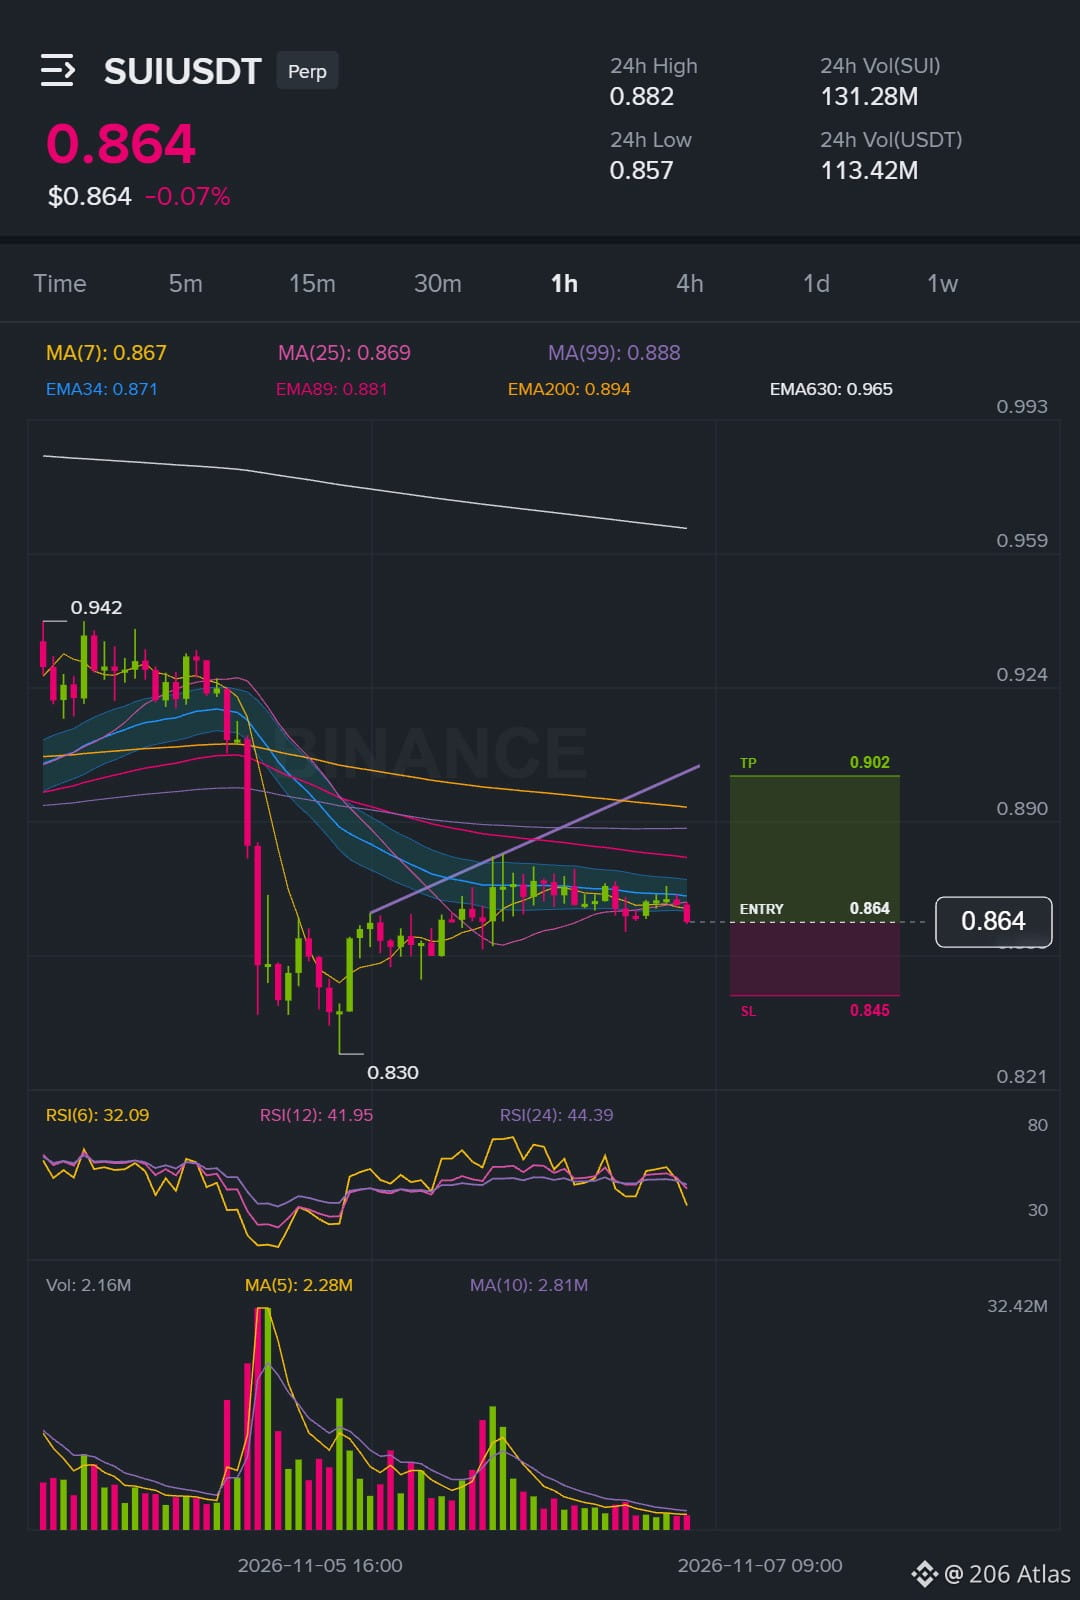
SUI is inside the entry zone and I am not chasing.
The plan is to let price come to 0.863303 - 0.864497 on its own. The idea is wrong if 1h holds below 0.908064, so the stop is 0.845038. I switched from the opposite side a few hours back, and the setup is with the trend.
$SUI /USDT - 🟢 LONG
Trade Plan:
Entry: 0.863303 – 0.864497
SL: 0.845038
TP Area: 0.878047 - 0.901624
Here's how it looks on the chart 👇
{future}(SUIUSDT)
Personal market analysis only. Not financial advice — manage risk and do your own research.
$AVAX plan drops in the next post.
SUI is inside the entry zone and I am not chasing.
The plan is to let price come to 0.863303 - 0.864497 on its own. The idea is wrong if 1h holds below 0.908064, so the stop is 0.845038. I switched from the opposite side a few hours back, and the setup is with the trend.
$SUI /USDT - 🟢 LONG
Trade Plan:
Entry: 0.863303 – 0.864497
SL: 0.845038
TP Area: 0.878047 - 0.901624
Here's how it looks on the chart 👇
Personal market analysis only. Not financial advice — manage risk and do your own research.
$AVAX plan drops in the next post.
The plan is to let price come to 0.863303 - 0.864497 on its own. The idea is wrong if 1h holds below 0.908064, so the stop is 0.845038. I switched from the opposite side a few hours back, and the setup is with the trend.
$SUI /USDT - 🟢 LONG
Trade Plan:
Entry: 0.863303 – 0.864497
SL: 0.845038
TP Area: 0.878047 - 0.901624
Here's how it looks on the chart 👇
Personal market analysis only. Not financial advice — manage risk and do your own research.
$AVAX plan drops in the next post.
78
·
--
Bullisch
Übersetzung ansehen
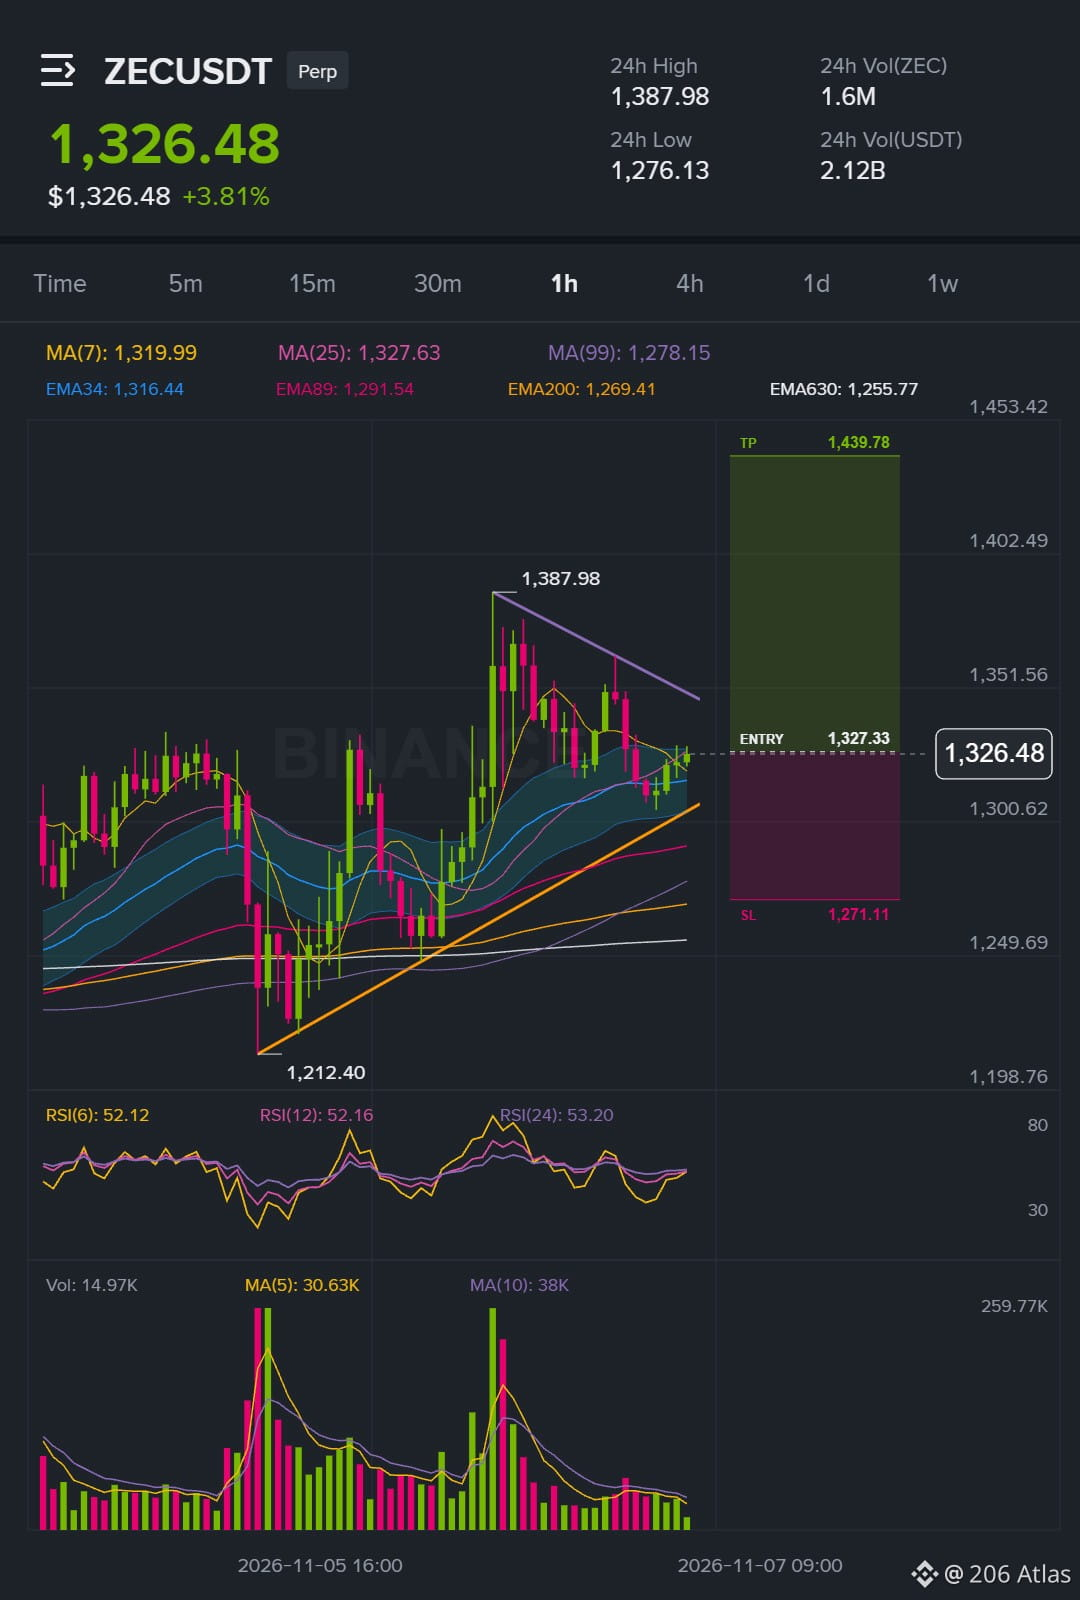
ZEC still inside the entry zone, so what is the pullback telling you 📈
$ZEC /USDT - 🟢 LONG
Trade Plan:
Entry: 1325.41 – 1329.25
SL: 1271.11
TP Area: 1369.50 - 1439.78
ZEC is moving with the trend and the pullback is giving a clean entry zone. The setup holds as long as 1230.75 flips on the 1h, and I already posted on ZEC a few hours ago in the same direction.
Here's how it looks on the chart 👇
{future}(ZECUSDT)
Personal market analysis only. Not financial advice — manage risk and do your own research.
$SUI — waiting for my level.
ZEC still inside the entry zone, so what is the pullback telling you 📈
$ZEC /USDT - 🟢 LONG
Trade Plan:
Entry: 1325.41 – 1329.25
SL: 1271.11
TP Area: 1369.50 - 1439.78
ZEC is moving with the trend and the pullback is giving a clean entry zone. The setup holds as long as 1230.75 flips on the 1h, and I already posted on ZEC a few hours ago in the same direction.
Here's how it looks on the chart 👇
Personal market analysis only. Not financial advice — manage risk and do your own research.
$SUI — waiting for my level.
$ZEC /USDT - 🟢 LONG
Trade Plan:
Entry: 1325.41 – 1329.25
SL: 1271.11
TP Area: 1369.50 - 1439.78
ZEC is moving with the trend and the pullback is giving a clean entry zone. The setup holds as long as 1230.75 flips on the 1h, and I already posted on ZEC a few hours ago in the same direction.
Here's how it looks on the chart 👇
Personal market analysis only. Not financial advice — manage risk and do your own research.
$SUI — waiting for my level.
43
·
--
Bullisch
Übersetzung ansehen
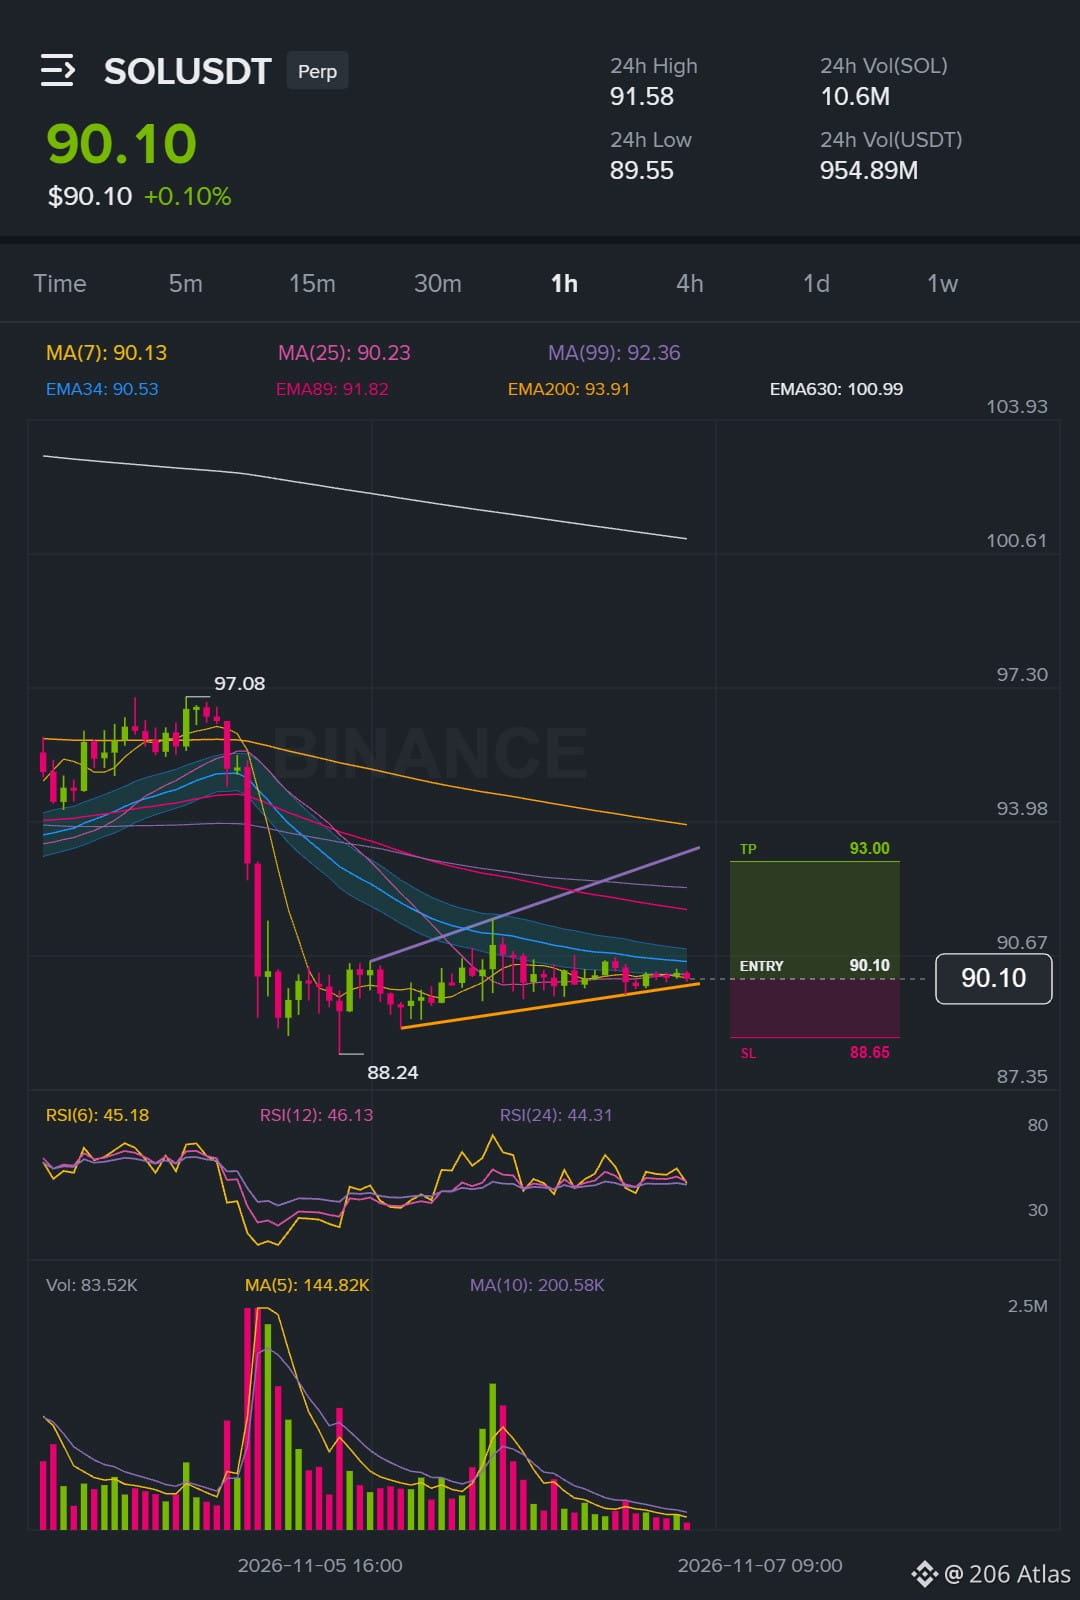
$SOL /USDT - 🟢 LONG · Conf 78%
Trade Plan:
Entry: 90.0579 – 90.1421
SL: 88.6480
TP Area: 91.1890 - 93.0040
Note: Probable direction is LONG in a trend regime; this is not a guarantee, so be careful and respect the stop loss.
Click here to view the chart 👇️
{future}(SOLUSDT)
Personal market analysis only. Not financial advice — manage risk and do your own research.
$SOL /USDT - 🟢 LONG · Conf 78%
Trade Plan:
Entry: 90.0579 – 90.1421
SL: 88.6480
TP Area: 91.1890 - 93.0040
Note: Probable direction is LONG in a trend regime; this is not a guarantee, so be careful and respect the stop loss.
Click here to view the chart 👇️
Personal market analysis only. Not financial advice — manage risk and do your own research.
Trade Plan:
Entry: 90.0579 – 90.1421
SL: 88.6480
TP Area: 91.1890 - 93.0040
Note: Probable direction is LONG in a trend regime; this is not a guarantee, so be careful and respect the stop loss.
Click here to view the chart 👇️
Personal market analysis only. Not financial advice — manage risk and do your own research.
37
·
--
Bullisch
Übersetzung ansehen
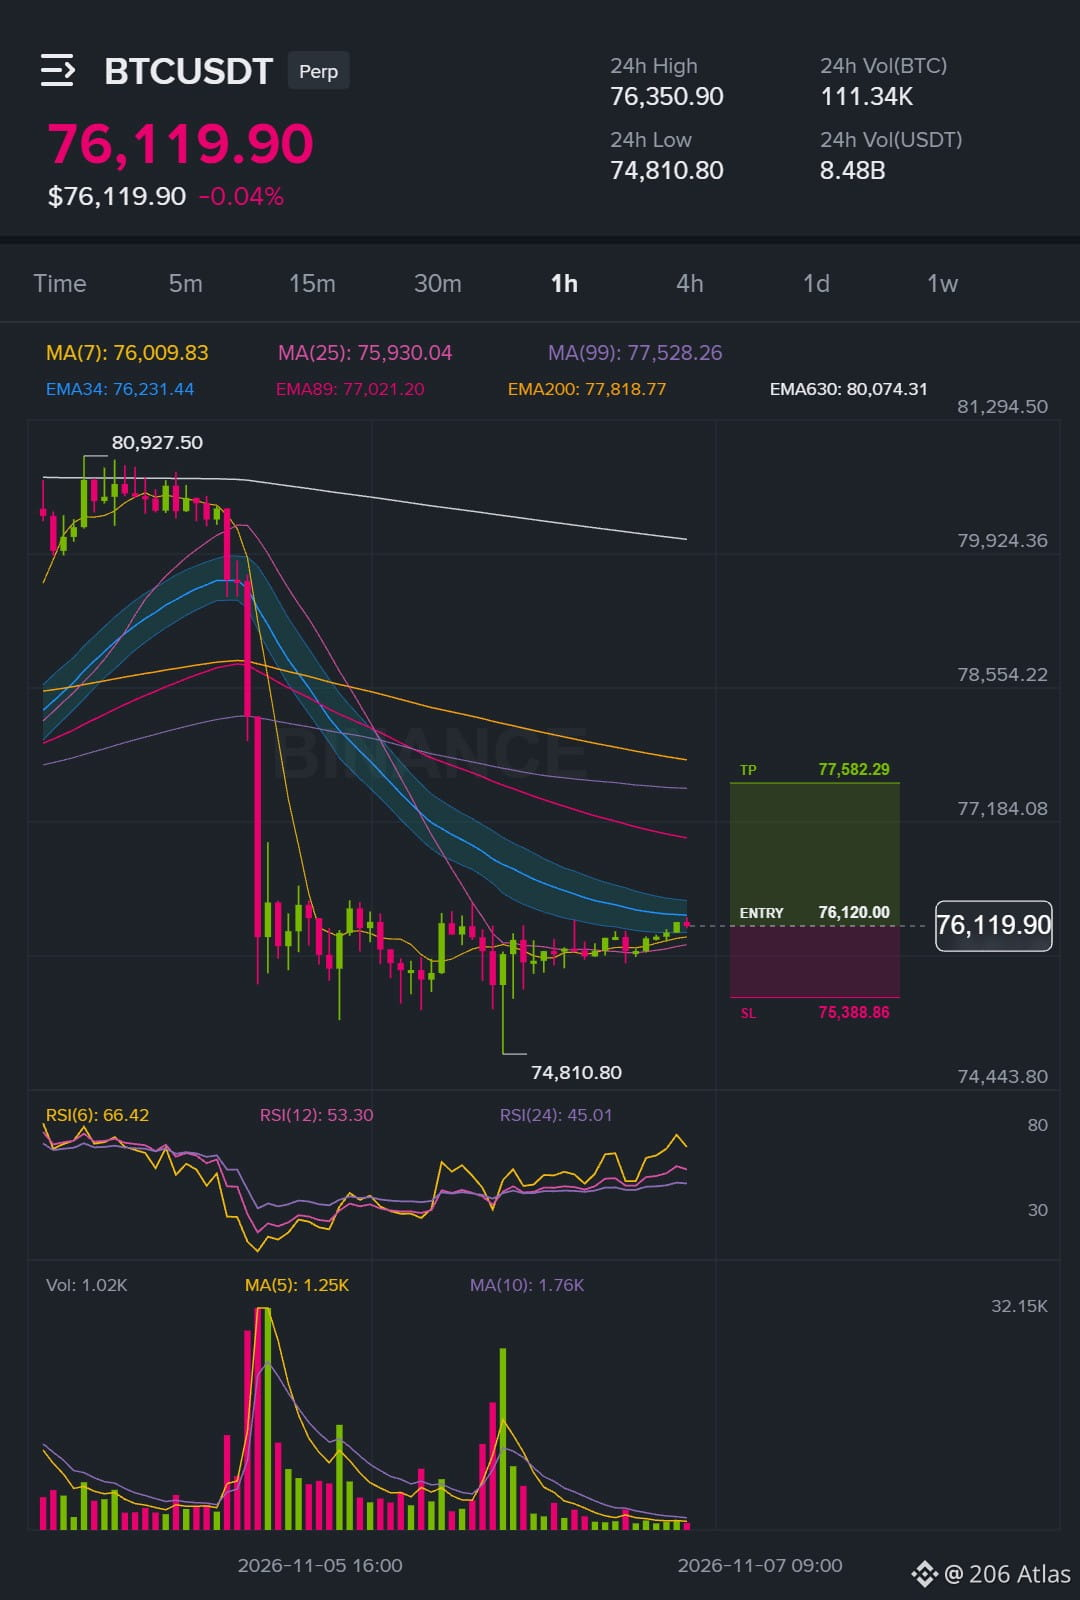
I am going long on BTC here.
$BTC /USDT - 🟢 LONG
Trade Plan:
Entry: 76103.69 – 76136.31
SL: 75388.86
TP Area: 76668.36 - 77582.29
Why go long after the recent move against you. The volatility is compressed, so a bigger move can follow. Momentum is stretched but still with the trend. I changed my mind on the prior call, so this is the new read with the same setup type. 📈
Click here to view the chart 👇️
{future}(BTCUSDT)
Personal market analysis only. Not financial advice — manage risk and do your own research.
I am going long on BTC here.
$BTC /USDT - 🟢 LONG
Trade Plan:
Entry: 76103.69 – 76136.31
SL: 75388.86
TP Area: 76668.36 - 77582.29
Why go long after the recent move against you. The volatility is compressed, so a bigger move can follow. Momentum is stretched but still with the trend. I changed my mind on the prior call, so this is the new read with the same setup type. 📈
Click here to view the chart 👇️
Personal market analysis only. Not financial advice — manage risk and do your own research.
$BTC /USDT - 🟢 LONG
Trade Plan:
Entry: 76103.69 – 76136.31
SL: 75388.86
TP Area: 76668.36 - 77582.29
Why go long after the recent move against you. The volatility is compressed, so a bigger move can follow. Momentum is stretched but still with the trend. I changed my mind on the prior call, so this is the new read with the same setup type. 📈
Click here to view the chart 👇️
Personal market analysis only. Not financial advice — manage risk and do your own research.
77
·
--
Bullisch
Übersetzung ansehen
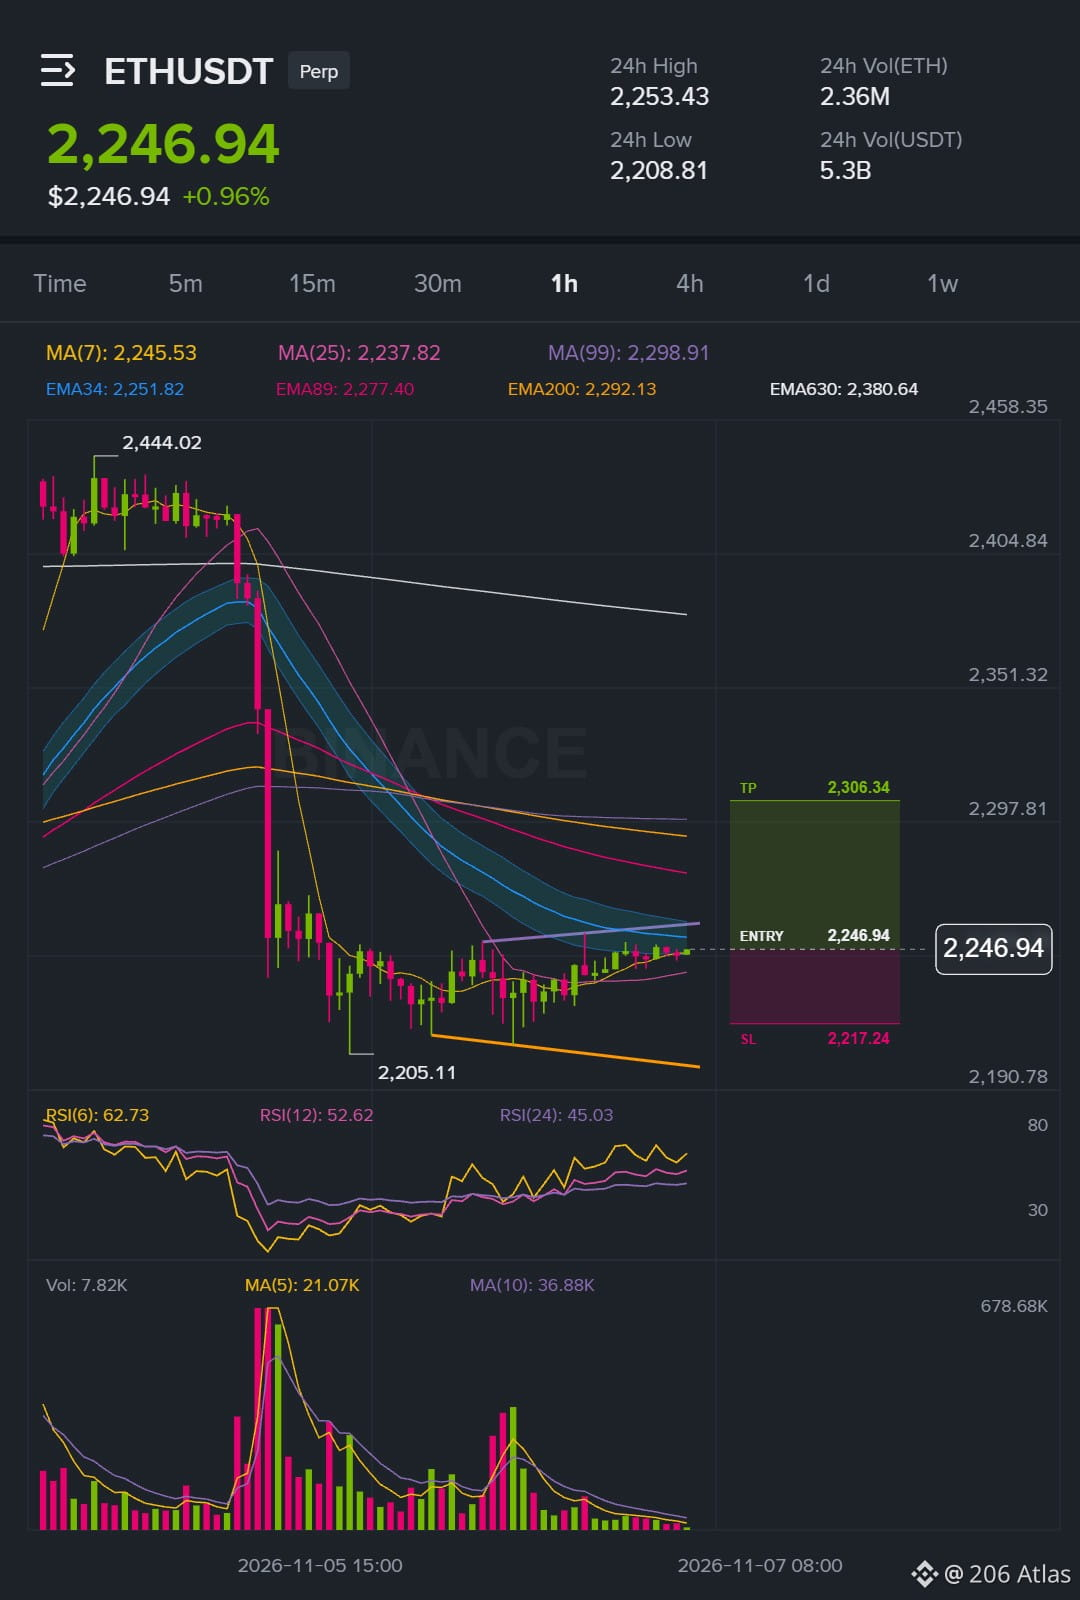
I switched direction on ETH after the last call lost conviction.
$ETH /USDT - 🟢 LONG
Trade Plan:
Entry: 2246.18 – 2247.70
SL: 2217.24
TP Area: 2269.21 - 2306.34
The 15m trend is weak and choppy, so I am following the levels rather than momentum. ETH is already inside the zone, which makes this a low-chase setup with the trend.
Would you wait for the retest of 2247.70 or enter right here?
Here's how it looks on the chart 👇
{future}(ETHUSDT)
Personal market analysis only. Not financial advice — manage risk and do your own research.
I switched direction on ETH after the last call lost conviction.
$ETH /USDT - 🟢 LONG
Trade Plan:
Entry: 2246.18 – 2247.70
SL: 2217.24
TP Area: 2269.21 - 2306.34
The 15m trend is weak and choppy, so I am following the levels rather than momentum. ETH is already inside the zone, which makes this a low-chase setup with the trend.
Would you wait for the retest of 2247.70 or enter right here?
Here's how it looks on the chart 👇
Personal market analysis only. Not financial advice — manage risk and do your own research.
$ETH /USDT - 🟢 LONG
Trade Plan:
Entry: 2246.18 – 2247.70
SL: 2217.24
TP Area: 2269.21 - 2306.34
The 15m trend is weak and choppy, so I am following the levels rather than momentum. ETH is already inside the zone, which makes this a low-chase setup with the trend.
Would you wait for the retest of 2247.70 or enter right here?
Here's how it looks on the chart 👇
Personal market analysis only. Not financial advice — manage risk and do your own research.
59
·
--
Bullisch
Übersetzung ansehen
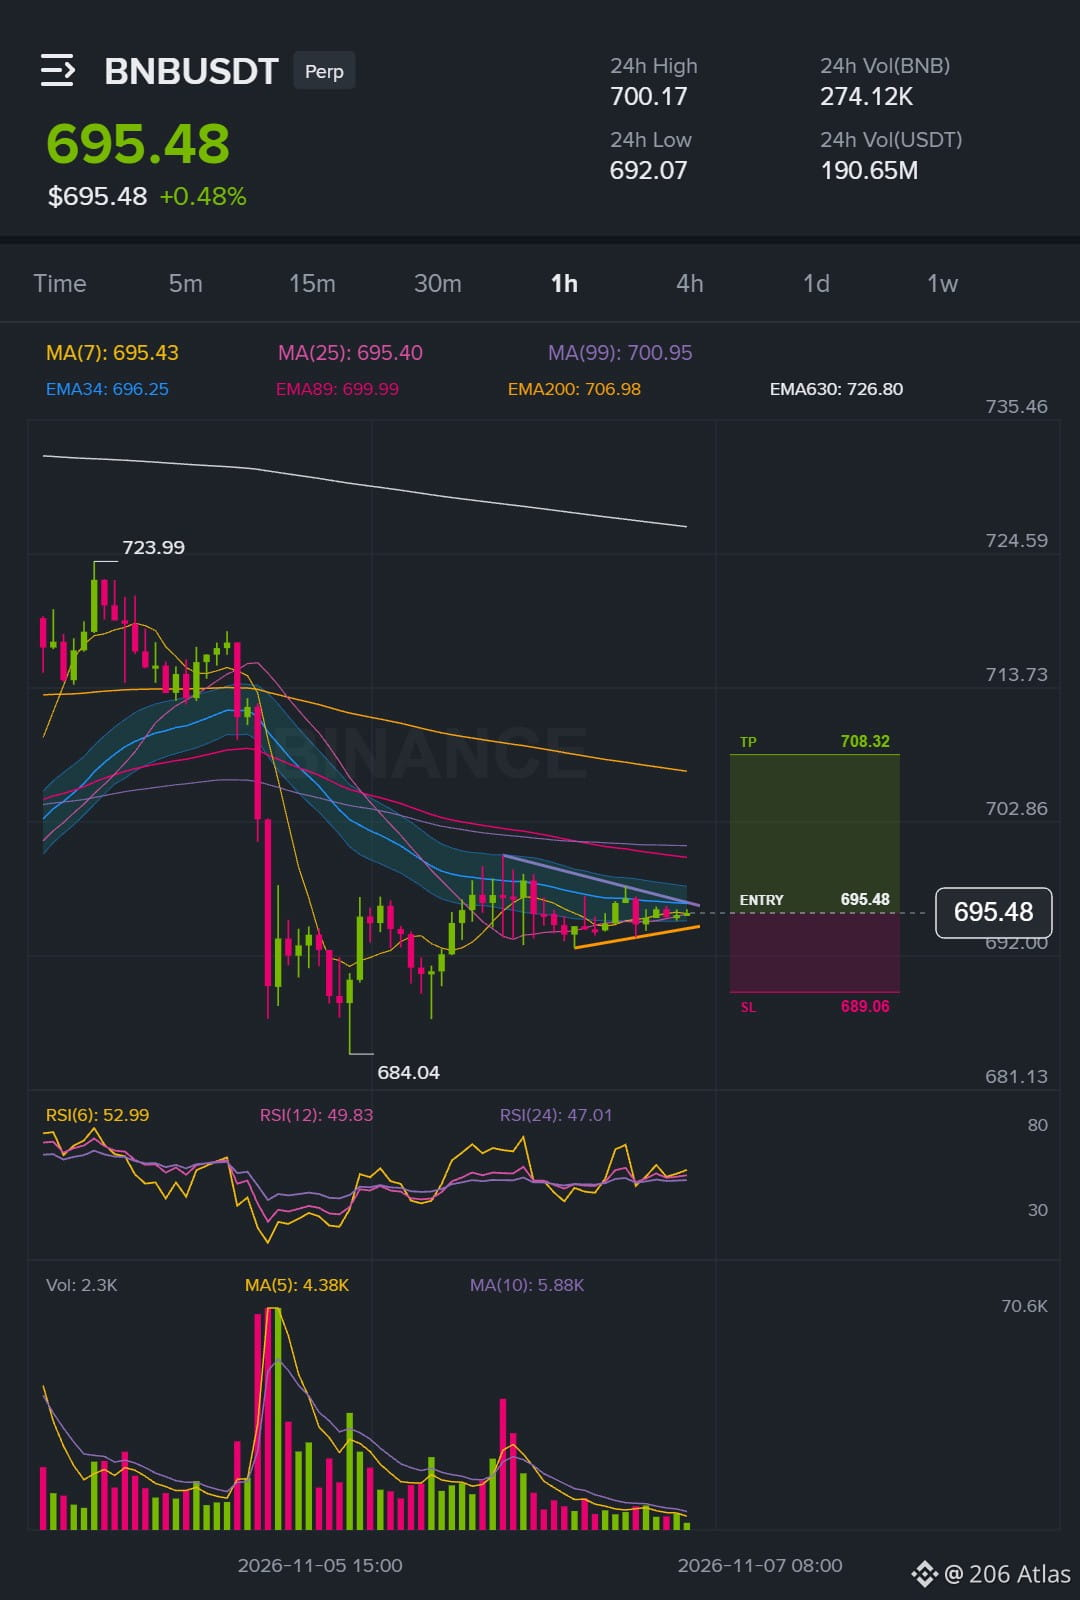
BNB shifted under me a few hours back, so this is the new read.
BNB has been drifting into the 695.312 - 695.648 zone, which I would rather wait for than chase. If it holds above 702.781 on the 1h the with-the-trend idea stays valid, and I am comfortable letting the stop at 689.060 define the risk. I changed my mind once already today and I am not forcing it again, just taking the setup as it sits.
$BNB /USDT - 🟢 LONG
Trade Plan:
Entry: 695.312 – 695.648
SL: 689.060
TP Area: 700.295 - 708.321
Patience over impulse, always.
Chart with my levels 👇
{future}(BNBUSDT)
Personal market analysis only. Not financial advice — manage risk and do your own research.
BNB shifted under me a few hours back, so this is the new read.
BNB has been drifting into the 695.312 - 695.648 zone, which I would rather wait for than chase. If it holds above 702.781 on the 1h the with-the-trend idea stays valid, and I am comfortable letting the stop at 689.060 define the risk. I changed my mind once already today and I am not forcing it again, just taking the setup as it sits.
$BNB /USDT - 🟢 LONG
Trade Plan:
Entry: 695.312 – 695.648
SL: 689.060
TP Area: 700.295 - 708.321
Patience over impulse, always.
Chart with my levels 👇
Personal market analysis only. Not financial advice — manage risk and do your own research.
BNB has been drifting into the 695.312 - 695.648 zone, which I would rather wait for than chase. If it holds above 702.781 on the 1h the with-the-trend idea stays valid, and I am comfortable letting the stop at 689.060 define the risk. I changed my mind once already today and I am not forcing it again, just taking the setup as it sits.
$BNB /USDT - 🟢 LONG
Trade Plan:
Entry: 695.312 – 695.648
SL: 689.060
TP Area: 700.295 - 708.321
Patience over impulse, always.
Chart with my levels 👇
Personal market analysis only. Not financial advice — manage risk and do your own research.
34
·
--
Bullisch
Übersetzung ansehen
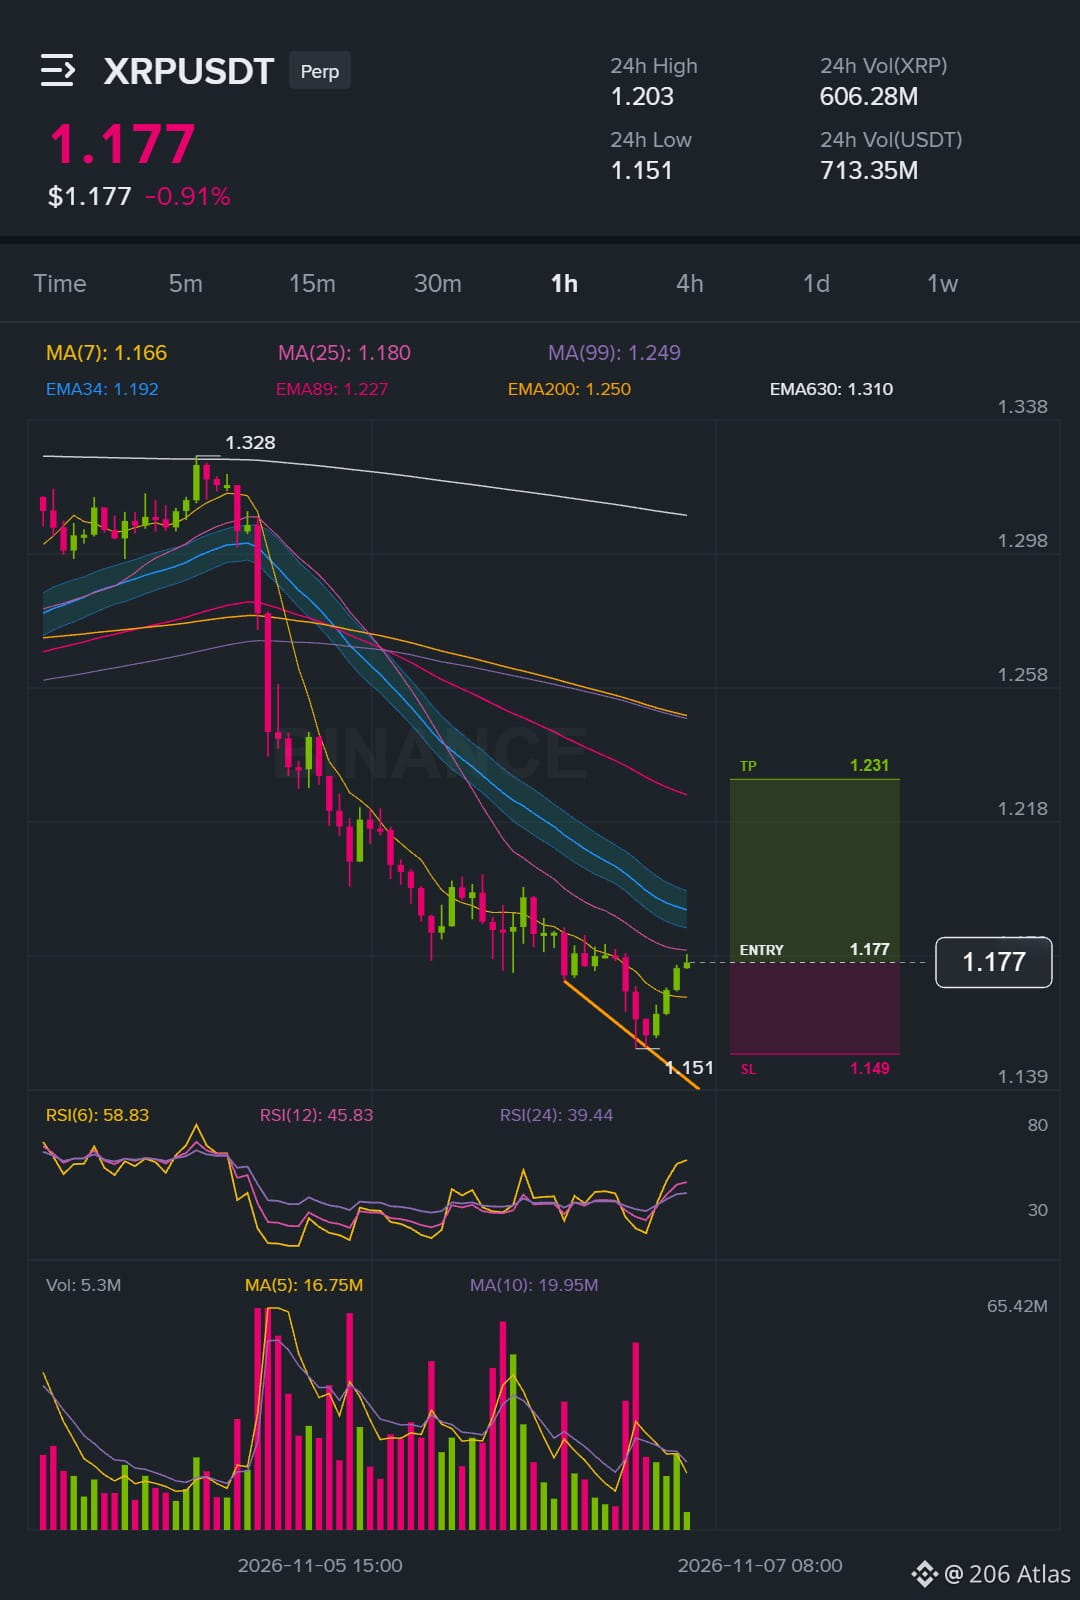
XRP sitting inside the entry zone 📈
$XRP /USDT - 🟢 LONG
Trade Plan:
Entry: 1.1755 – 1.1777
SL: 1.1493
TP Area: 1.1971 - 1.2312
XRP is already inside the entry zone, so I am not chasing it. The 15m trend is strong with ADX at 28 and it aligns with the call. First, I want price to stay above the invalidation level. Then I watch the 1h structure. Right now the setup is right in front of me and it is clean enough to act on.
Click here to view the chart 👇️
{future}(XRPUSDT)
Personal market analysis only. Not financial advice — manage risk and do your own research.
XRP sitting inside the entry zone 📈
$XRP /USDT - 🟢 LONG
Trade Plan:
Entry: 1.1755 – 1.1777
SL: 1.1493
TP Area: 1.1971 - 1.2312
XRP is already inside the entry zone, so I am not chasing it. The 15m trend is strong with ADX at 28 and it aligns with the call. First, I want price to stay above the invalidation level. Then I watch the 1h structure. Right now the setup is right in front of me and it is clean enough to act on.
Click here to view the chart 👇️
Personal market analysis only. Not financial advice — manage risk and do your own research.
$XRP /USDT - 🟢 LONG
Trade Plan:
Entry: 1.1755 – 1.1777
SL: 1.1493
TP Area: 1.1971 - 1.2312
XRP is already inside the entry zone, so I am not chasing it. The 15m trend is strong with ADX at 28 and it aligns with the call. First, I want price to stay above the invalidation level. Then I watch the 1h structure. Right now the setup is right in front of me and it is clean enough to act on.
Click here to view the chart 👇️
Personal market analysis only. Not financial advice — manage risk and do your own research.
79
·
--
Bullisch
Übersetzung ansehen
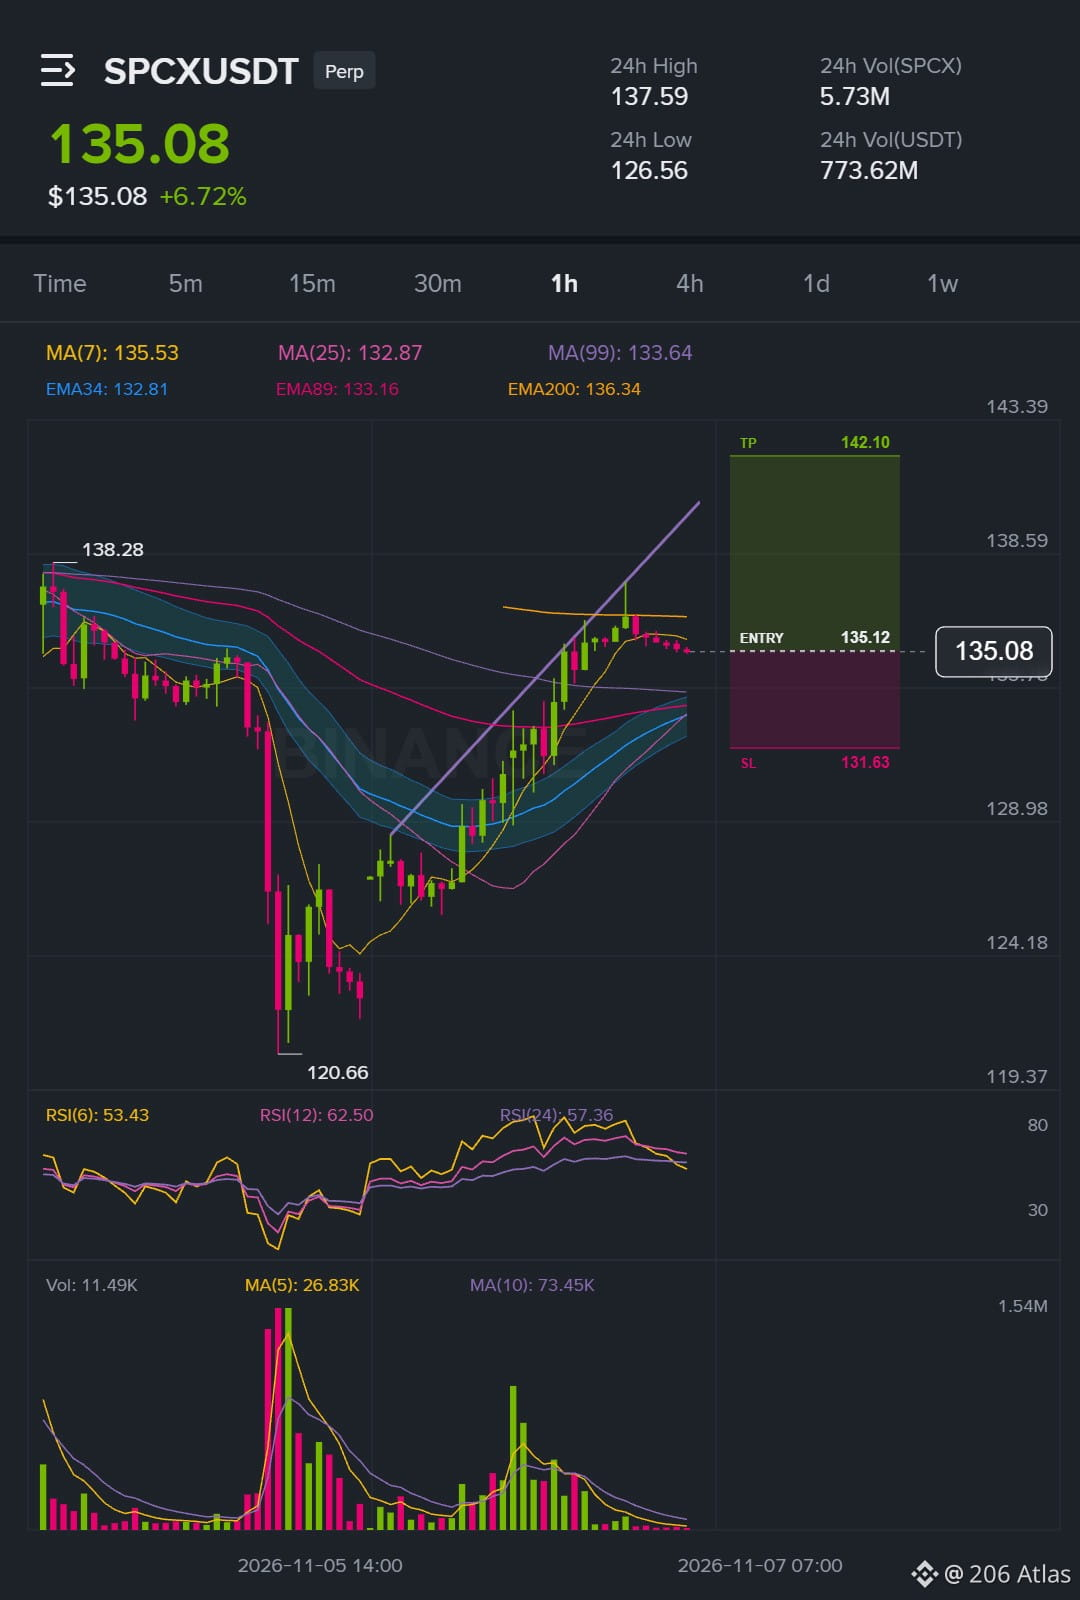
SPCX is already moving on its own, so this counter-trend pullback is a higher-risk chance I am taking.
$SPCX /USDT - 🟢 LONG
Trade Plan:
Entry: 135.05520 – 135.18480
SL: 131.62825
TP Area: 137.73881 - 142.10349
Here's how it looks on the chart 👇
{future}(SPCXUSDT)
Personal market analysis only. Not financial advice — manage risk and do your own research.
SPCX is already moving on its own, so this counter-trend pullback is a higher-risk chance I am taking.
$SPCX /USDT - 🟢 LONG
Trade Plan:
Entry: 135.05520 – 135.18480
SL: 131.62825
TP Area: 137.73881 - 142.10349
Here's how it looks on the chart 👇
Personal market analysis only. Not financial advice — manage risk and do your own research.
$SPCX /USDT - 🟢 LONG
Trade Plan:
Entry: 135.05520 – 135.18480
SL: 131.62825
TP Area: 137.73881 - 142.10349
Here's how it looks on the chart 👇
Personal market analysis only. Not financial advice — manage risk and do your own research.
64
·
--
Bärisch
Übersetzung ansehen
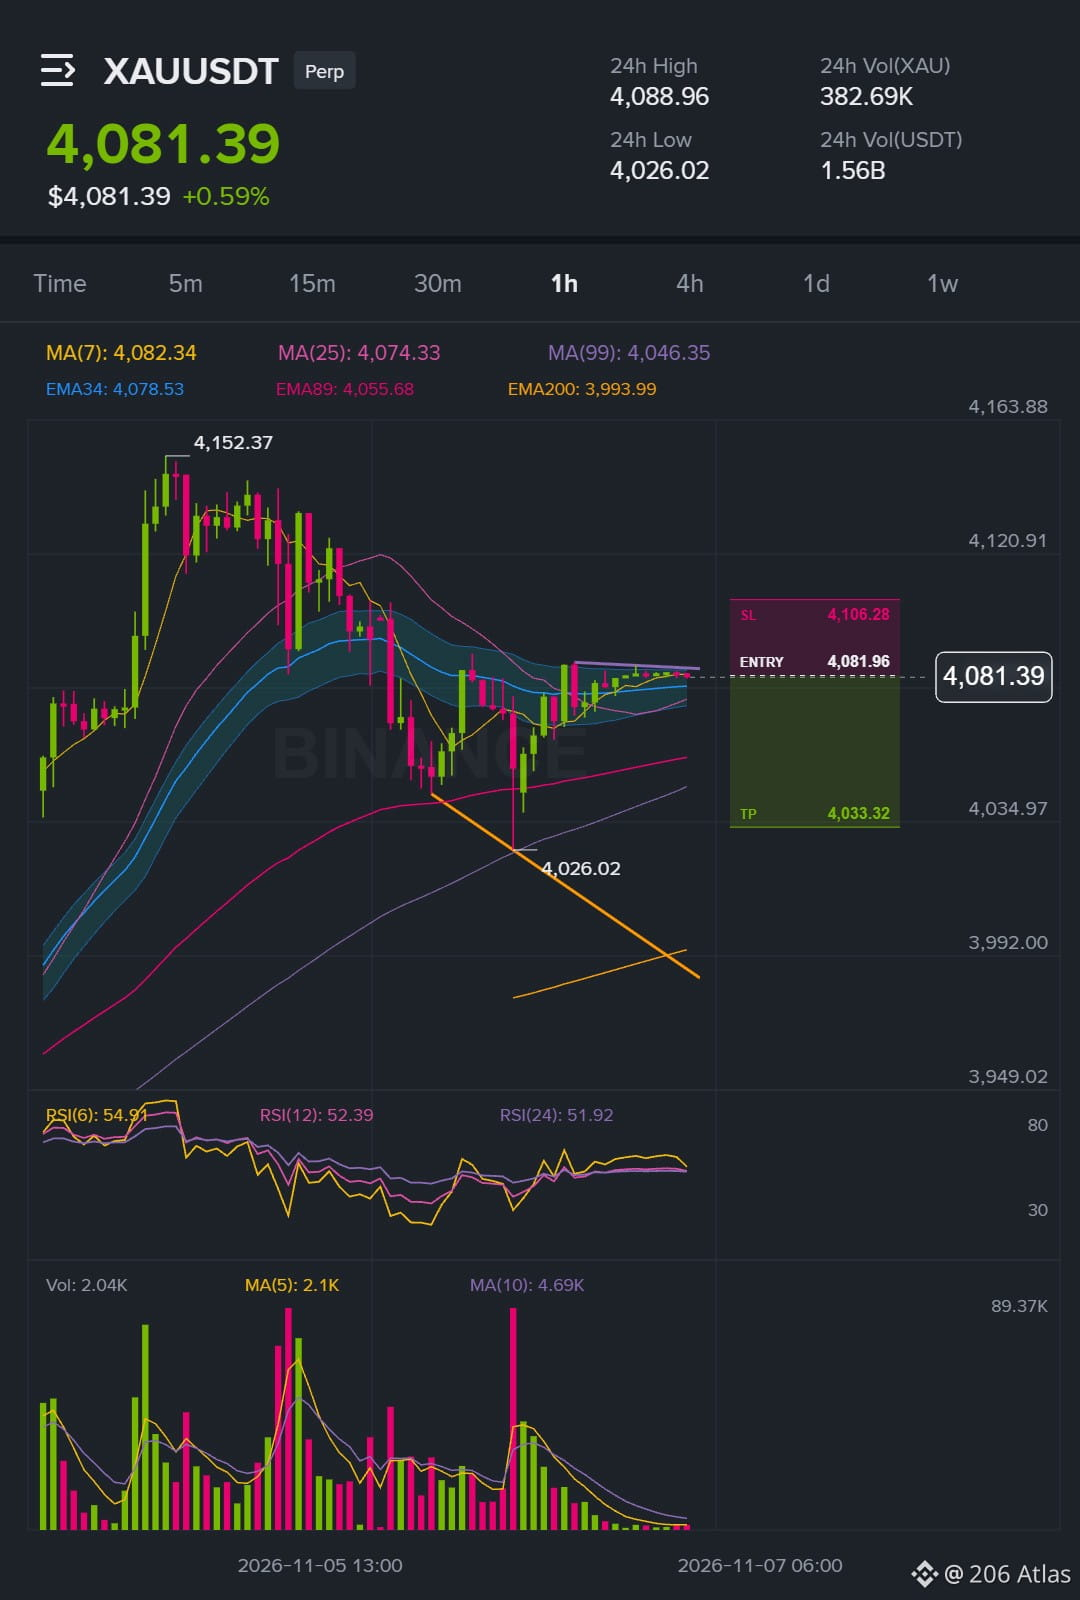
Most eyes are on the 4037.88 flip, but the stretch below it is telling a different story.
$XAU /USDT - 🔴 SHORT
Trade Plan:
Entry: 4081.70 – 4082.22
SL: 4106.28
TP Area: 4063.72 - 4033.32
Why this one? XAU is already inside the zone and the 1h structure keeps the trend intact. Why now? RSI is stretched to the downside while the move has not yet pushed through 4037.88. If price respects the zone and rejects 4106.28, the setup has room to run toward 4063.72 and 4033.32. I already posted on this pair a few hours ago, so I am letting the chart come to me again.
Keep the stop tight and let the setup play out.
Here's how it looks on the chart 👇
{future}(XAUUSDT)
Personal market analysis only. Not financial advice — manage risk and do your own research.
Most eyes are on the 4037.88 flip, but the stretch below it is telling a different story.
$XAU /USDT - 🔴 SHORT
Trade Plan:
Entry: 4081.70 – 4082.22
SL: 4106.28
TP Area: 4063.72 - 4033.32
Why this one? XAU is already inside the zone and the 1h structure keeps the trend intact. Why now? RSI is stretched to the downside while the move has not yet pushed through 4037.88. If price respects the zone and rejects 4106.28, the setup has room to run toward 4063.72 and 4033.32. I already posted on this pair a few hours ago, so I am letting the chart come to me again.
Keep the stop tight and let the setup play out.
Here's how it looks on the chart 👇
Personal market analysis only. Not financial advice — manage risk and do your own research.
$XAU /USDT - 🔴 SHORT
Trade Plan:
Entry: 4081.70 – 4082.22
SL: 4106.28
TP Area: 4063.72 - 4033.32
Why this one? XAU is already inside the zone and the 1h structure keeps the trend intact. Why now? RSI is stretched to the downside while the move has not yet pushed through 4037.88. If price respects the zone and rejects 4106.28, the setup has room to run toward 4063.72 and 4033.32. I already posted on this pair a few hours ago, so I am letting the chart come to me again.
Keep the stop tight and let the setup play out.
Here's how it looks on the chart 👇
Personal market analysis only. Not financial advice — manage risk and do your own research.
57
·
--
Bullisch
Übersetzung ansehen
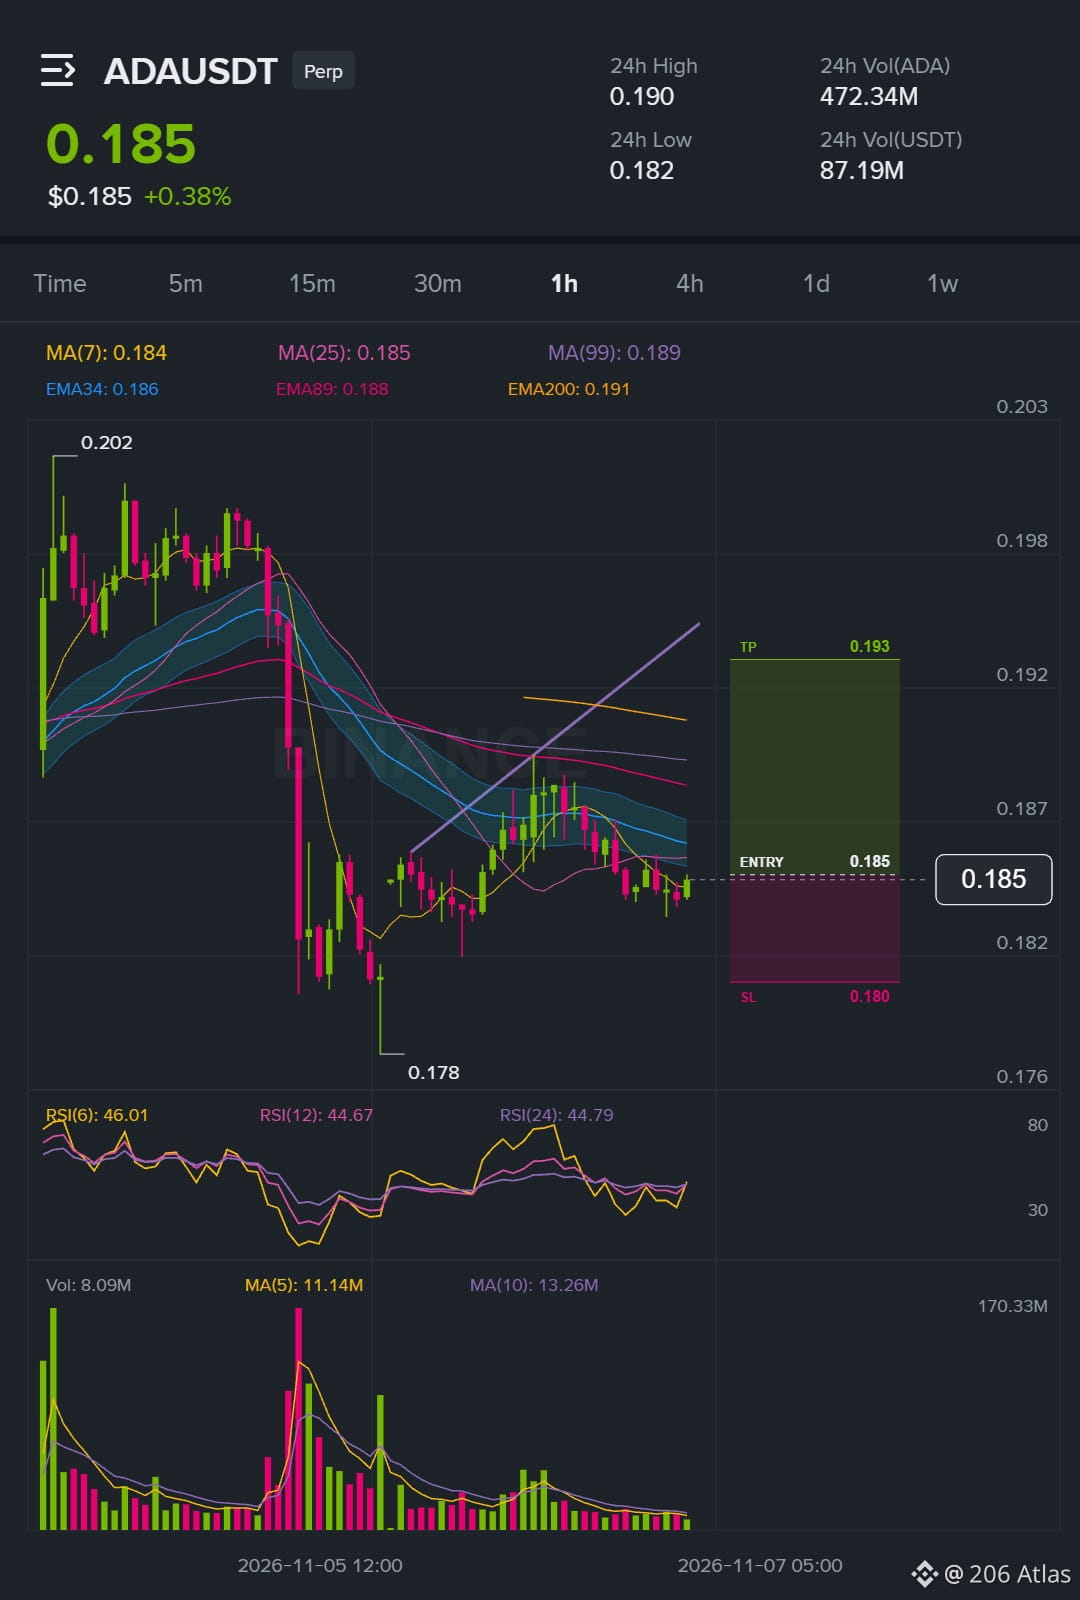
ADA is holding the same zone I posted on a few hours ago.
The 15m trend is weak and choppy, so the levels matter more than momentum. Volatility is compressed against its recent range, which can set up a bigger move. I'm back on the same direction with the trend.
$ADA /USDT - 🟢 LONG
Trade Plan:
Entry: 0.18465 – 0.18495
SL: 0.18049
TP Area: 0.18804 - 0.19343
Full chart below 👇
{future}(ADAUSDT)
Personal market analysis only. Not financial advice — manage risk and do your own research.
Next one I'm studying: $XAU
ADA is holding the same zone I posted on a few hours ago.
The 15m trend is weak and choppy, so the levels matter more than momentum. Volatility is compressed against its recent range, which can set up a bigger move. I'm back on the same direction with the trend.
$ADA /USDT - 🟢 LONG
Trade Plan:
Entry: 0.18465 – 0.18495
SL: 0.18049
TP Area: 0.18804 - 0.19343
Full chart below 👇
Personal market analysis only. Not financial advice — manage risk and do your own research.
Next one I'm studying: $XAU
The 15m trend is weak and choppy, so the levels matter more than momentum. Volatility is compressed against its recent range, which can set up a bigger move. I'm back on the same direction with the trend.
$ADA /USDT - 🟢 LONG
Trade Plan:
Entry: 0.18465 – 0.18495
SL: 0.18049
TP Area: 0.18804 - 0.19343
Full chart below 👇
Personal market analysis only. Not financial advice — manage risk and do your own research.
Next one I'm studying: $XAU
58
·
--
Bullisch
Übersetzung ansehen
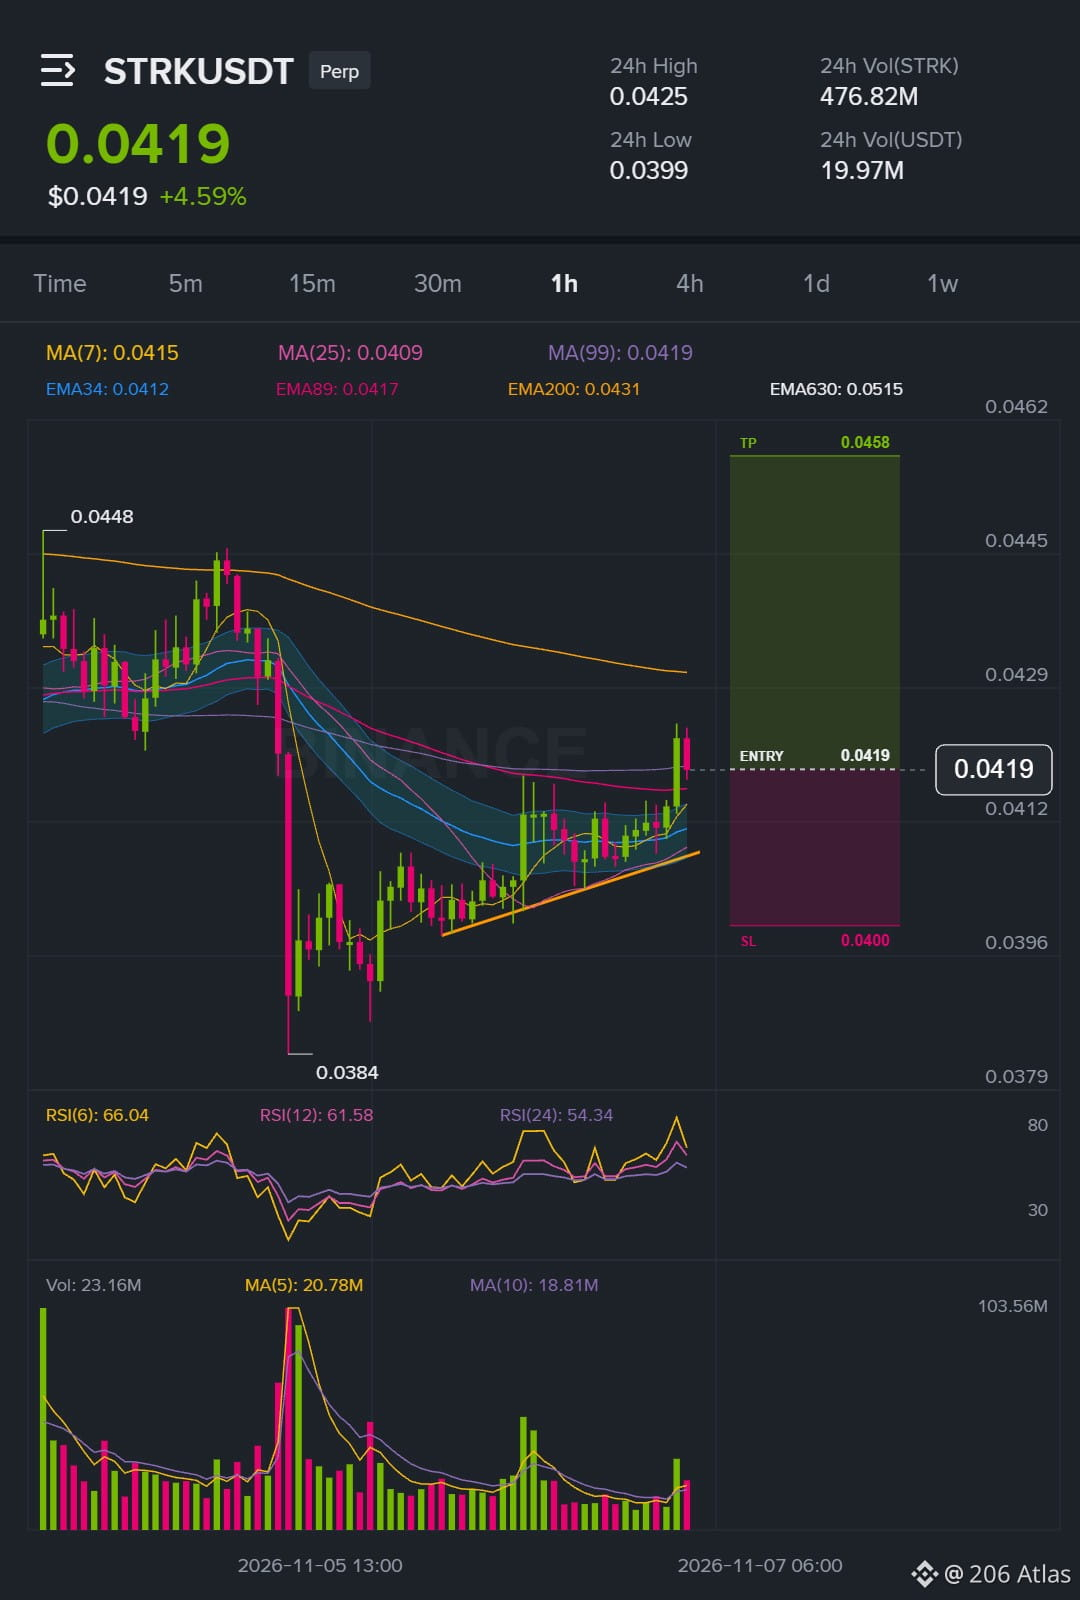
Waiting for the level to come to you is the only move that matters.
STRK is already inside the entry zone and the 1h structure is building with the trend. The setup is clean enough to size in here.
$STRK /USDT - 🟢 LONG
Trade Plan:
Entry: 0.0418245 – 0.0419755
SL: 0.0399713
TP Area: 0.0433466 - 0.0457575
Levels are marked on the chart 👇
{future}(STRKUSDT)
Personal market analysis only. Not financial advice — manage risk and do your own research.
Waiting for the level to come to you is the only move that matters.
STRK is already inside the entry zone and the 1h structure is building with the trend. The setup is clean enough to size in here.
$STRK /USDT - 🟢 LONG
Trade Plan:
Entry: 0.0418245 – 0.0419755
SL: 0.0399713
TP Area: 0.0433466 - 0.0457575
Levels are marked on the chart 👇
Personal market analysis only. Not financial advice — manage risk and do your own research.
STRK is already inside the entry zone and the 1h structure is building with the trend. The setup is clean enough to size in here.
$STRK /USDT - 🟢 LONG
Trade Plan:
Entry: 0.0418245 – 0.0419755
SL: 0.0399713
TP Area: 0.0433466 - 0.0457575
Levels are marked on the chart 👇
Personal market analysis only. Not financial advice — manage risk and do your own research.
61
·
--
Bärisch
Übersetzung ansehen
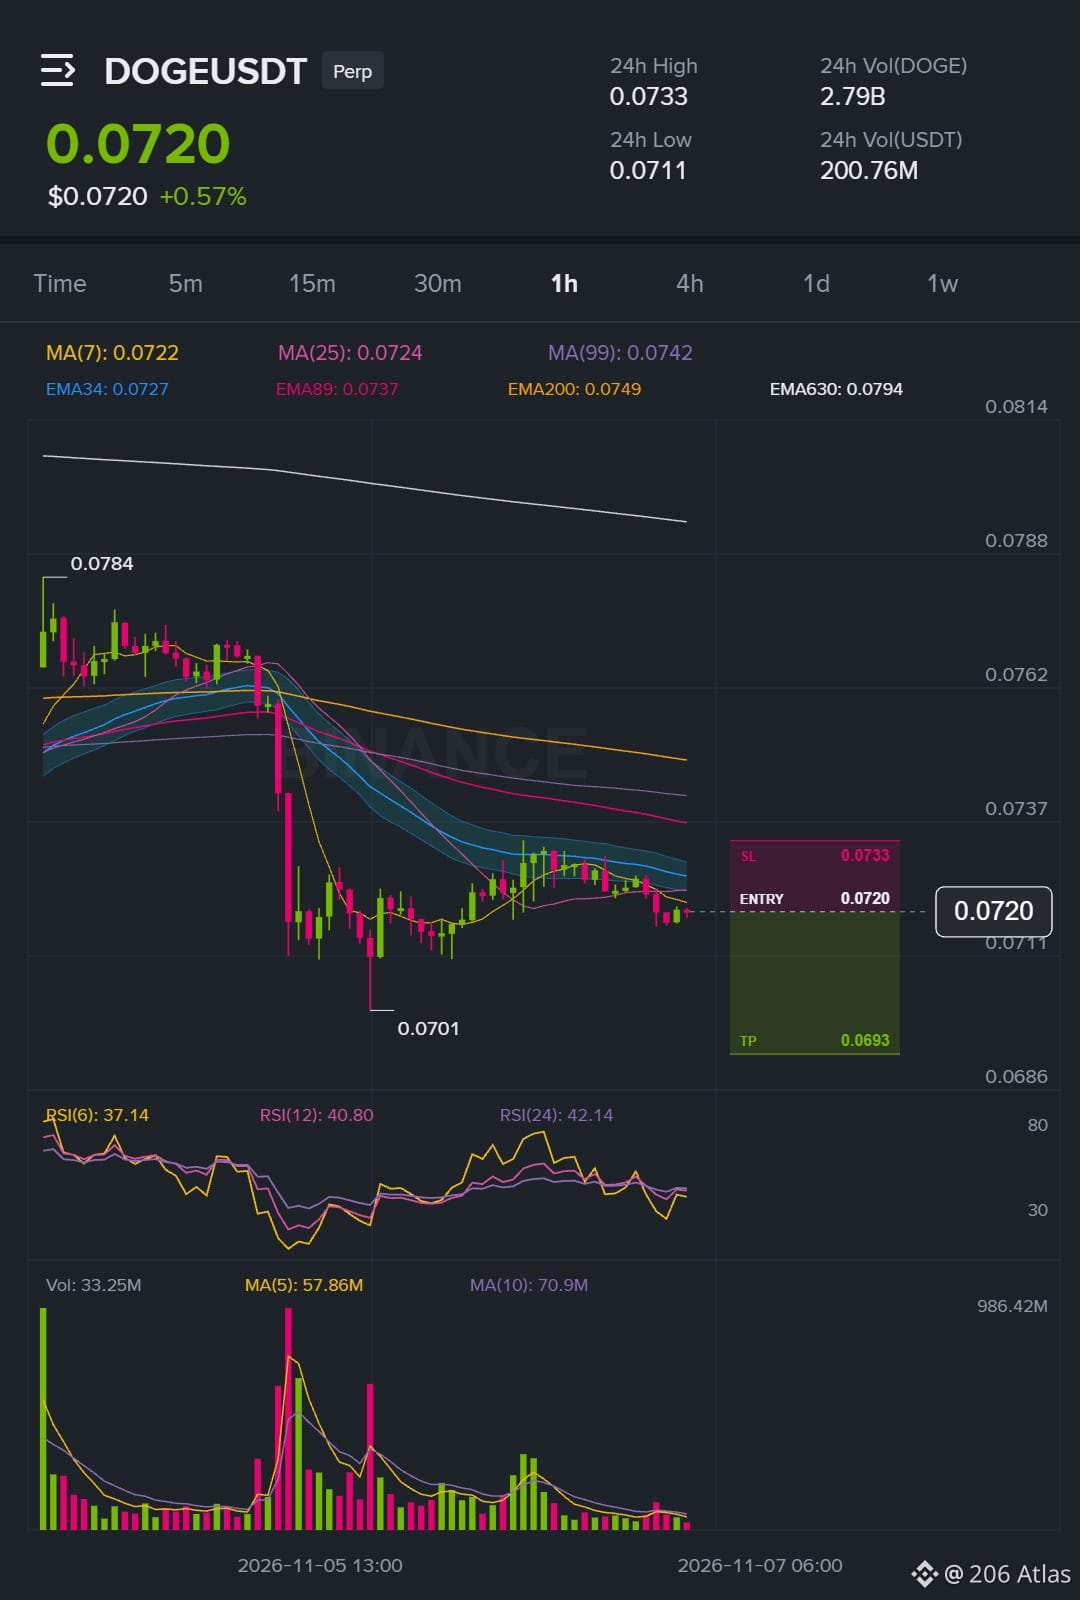
BTC is trying to bounce, but DOGE is not following.
Daily trend is bearish, so I'm trading with the bigger picture. The 15m BTC structure is bullish, which means this short deliberately fights that momentum. I changed my mind from the earlier call posted a few hours back, and the zone now sits around 0.071938 to 0.072022.
$DOGE /USDT - 🔴 SHORT
Trade Plan:
Entry: 0.071938 – 0.072022
SL: 0.073336
TP Area: 0.070963 - 0.069267
The setup has a clear invalidation level above it.
Chart with my levels 👇
{future}(DOGEUSDT)
Personal market analysis only. Not financial advice — manage risk and do your own research.
Next setup on deck: $STRK
BTC is trying to bounce, but DOGE is not following.
Daily trend is bearish, so I'm trading with the bigger picture. The 15m BTC structure is bullish, which means this short deliberately fights that momentum. I changed my mind from the earlier call posted a few hours back, and the zone now sits around 0.071938 to 0.072022.
$DOGE /USDT - 🔴 SHORT
Trade Plan:
Entry: 0.071938 – 0.072022
SL: 0.073336
TP Area: 0.070963 - 0.069267
The setup has a clear invalidation level above it.
Chart with my levels 👇
Personal market analysis only. Not financial advice — manage risk and do your own research.
Next setup on deck: $STRK
Daily trend is bearish, so I'm trading with the bigger picture. The 15m BTC structure is bullish, which means this short deliberately fights that momentum. I changed my mind from the earlier call posted a few hours back, and the zone now sits around 0.071938 to 0.072022.
$DOGE /USDT - 🔴 SHORT
Trade Plan:
Entry: 0.071938 – 0.072022
SL: 0.073336
TP Area: 0.070963 - 0.069267
The setup has a clear invalidation level above it.
Chart with my levels 👇
Personal market analysis only. Not financial advice — manage risk and do your own research.
Next setup on deck: $STRK
40
·
--
Bullisch
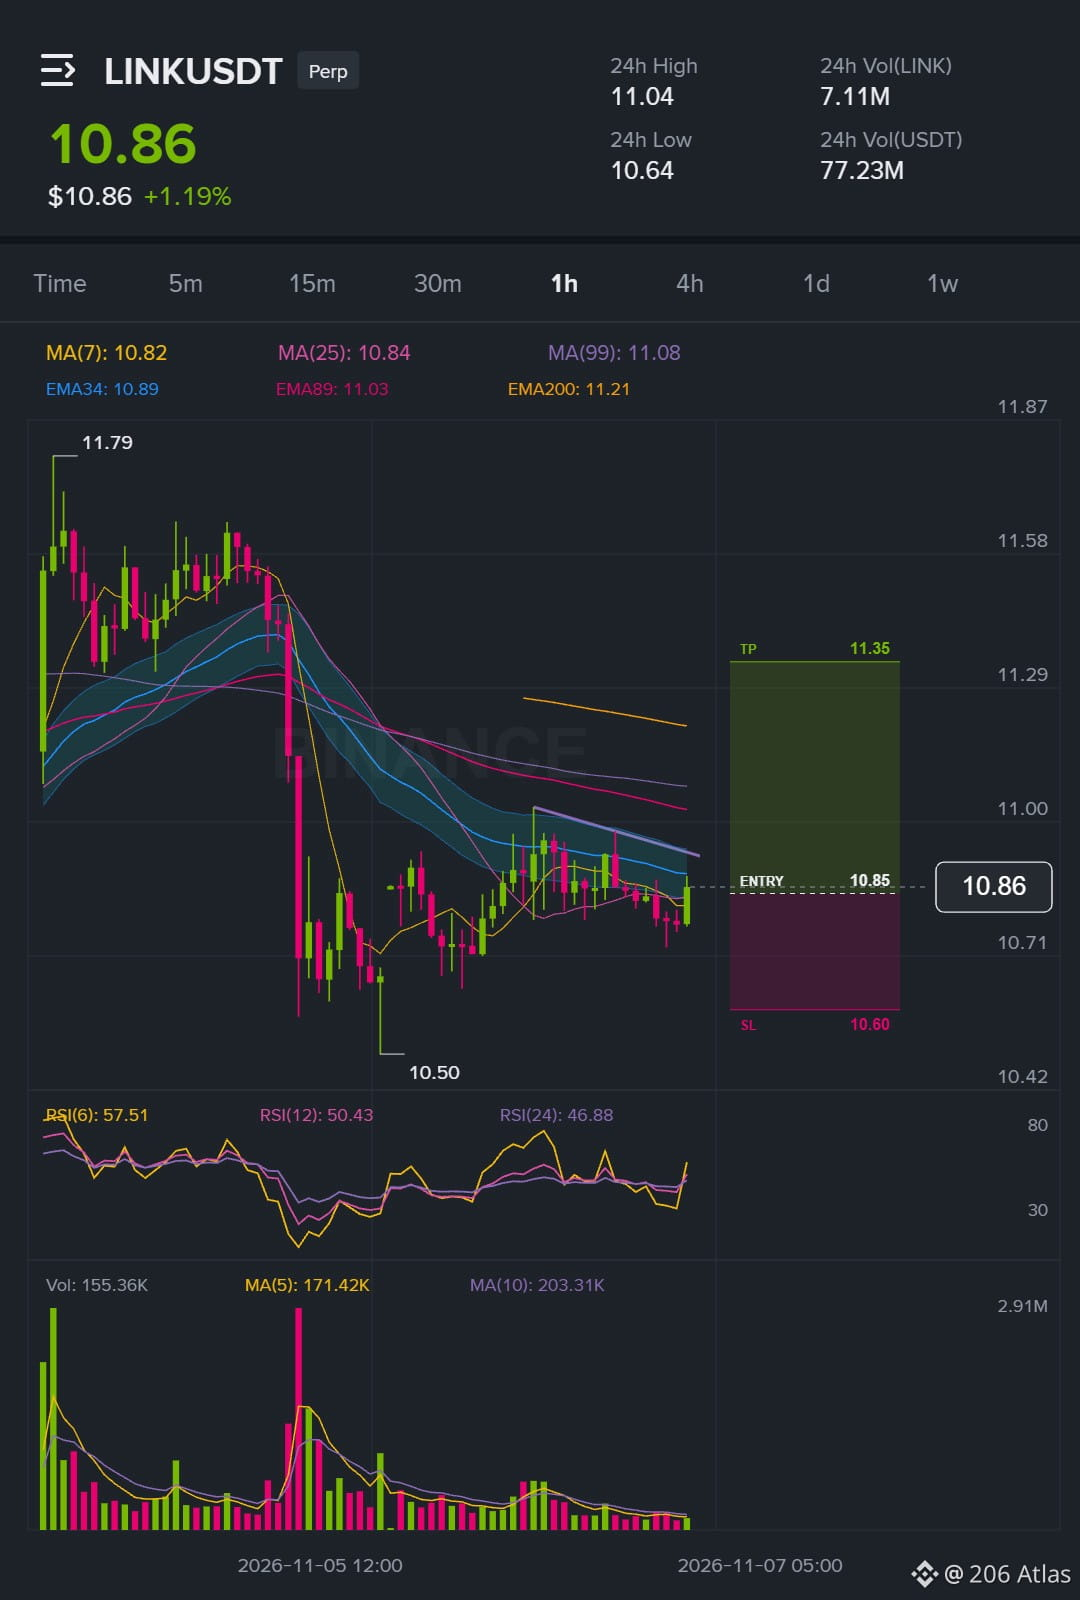
Zwei Szenarien, wie es für LINK von hier aus weitergeht.
$LINK /USDT - 🟢 LONG
Handelsplan:
Einstieg: 10.839 – 10.857
SL: 10.597
TP-Bereich: 11.036 - 11.349
LINK befindet sich in der Einstiegszone von 10.839 - 10.857, und der Plan folgt dem Trend auf dem 1h-Chart. Wenn der Kurs 11.071 respektiert und in Richtung der Ziele steigt, geht der Plan auf. Scheitert er und bleibt unter 11.071, ist die These hinfällig und du solltest dich zurückziehen.
Der Plan ist der Plan – keine emotionale Bindung nötig.
Chart mit meinen Levels 👇
{future}(LINKUSDT)
Nur persönliche Marktanalyse. Keine Finanzberatung – manage dein Risiko und recherchiere selbst.
$STRK baut etwas auf. Ich bleibe dran.
Zwei Szenarien, wie es für LINK von hier aus weitergeht.
$LINK /USDT - 🟢 LONG
Handelsplan:
Einstieg: 10.839 – 10.857
SL: 10.597
TP-Bereich: 11.036 - 11.349
LINK befindet sich in der Einstiegszone von 10.839 - 10.857, und der Plan folgt dem Trend auf dem 1h-Chart. Wenn der Kurs 11.071 respektiert und in Richtung der Ziele steigt, geht der Plan auf. Scheitert er und bleibt unter 11.071, ist die These hinfällig und du solltest dich zurückziehen.
Der Plan ist der Plan – keine emotionale Bindung nötig.
Chart mit meinen Levels 👇
Nur persönliche Marktanalyse. Keine Finanzberatung – manage dein Risiko und recherchiere selbst.
$STRK baut etwas auf. Ich bleibe dran.
$LINK /USDT - 🟢 LONG
Handelsplan:
Einstieg: 10.839 – 10.857
SL: 10.597
TP-Bereich: 11.036 - 11.349
LINK befindet sich in der Einstiegszone von 10.839 - 10.857, und der Plan folgt dem Trend auf dem 1h-Chart. Wenn der Kurs 11.071 respektiert und in Richtung der Ziele steigt, geht der Plan auf. Scheitert er und bleibt unter 11.071, ist die These hinfällig und du solltest dich zurückziehen.
Der Plan ist der Plan – keine emotionale Bindung nötig.
Chart mit meinen Levels 👇
Nur persönliche Marktanalyse. Keine Finanzberatung – manage dein Risiko und recherchiere selbst.
$STRK baut etwas auf. Ich bleibe dran.
67
·
--
Bärisch
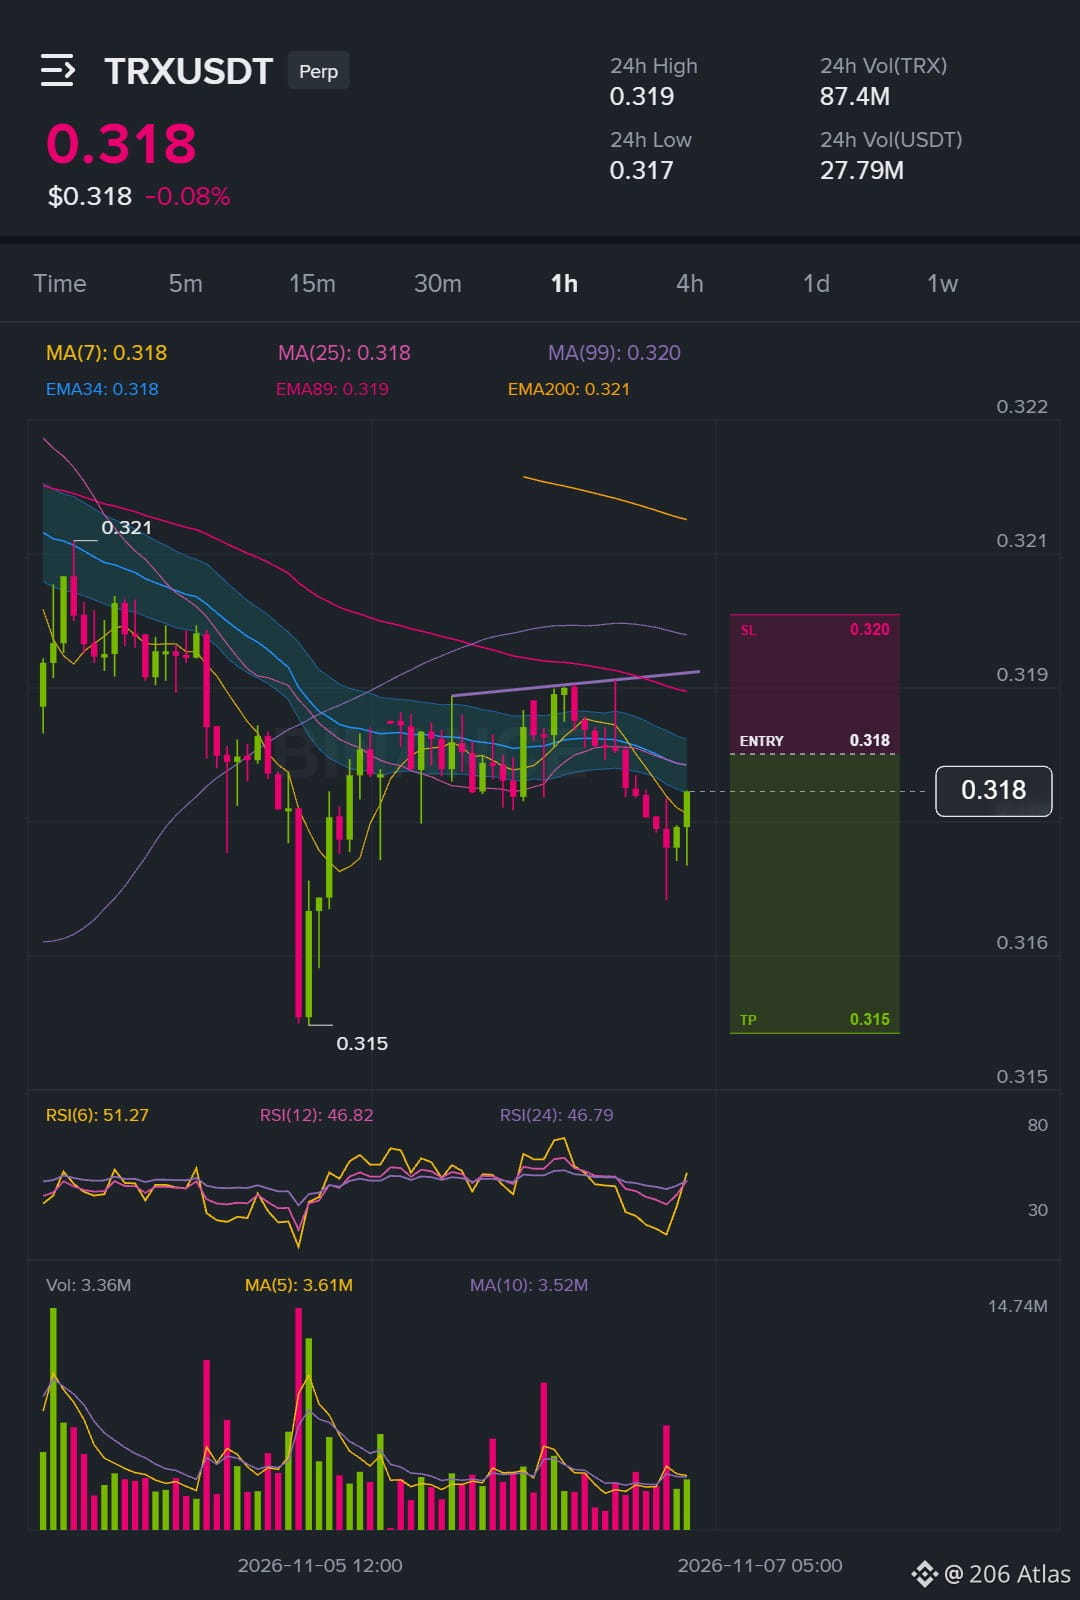
$TRX /USDT – 🔴 SHORT · Konf. 37 %
Handelsplan:
Einstieg: 0.31836 – 0.31850
SL: 0.31999
TP-Bereich: 0.31726 - 0.31530
Hinweis: Die wahrscheinliche Richtung ist SHORT, aber dies ist ein Setup gegen den Trend mit geringer Bestätigung. Sei vorsichtig und halte dich strikt an den Stop-Loss.
Klicke hier, um den Chart anzusehen 👇️
{future}(TRXUSDT)
Nur persönliche Marktanalyse. Keine Finanzberatung – manage dein Risiko und recherchiere selbst.
$TRX /USDT – 🔴 SHORT · Konf. 37 %
Handelsplan:
Einstieg: 0.31836 – 0.31850
SL: 0.31999
TP-Bereich: 0.31726 - 0.31530
Hinweis: Die wahrscheinliche Richtung ist SHORT, aber dies ist ein Setup gegen den Trend mit geringer Bestätigung. Sei vorsichtig und halte dich strikt an den Stop-Loss.
Klicke hier, um den Chart anzusehen 👇️
Nur persönliche Marktanalyse. Keine Finanzberatung – manage dein Risiko und recherchiere selbst.
Handelsplan:
Einstieg: 0.31836 – 0.31850
SL: 0.31999
TP-Bereich: 0.31726 - 0.31530
Hinweis: Die wahrscheinliche Richtung ist SHORT, aber dies ist ein Setup gegen den Trend mit geringer Bestätigung. Sei vorsichtig und halte dich strikt an den Stop-Loss.
Klicke hier, um den Chart anzusehen 👇️
Nur persönliche Marktanalyse. Keine Finanzberatung – manage dein Risiko und recherchiere selbst.
73
·
--
Bullisch
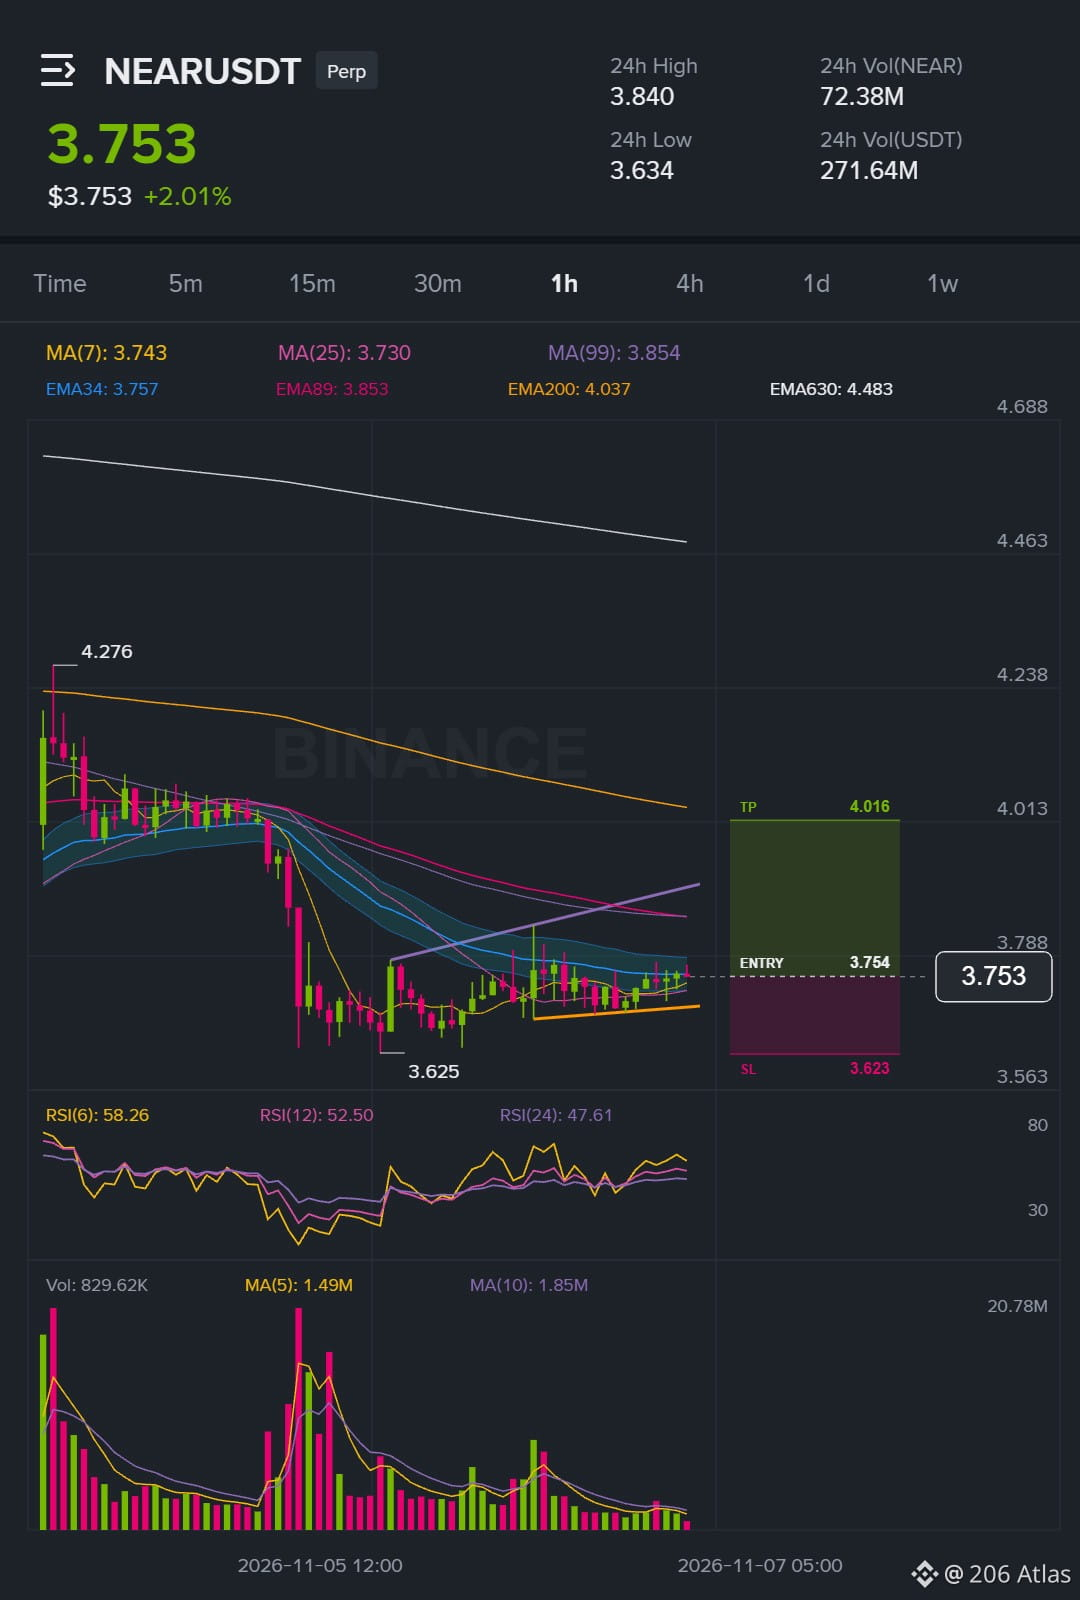
Meine Meinung zu NEAR hat sich geändert, daher hier mein Plan.
$NEAR /USDT - 🟢 LONG
Handelsplan:
Einstieg: 3.7486 – 3.7594
SL: 3.6231
TP-Bereich: 3.8522 - 4.0158
Vorsicht: Der 15-Minuten-Trend ist schwach und unbeständig. Daher orientiere ich mich an den Kursmarken statt am Momentum, solange der BTC-Trend weiterhin bullisch ist. Ich gehe mit einer kleineren Positionsgröße vor und halte mich an den Stop-Loss.
Klicke hier, um den Chart anzusehen 👇️
{future}(NEARUSDT)
Nur meine persönliche Marktanalyse. Keine Anlageberatung – manage dein Risiko und recherchiere selbst.
$TRX ist das nächste Setup, das ich veröffentliche.
Meine Meinung zu NEAR hat sich geändert, daher hier mein Plan.
$NEAR /USDT - 🟢 LONG
Handelsplan:
Einstieg: 3.7486 – 3.7594
SL: 3.6231
TP-Bereich: 3.8522 - 4.0158
Vorsicht: Der 15-Minuten-Trend ist schwach und unbeständig. Daher orientiere ich mich an den Kursmarken statt am Momentum, solange der BTC-Trend weiterhin bullisch ist. Ich gehe mit einer kleineren Positionsgröße vor und halte mich an den Stop-Loss.
Klicke hier, um den Chart anzusehen 👇️
Nur meine persönliche Marktanalyse. Keine Anlageberatung – manage dein Risiko und recherchiere selbst.
$TRX ist das nächste Setup, das ich veröffentliche.
$NEAR /USDT - 🟢 LONG
Handelsplan:
Einstieg: 3.7486 – 3.7594
SL: 3.6231
TP-Bereich: 3.8522 - 4.0158
Vorsicht: Der 15-Minuten-Trend ist schwach und unbeständig. Daher orientiere ich mich an den Kursmarken statt am Momentum, solange der BTC-Trend weiterhin bullisch ist. Ich gehe mit einer kleineren Positionsgröße vor und halte mich an den Stop-Loss.
Klicke hier, um den Chart anzusehen 👇️
Nur meine persönliche Marktanalyse. Keine Anlageberatung – manage dein Risiko und recherchiere selbst.
$TRX ist das nächste Setup, das ich veröffentliche.
25
·
--
Bärisch
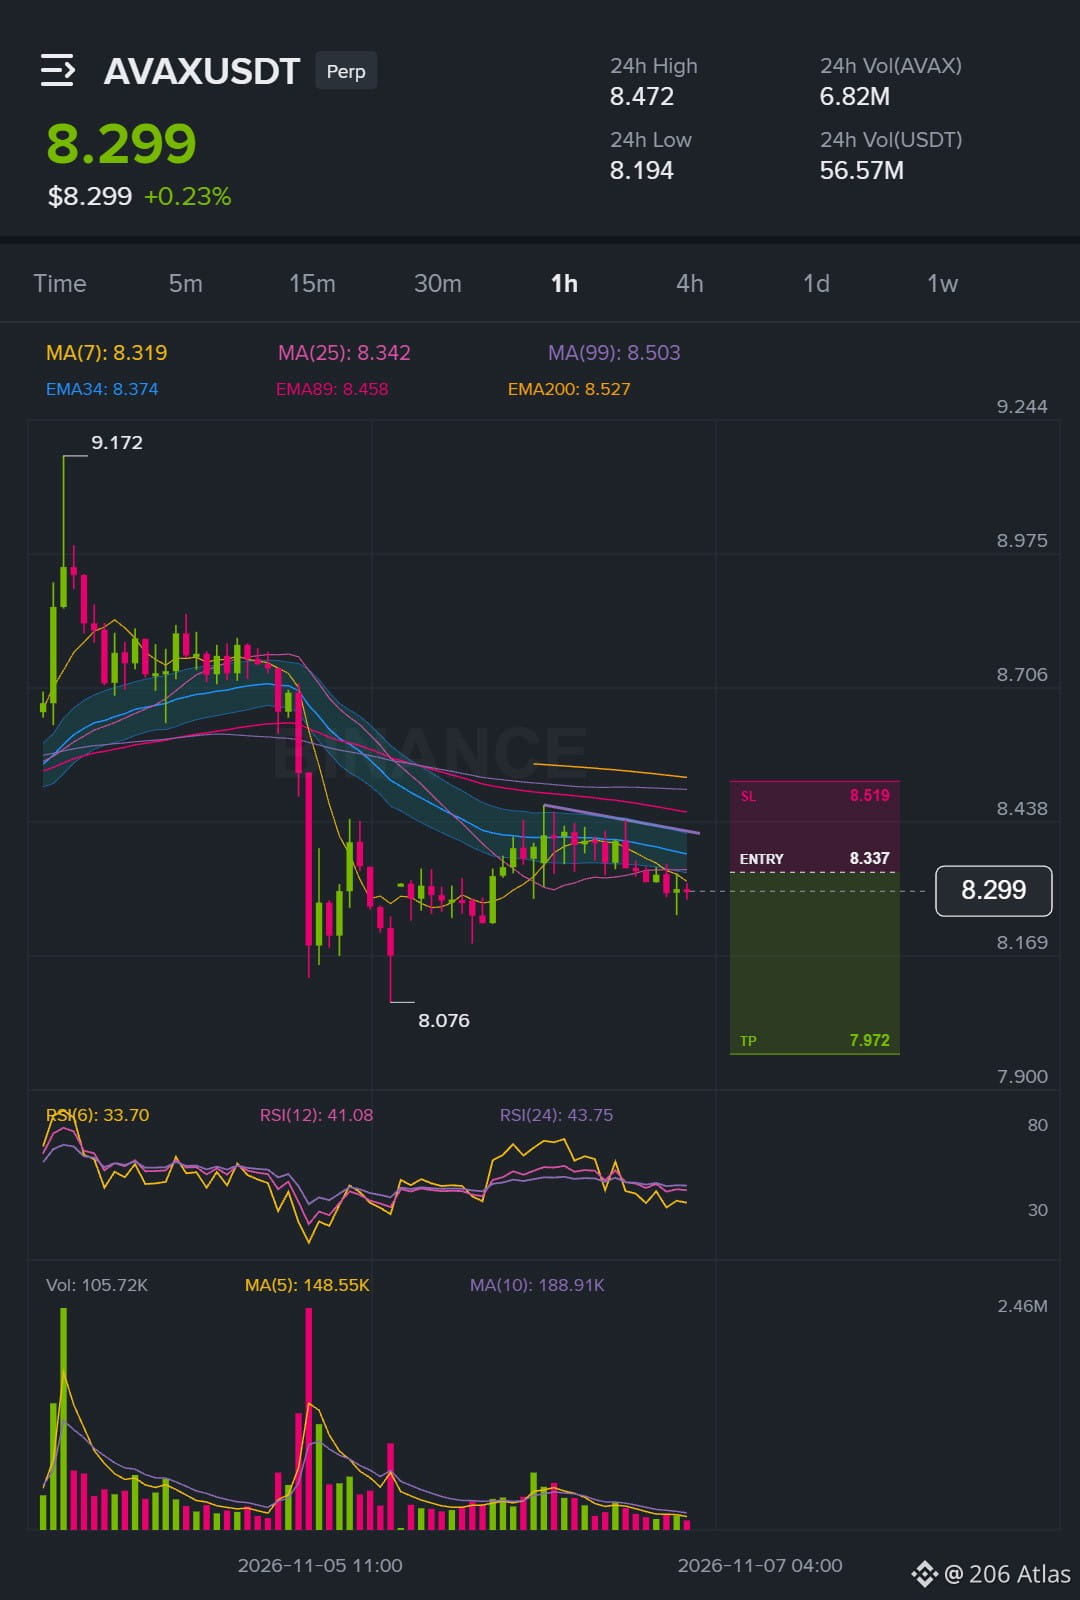
AVAX sieht nach einem einfachen Bounce aus, aber die Struktur spricht dagegen.
Der Preis befindet sich bereits in der Einstiegszone, daher habe ich meine Einschätzung von vor ein paar Stunden geändert. Die Volatilität ist im Vergleich zur jüngsten Handelsspanne komprimiert, und da der Trend intakt ist, dürfte eine größere Bewegung folgen. Ich betrachte das Niveau 8.3370 als Short-Setup und nicht als Rücksetzer, den man aussitzen sollte.
$AVAX /USDT - 🔴 SHORT
Handelsplan:
Einstieg: 8.3298 – 8.3442
SL: 8.5194
TP-Bereich: 8.2002 - 7.9722
So sieht es im Chart aus 👇
{future}(AVAXUSDT)
Nur eine persönliche Marktanalyse. Keine Finanzberatung – manage dein Risiko und recherchiere selbst.
Behalte $TRX im Auge, ich beobachte den Wert.
AVAX sieht nach einem einfachen Bounce aus, aber die Struktur spricht dagegen.
Der Preis befindet sich bereits in der Einstiegszone, daher habe ich meine Einschätzung von vor ein paar Stunden geändert. Die Volatilität ist im Vergleich zur jüngsten Handelsspanne komprimiert, und da der Trend intakt ist, dürfte eine größere Bewegung folgen. Ich betrachte das Niveau 8.3370 als Short-Setup und nicht als Rücksetzer, den man aussitzen sollte.
$AVAX /USDT - 🔴 SHORT
Handelsplan:
Einstieg: 8.3298 – 8.3442
SL: 8.5194
TP-Bereich: 8.2002 - 7.9722
So sieht es im Chart aus 👇
Nur eine persönliche Marktanalyse. Keine Finanzberatung – manage dein Risiko und recherchiere selbst.
Behalte $TRX im Auge, ich beobachte den Wert.
Der Preis befindet sich bereits in der Einstiegszone, daher habe ich meine Einschätzung von vor ein paar Stunden geändert. Die Volatilität ist im Vergleich zur jüngsten Handelsspanne komprimiert, und da der Trend intakt ist, dürfte eine größere Bewegung folgen. Ich betrachte das Niveau 8.3370 als Short-Setup und nicht als Rücksetzer, den man aussitzen sollte.
$AVAX /USDT - 🔴 SHORT
Handelsplan:
Einstieg: 8.3298 – 8.3442
SL: 8.5194
TP-Bereich: 8.2002 - 7.9722
So sieht es im Chart aus 👇
Nur eine persönliche Marktanalyse. Keine Finanzberatung – manage dein Risiko und recherchiere selbst.
Behalte $TRX im Auge, ich beobachte den Wert.
42
·
--
Bärisch
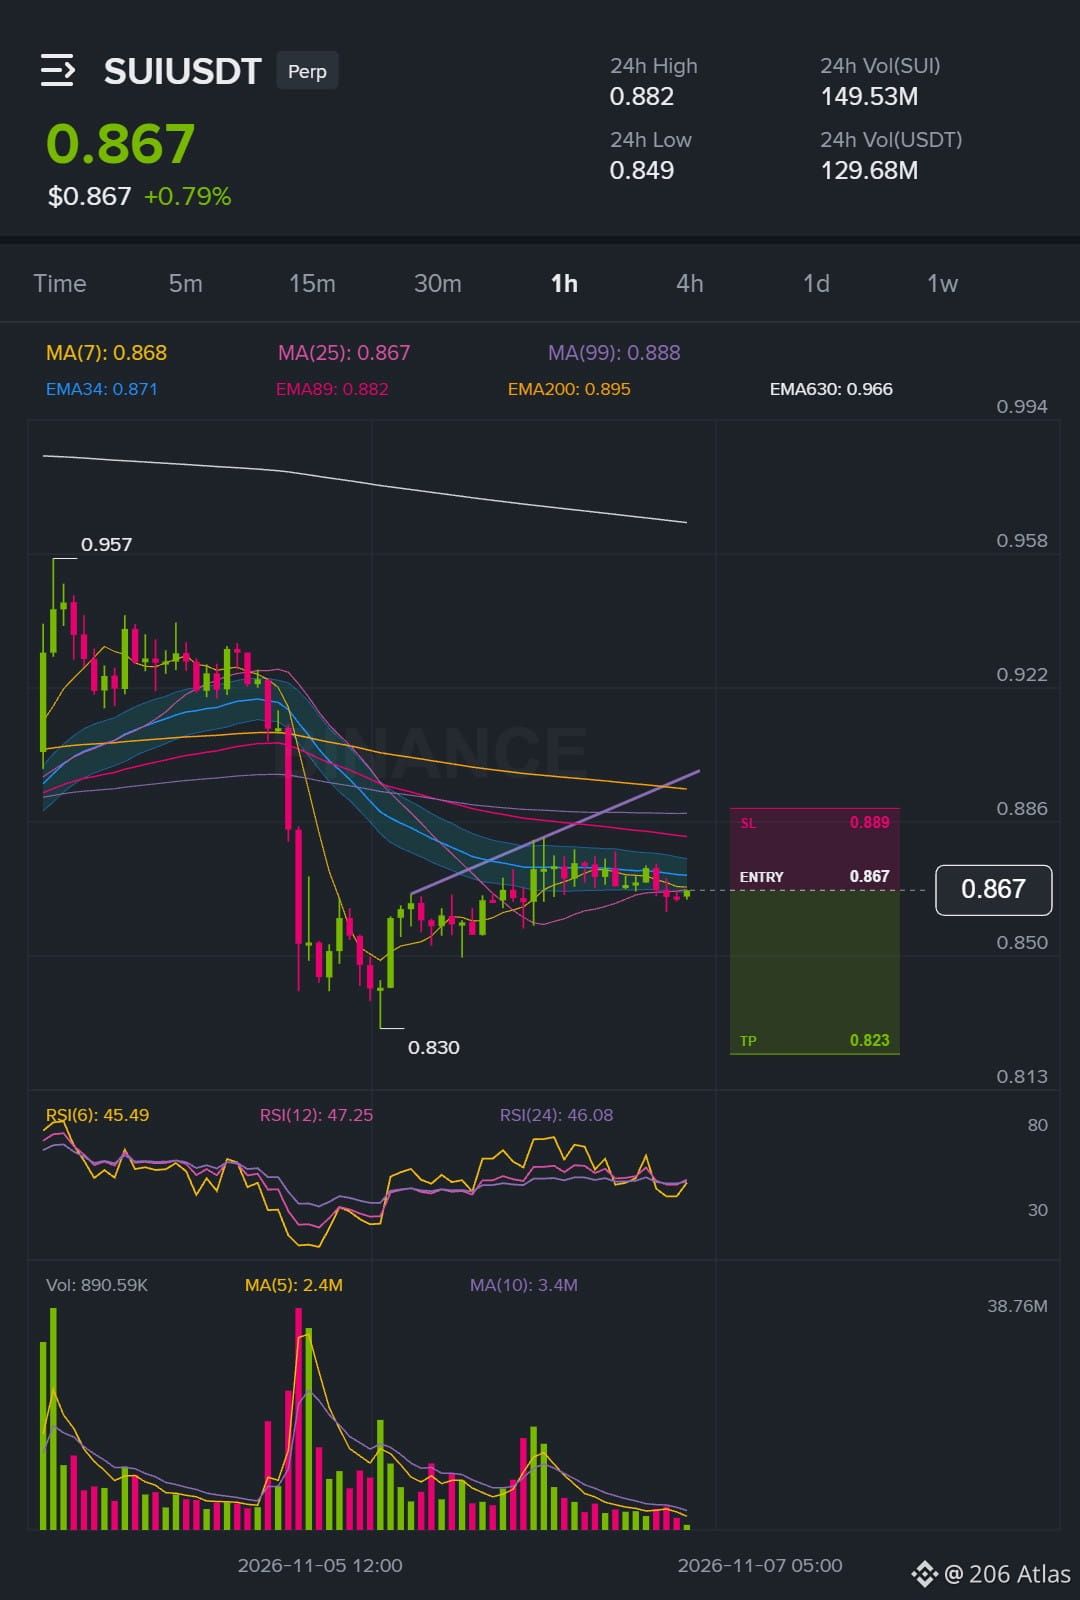
SUI befindet sich bereits innerhalb der Zone, daher gibt es keinen Grund, dem Kurs hinterherzulaufen.
Die 1h-Struktur ist weiterhin intakt und das Setup spricht für fallende Kurse. Ich jage dem Kurs hier nicht hinterher, sondern lasse ihn einfach zu den entscheidenden Levels kommen. Die Idee verliert ihren Vorteil, wenn der Kurs im 1h-Chart über 0.933705 bleibt. Der Plan ist einfach und die Ungültigkeit klar definiert.
$SUI /USDT - 🔴 SHORT
Tradeplan:
Einstieg: 0.866549 – 0.868051
SL: 0.889394
TP-Bereich: 0.850730 - 0.823112
Klicke hier, um den Chart anzusehen 👇️
{future}(SUIUSDT)
Nur meine persönliche Marktanalyse. Keine Finanzberatung – achte auf dein Risikomanagement und recherchiere selbst.
SUI befindet sich bereits innerhalb der Zone, daher gibt es keinen Grund, dem Kurs hinterherzulaufen.
Die 1h-Struktur ist weiterhin intakt und das Setup spricht für fallende Kurse. Ich jage dem Kurs hier nicht hinterher, sondern lasse ihn einfach zu den entscheidenden Levels kommen. Die Idee verliert ihren Vorteil, wenn der Kurs im 1h-Chart über 0.933705 bleibt. Der Plan ist einfach und die Ungültigkeit klar definiert.
$SUI /USDT - 🔴 SHORT
Tradeplan:
Einstieg: 0.866549 – 0.868051
SL: 0.889394
TP-Bereich: 0.850730 - 0.823112
Klicke hier, um den Chart anzusehen 👇️
Nur meine persönliche Marktanalyse. Keine Finanzberatung – achte auf dein Risikomanagement und recherchiere selbst.
Die 1h-Struktur ist weiterhin intakt und das Setup spricht für fallende Kurse. Ich jage dem Kurs hier nicht hinterher, sondern lasse ihn einfach zu den entscheidenden Levels kommen. Die Idee verliert ihren Vorteil, wenn der Kurs im 1h-Chart über 0.933705 bleibt. Der Plan ist einfach und die Ungültigkeit klar definiert.
$SUI /USDT - 🔴 SHORT
Tradeplan:
Einstieg: 0.866549 – 0.868051
SL: 0.889394
TP-Bereich: 0.850730 - 0.823112
Klicke hier, um den Chart anzusehen 👇️
Nur meine persönliche Marktanalyse. Keine Finanzberatung – achte auf dein Risikomanagement und recherchiere selbst.
26
·
--
Bullisch
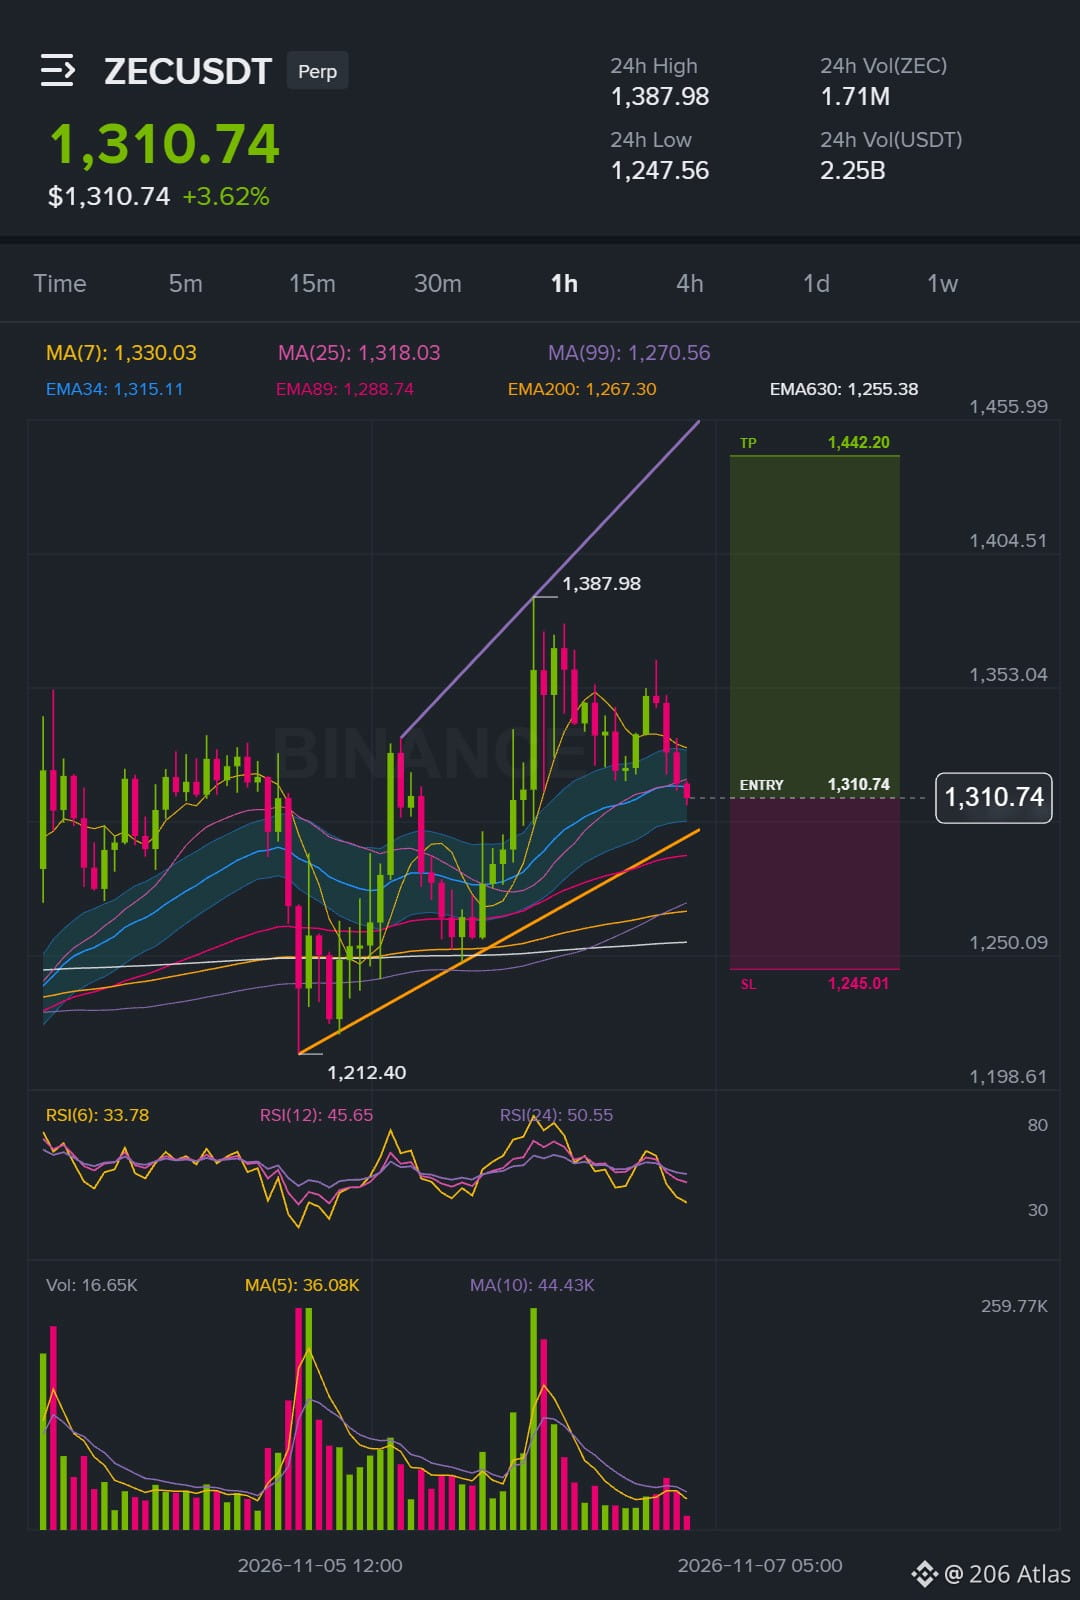
ZEC hält die Unterstützung bei 1308.14, während sich das Setup bildet 📉
$ZEC /USDT – 🟢 LONG
Handelsplan:
Einstieg: 1308.14 – 1313.34
SL: 1245.01
TP-Bereich: 1360.04 - 1442.20
Der RSI ist im Vergleich zu seiner üblichen Spanne stark nach unten gedehnt, daher ist die Dynamik weiterhin aufseiten des Trends. Das ist heute Signal Nummer 47, und ich habe vor ein paar Stunden bereits einen Beitrag zu ZEC in dieselbe Richtung veröffentlicht. Der Kurs hält sich an die Struktur, daher steige ich mit diesem Setup weiter ein.
Chart mit meinen Levels 👇
{future}(ZECUSDT)
Nur persönliche Marktanalyse. Keine Finanzberatung – manage dein Risiko und recherchiere selbst.
Als Nächstes arbeite ich am Setup $SUI .
ZEC hält die Unterstützung bei 1308.14, während sich das Setup bildet 📉
$ZEC /USDT – 🟢 LONG
Handelsplan:
Einstieg: 1308.14 – 1313.34
SL: 1245.01
TP-Bereich: 1360.04 - 1442.20
Der RSI ist im Vergleich zu seiner üblichen Spanne stark nach unten gedehnt, daher ist die Dynamik weiterhin aufseiten des Trends. Das ist heute Signal Nummer 47, und ich habe vor ein paar Stunden bereits einen Beitrag zu ZEC in dieselbe Richtung veröffentlicht. Der Kurs hält sich an die Struktur, daher steige ich mit diesem Setup weiter ein.
Chart mit meinen Levels 👇
Nur persönliche Marktanalyse. Keine Finanzberatung – manage dein Risiko und recherchiere selbst.
Als Nächstes arbeite ich am Setup $SUI .
$ZEC /USDT – 🟢 LONG
Handelsplan:
Einstieg: 1308.14 – 1313.34
SL: 1245.01
TP-Bereich: 1360.04 - 1442.20
Der RSI ist im Vergleich zu seiner üblichen Spanne stark nach unten gedehnt, daher ist die Dynamik weiterhin aufseiten des Trends. Das ist heute Signal Nummer 47, und ich habe vor ein paar Stunden bereits einen Beitrag zu ZEC in dieselbe Richtung veröffentlicht. Der Kurs hält sich an die Struktur, daher steige ich mit diesem Setup weiter ein.
Chart mit meinen Levels 👇
Nur persönliche Marktanalyse. Keine Finanzberatung – manage dein Risiko und recherchiere selbst.
Als Nächstes arbeite ich am Setup $SUI .
23
·
--
Bärisch
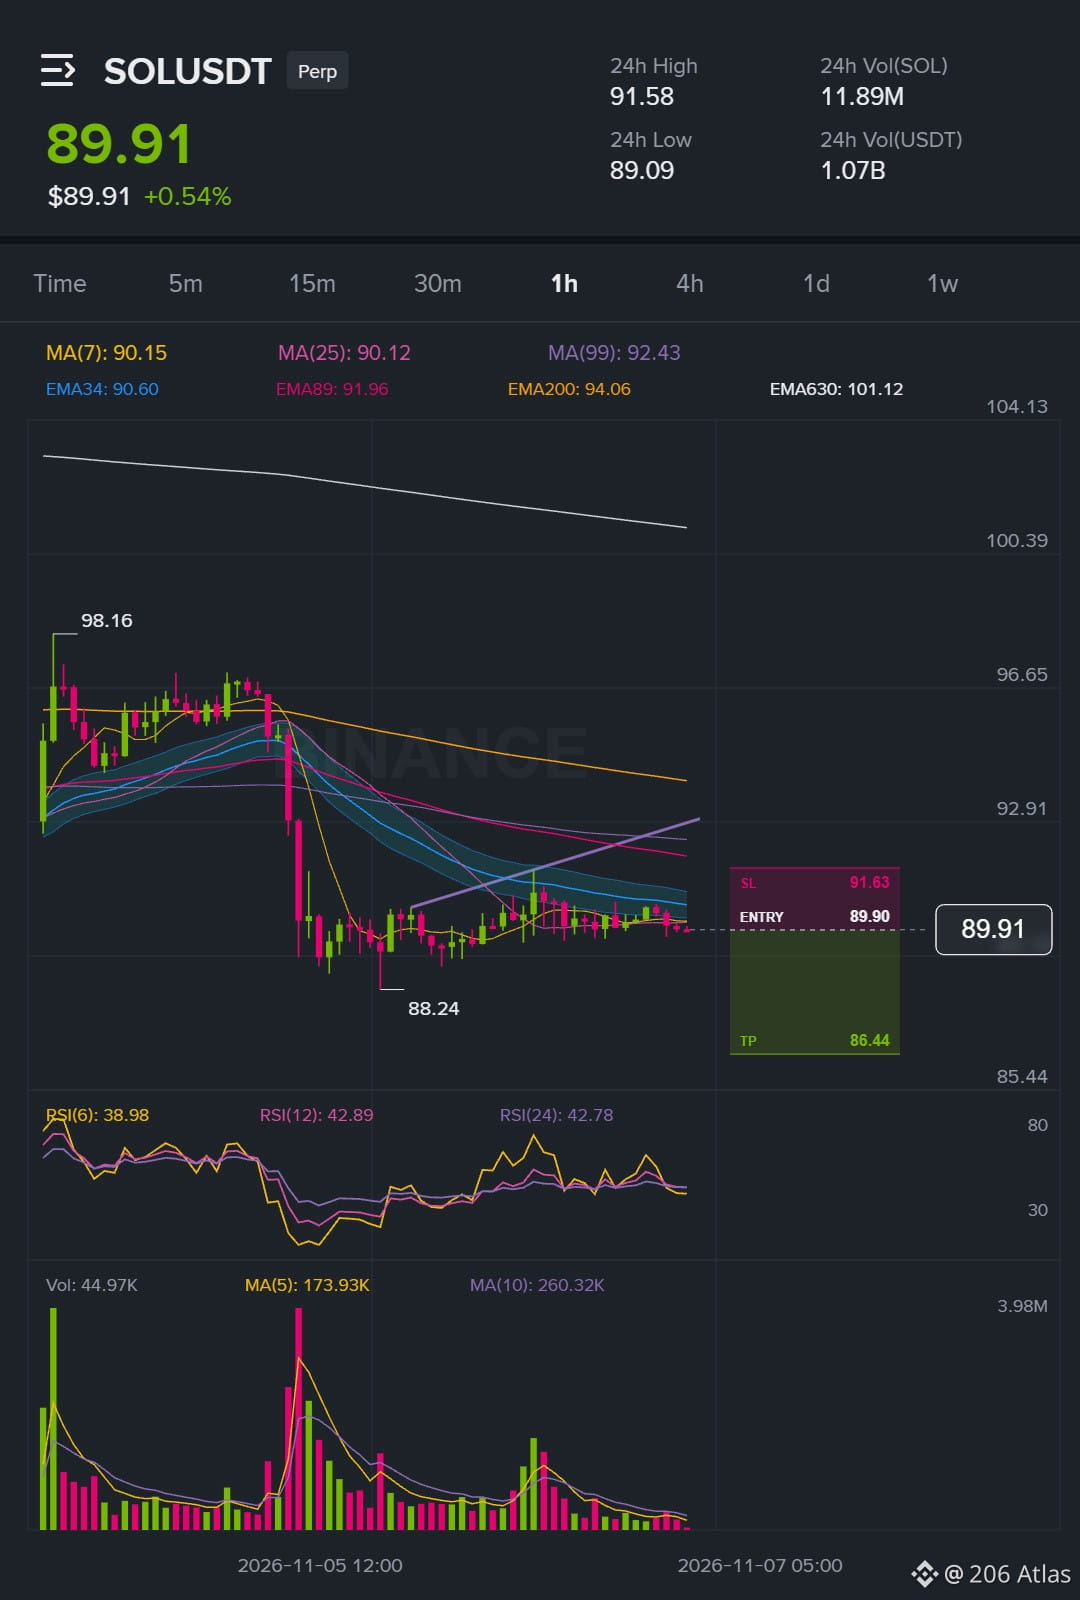
Eine weitere ruhige Session, also lasse ich den Chart wieder auf mich zukommen.
SOL befindet sich bereits in der Einstiegszone und die 1h-Struktur schwächt sich weiter ab, daher passt der Short-Plan zum Trend. Die Einschätzung ändert sich, wenn der Kurs auf der 1h über 95.0430 bleibt – damit wäre das Setup vollständig hinfällig.
$SOL /USDT - 🔴 SHORT
Trade-Plan:
Einstieg: 89.8441 – 89.9559
SL: 91.6306
TP-Bereich: 88.6021 - 86.4389
Der vollständige Chart unten 👇
{future}(SOLUSDT)
Nur meine persönliche Marktanalyse. Keine Finanzberatung – manage dein Risiko und recherchiere selbst.
Eine weitere ruhige Session, also lasse ich den Chart wieder auf mich zukommen.
SOL befindet sich bereits in der Einstiegszone und die 1h-Struktur schwächt sich weiter ab, daher passt der Short-Plan zum Trend. Die Einschätzung ändert sich, wenn der Kurs auf der 1h über 95.0430 bleibt – damit wäre das Setup vollständig hinfällig.
$SOL /USDT - 🔴 SHORT
Trade-Plan:
Einstieg: 89.8441 – 89.9559
SL: 91.6306
TP-Bereich: 88.6021 - 86.4389
Der vollständige Chart unten 👇
Nur meine persönliche Marktanalyse. Keine Finanzberatung – manage dein Risiko und recherchiere selbst.
SOL befindet sich bereits in der Einstiegszone und die 1h-Struktur schwächt sich weiter ab, daher passt der Short-Plan zum Trend. Die Einschätzung ändert sich, wenn der Kurs auf der 1h über 95.0430 bleibt – damit wäre das Setup vollständig hinfällig.
$SOL /USDT - 🔴 SHORT
Trade-Plan:
Einstieg: 89.8441 – 89.9559
SL: 91.6306
TP-Bereich: 88.6021 - 86.4389
Der vollständige Chart unten 👇
Nur meine persönliche Marktanalyse. Keine Finanzberatung – manage dein Risiko und recherchiere selbst.
84
Anmelden und weiter Inhalte entdecken
Krypto-Nutzer weltweit auf Binance Square kennenlernen
⚡️ Bleib in Sachen Krypto stets am Puls.
💬 Die weltgrößte Kryptobörse vertraut darauf.
👍 Erhalte verlässliche Einblicke von verifizierten Creators.
E-Mail-Adresse/Telefonnummer
Trendthemen
JobsReportRaisesHikeOdds
226,188 Aufrufe
1,824 Kommentare
TradFi-News | USA schaffen im Oktober 165.000 Stellen – mehr als doppelt so viele wie die prognostizierten 65.000 –, während die Arbeitslosenquote auf 4,1 % sinkt
Binance News
·30 Likes
·21.1k Aufrufe
CPITestsDecemberRateOutlook
12,504 Aufrufe
181 Kommentare
BitcoinRebounds$75KAsChipsLead
19,541 Aufrufe
210 Kommentare