

Huutruong
10.3k Beiträge

Huutruong
Melden
Nutzer blockieren
💰 Theo dõi Crypto | Tìm kiếm cơ hội mỗi ngày ( KITE-277880 )
Trade eröffnen
Regelmäßiger Trader
5.5 Jahre
3.6K+ Following
2.4K+ Follower
846 Like gegeben
Beiträge
Portfolio
Alle
Zitierungen
Videos
Live
·
--
Bullisch
Übersetzung ansehen
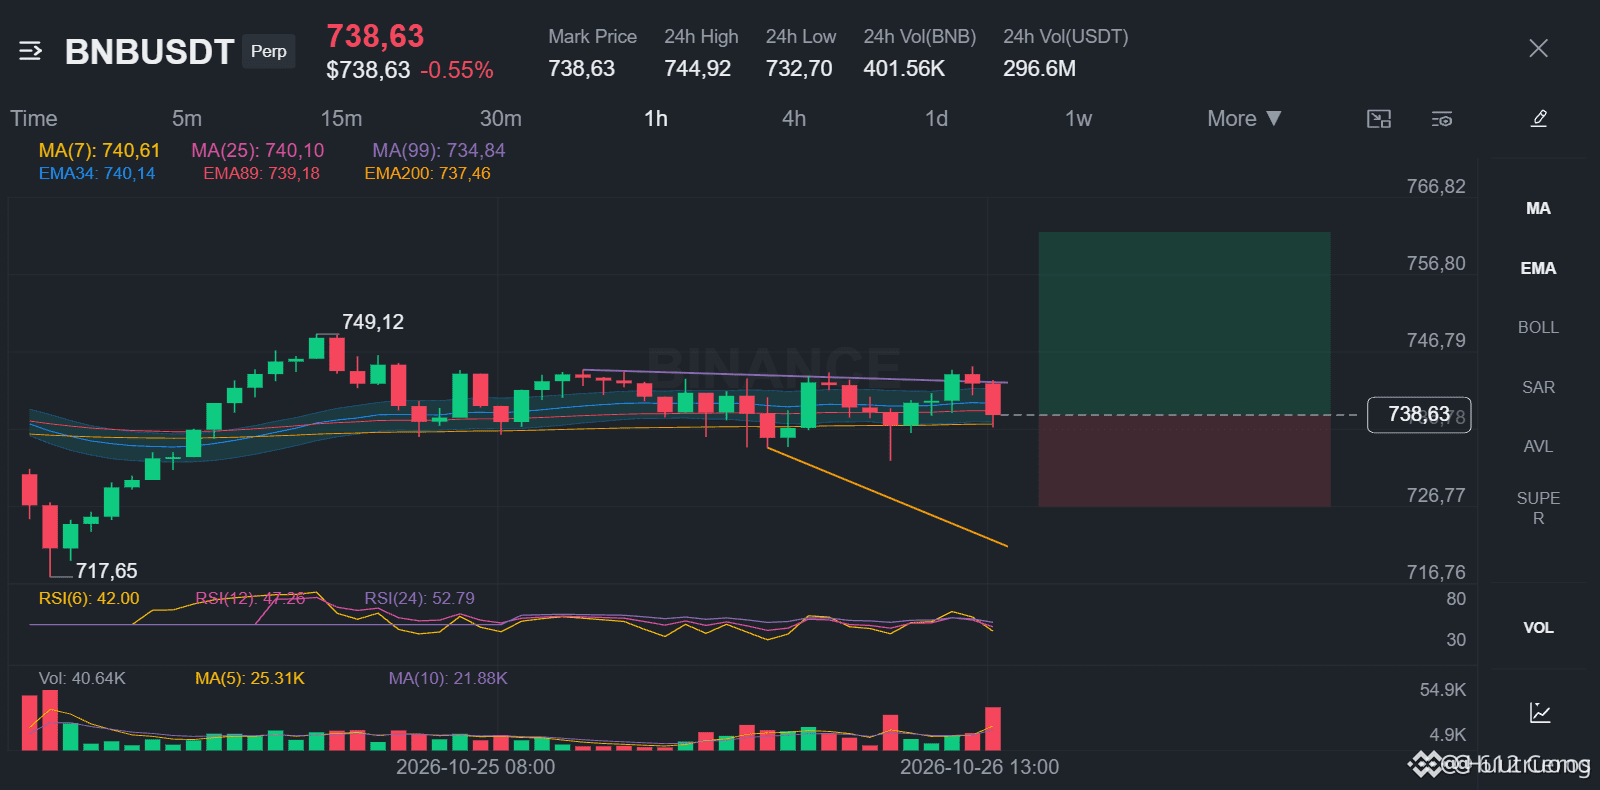
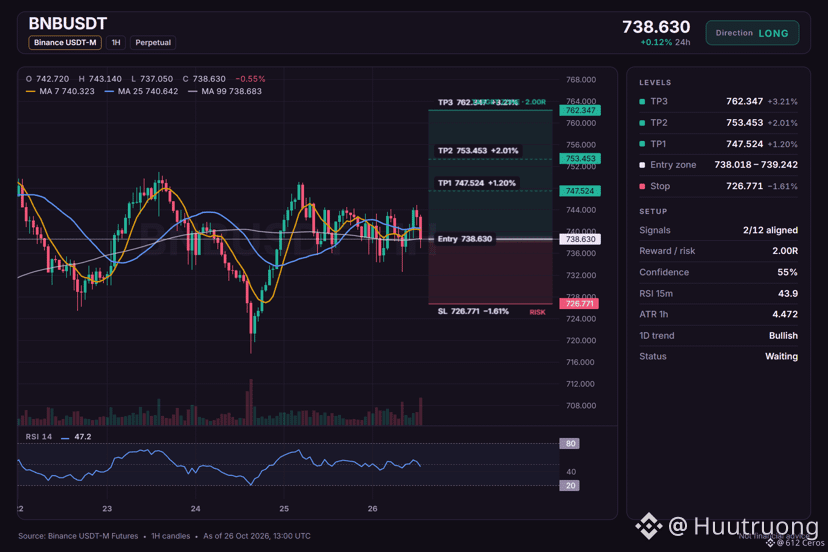
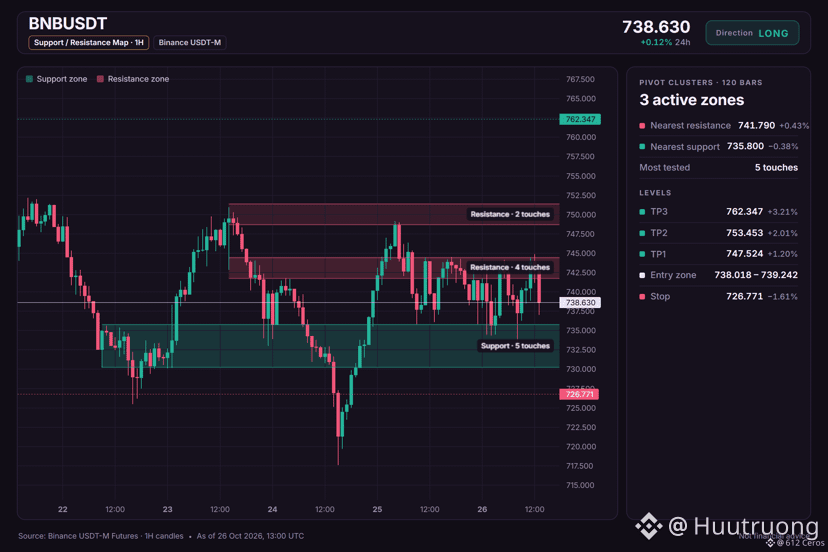
🟢 LONG $BNB /USDT: expecting price to go UP
Bias: LONG · Leaning
Entry: 738.018 – 739.242
TP1: 747.524 (+1.2%)
TP2: 753.453 (+2.0%)
TP3: 762.347 (+3.2%)
SL: 726.771 (-1.6%)
Plan: enter only inside the zone, close 50% at TP1, 25% at TP2, 25% at TP3, and move the stop to entry after TP1.
Note: moderate conviction only, keep size light.
BNB long setup with moderate conviction
Why LONG? 2/12 signals agree, 1 against.
• Daily trend up (above EMA50 & EMA200)
• Buyers have the momentum (4h RSI 55.2)
Risk: BTC is falling, this coin follows (corr 0.89)
The daily trend is bullish and the 4h RSI shows buyers have momentum, but BTC is falling and this coin often follows.
Where do you invalidate this long?
{spot}(BNBUSDT)
🟢 LONG $BNB /USDT: expecting price to go UP
Bias: LONG · Leaning
Entry: 738.018 – 739.242
TP1: 747.524 (+1.2%)
TP2: 753.453 (+2.0%)
TP3: 762.347 (+3.2%)
SL: 726.771 (-1.6%)
Plan: enter only inside the zone, close 50% at TP1, 25% at TP2, 25% at TP3, and move the stop to entry after TP1.
Note: moderate conviction only, keep size light.
BNB long setup with moderate conviction
Why LONG? 2/12 signals agree, 1 against.
• Daily trend up (above EMA50 & EMA200)
• Buyers have the momentum (4h RSI 55.2)
Risk: BTC is falling, this coin follows (corr 0.89)
The daily trend is bullish and the 4h RSI shows buyers have momentum, but BTC is falling and this coin often follows.
Where do you invalidate this long?
5
·
--
Bärisch
Übersetzung ansehen
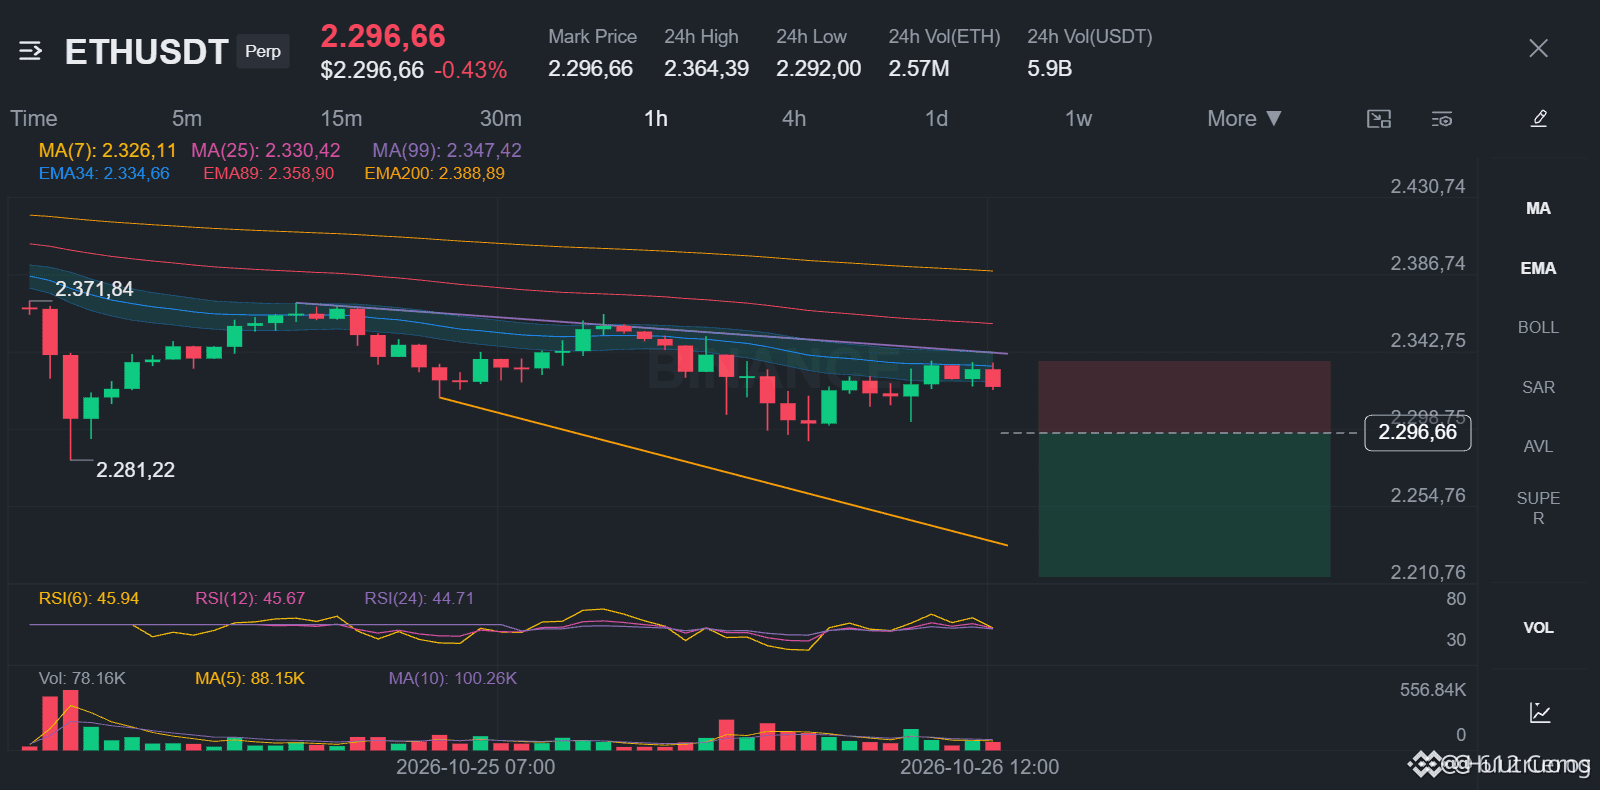
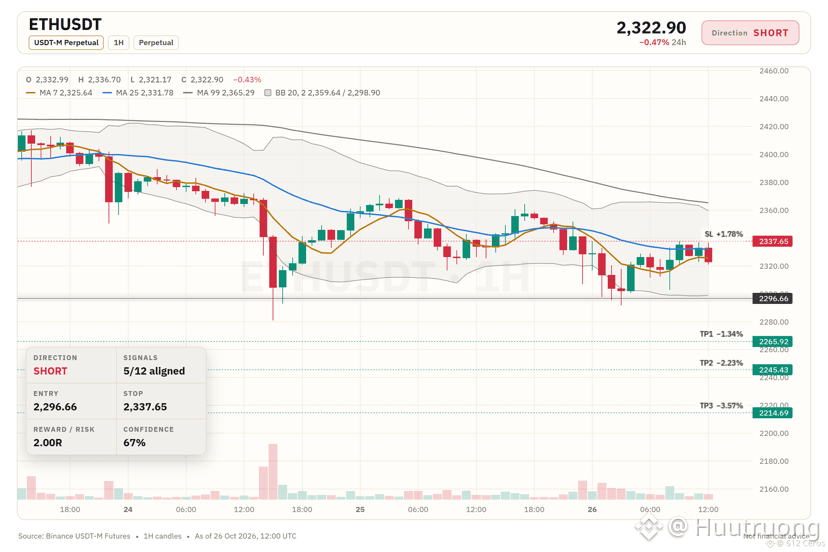
ETH is range-bound, not weak enough to sell yet.
🔴 SHORT $ETH /USDT: expecting price to go DOWN
Bias: SHORT · Leaning
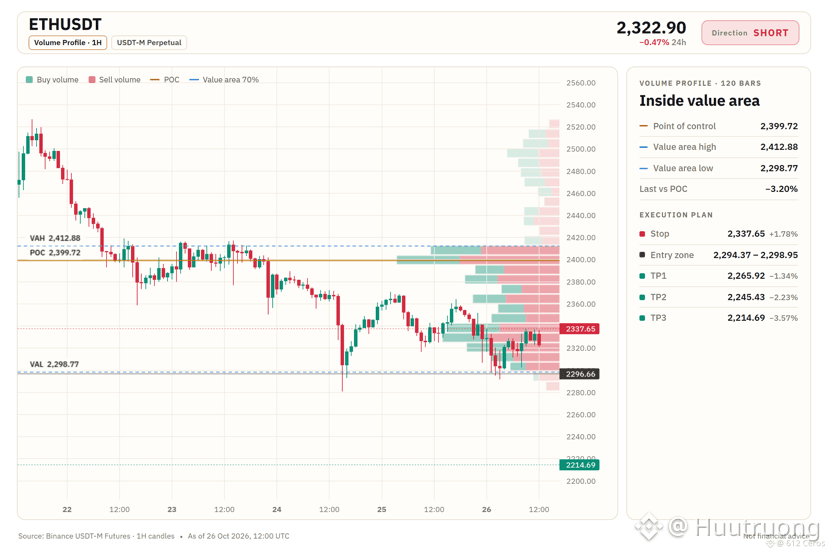
Entry: 2294.37 – 2298.95
TP1: 2265.92 (-1.3%)
TP2: 2245.43 (-2.2%)
TP3: 2214.69 (-3.6%)
SL: 2337.65 (+1.8%)
Plan: enter only inside the zone, close 50% at TP1, 25% at TP2, 25% at TP3, and move the stop to entry after TP1.
Note: moderate conviction only, keep size light.
Why SHORT? 5/12 signals agree, 0 against.
• 4h trend down (below EMA50 & EMA200)
• 1h trend down (below EMA50 & EMA200)
• Sellers have the momentum (4h RSI 42.4)
Journal note: ETH
I'm watching ETH with a short bias because the 4h trend is down and the 1h trend is down. I want to see price push below the 1h price of 2296.66 with the daily trend still mixed in a range. The strongest signal is the 4h bearish stack, but the daily trend is range, so conviction is moderate.
Where would you put your invalidation level?
{spot}(ETHUSDT)
ETH is range-bound, not weak enough to sell yet.
🔴 SHORT $ETH /USDT: expecting price to go DOWN
Bias: SHORT · Leaning
Entry: 2294.37 – 2298.95
TP1: 2265.92 (-1.3%)
TP2: 2245.43 (-2.2%)
TP3: 2214.69 (-3.6%)
SL: 2337.65 (+1.8%)
Plan: enter only inside the zone, close 50% at TP1, 25% at TP2, 25% at TP3, and move the stop to entry after TP1.
Note: moderate conviction only, keep size light.
Why SHORT? 5/12 signals agree, 0 against.
• 4h trend down (below EMA50 & EMA200)
• 1h trend down (below EMA50 & EMA200)
• Sellers have the momentum (4h RSI 42.4)
Journal note: ETH
I'm watching ETH with a short bias because the 4h trend is down and the 1h trend is down. I want to see price push below the 1h price of 2296.66 with the daily trend still mixed in a range. The strongest signal is the 4h bearish stack, but the daily trend is range, so conviction is moderate.
Where would you put your invalidation level?
8
·
--
Bärisch
Übersetzung ansehen
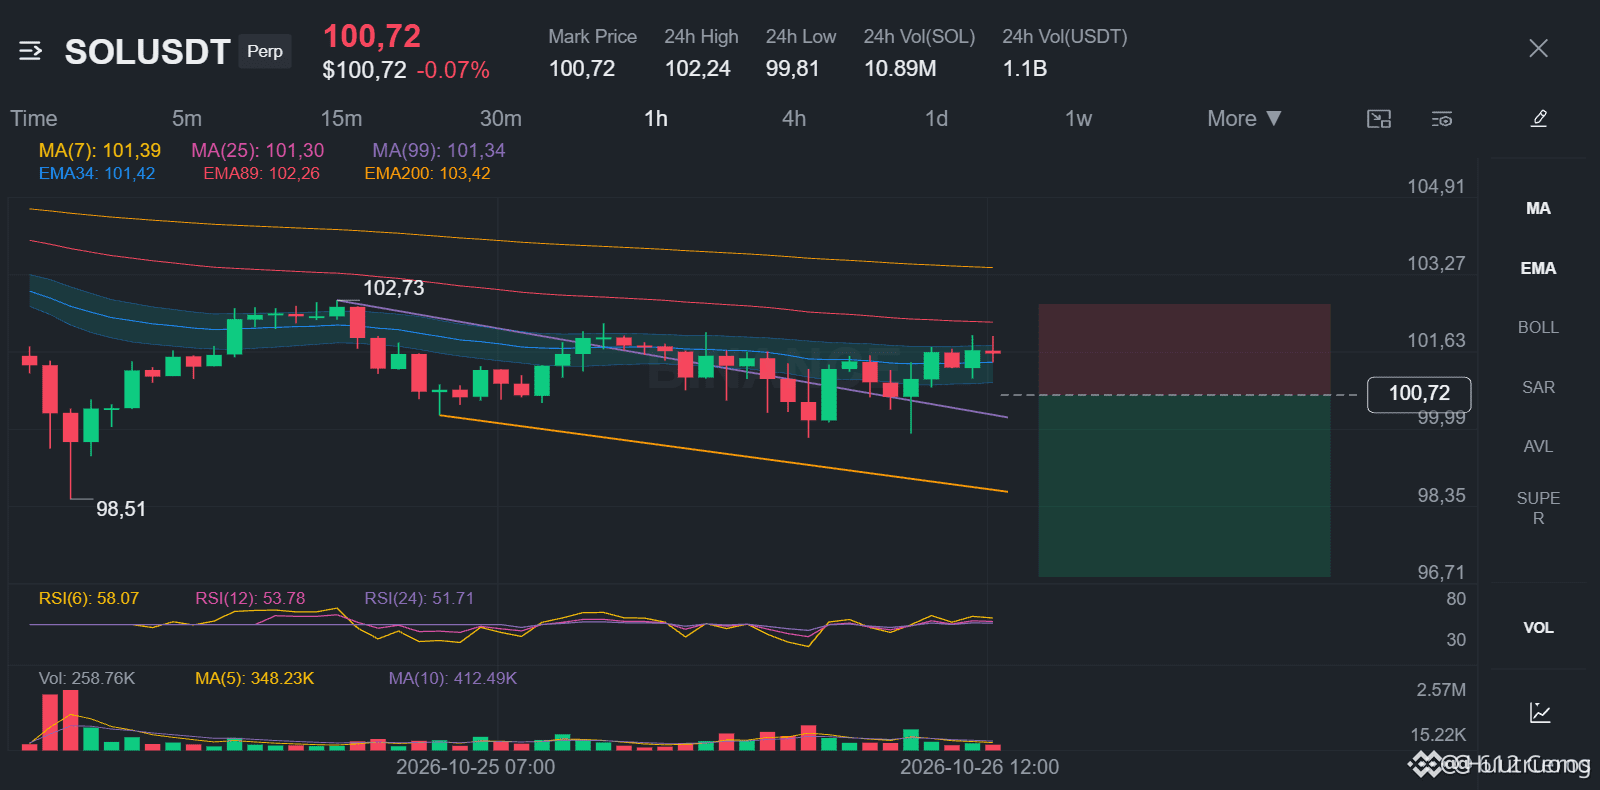
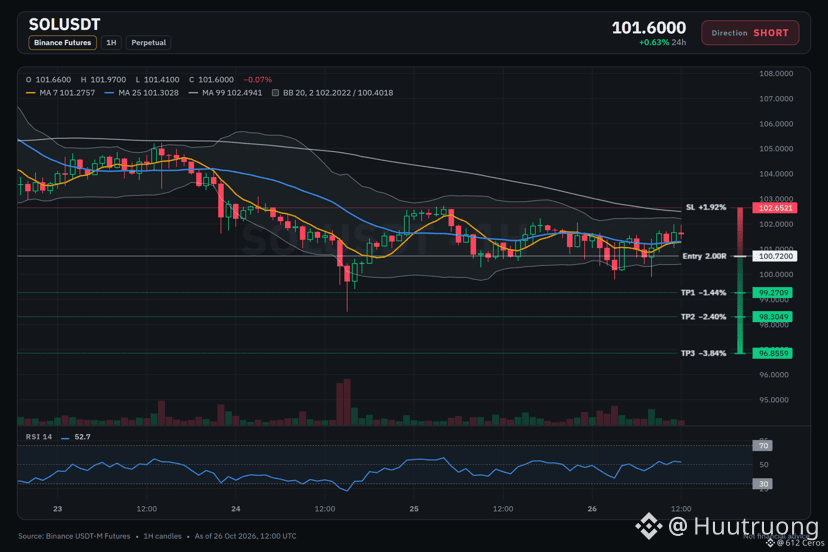
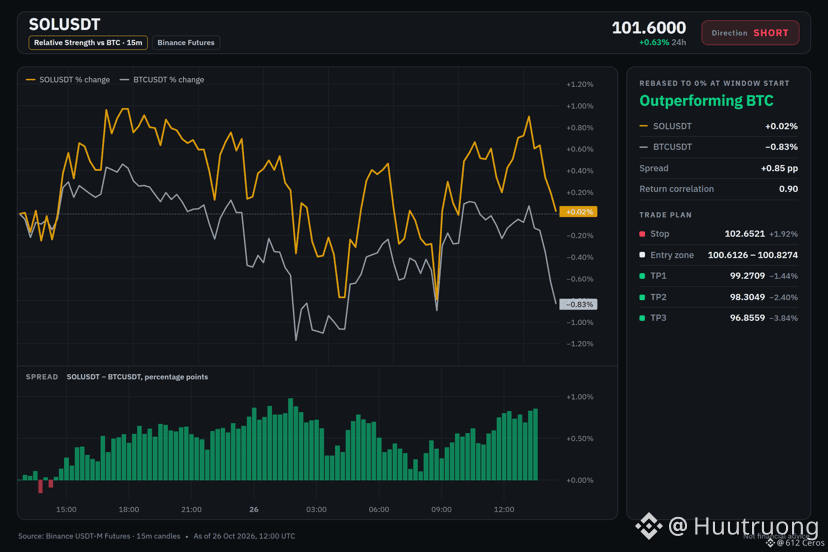
SOL keeps sliding under stacked EMAs on the 4h.
🔴 SHORT $SOL /USDT: expecting price to go DOWN
Bias: SHORT · Leaning
Entry: 100.6126 – 100.8274
TP1: 99.2709 (-1.4%)
TP2: 98.3049 (-2.4%)
TP3: 96.8559 (-3.8%)
SL: 102.6521 (+1.9%)
Plan: enter only inside the zone, close 50% at TP1, 25% at TP2, 25% at TP3, and move the stop to entry after TP1.
Note: moderate conviction only, keep size light.
Why SHORT? 3/12 signals agree, 1 against.
• 4h trend down (below EMA50 & EMA200)
• 1h trend down (below EMA50 & EMA200)
• Volume backs the sellers (volume z +3.9)
Risk: Stronger than BTC (+1.01% 24h vs BTC)
SOL in 3 points:
1/3 The 4h trend shows price below EMA50 below EMA200, a bearish stack.
2/3 The 1h trend also shows price below EMA50 below EMA200, a bearish stack.
3/3 The setup fails if price pushes above entry at 100.6126 and holds there.
What is your invalidation level for this SOL short?
{spot}(SOLUSDT)
SOL keeps sliding under stacked EMAs on the 4h.
🔴 SHORT $SOL /USDT: expecting price to go DOWN
Bias: SHORT · Leaning
Entry: 100.6126 – 100.8274
TP1: 99.2709 (-1.4%)
TP2: 98.3049 (-2.4%)
TP3: 96.8559 (-3.8%)
SL: 102.6521 (+1.9%)
Plan: enter only inside the zone, close 50% at TP1, 25% at TP2, 25% at TP3, and move the stop to entry after TP1.
Note: moderate conviction only, keep size light.
Why SHORT? 3/12 signals agree, 1 against.
• 4h trend down (below EMA50 & EMA200)
• 1h trend down (below EMA50 & EMA200)
• Volume backs the sellers (volume z +3.9)
Risk: Stronger than BTC (+1.01% 24h vs BTC)
SOL in 3 points:
1/3 The 4h trend shows price below EMA50 below EMA200, a bearish stack.
2/3 The 1h trend also shows price below EMA50 below EMA200, a bearish stack.
3/3 The setup fails if price pushes above entry at 100.6126 and holds there.
What is your invalidation level for this SOL short?
8
·
--
Bärisch
Übersetzung ansehen
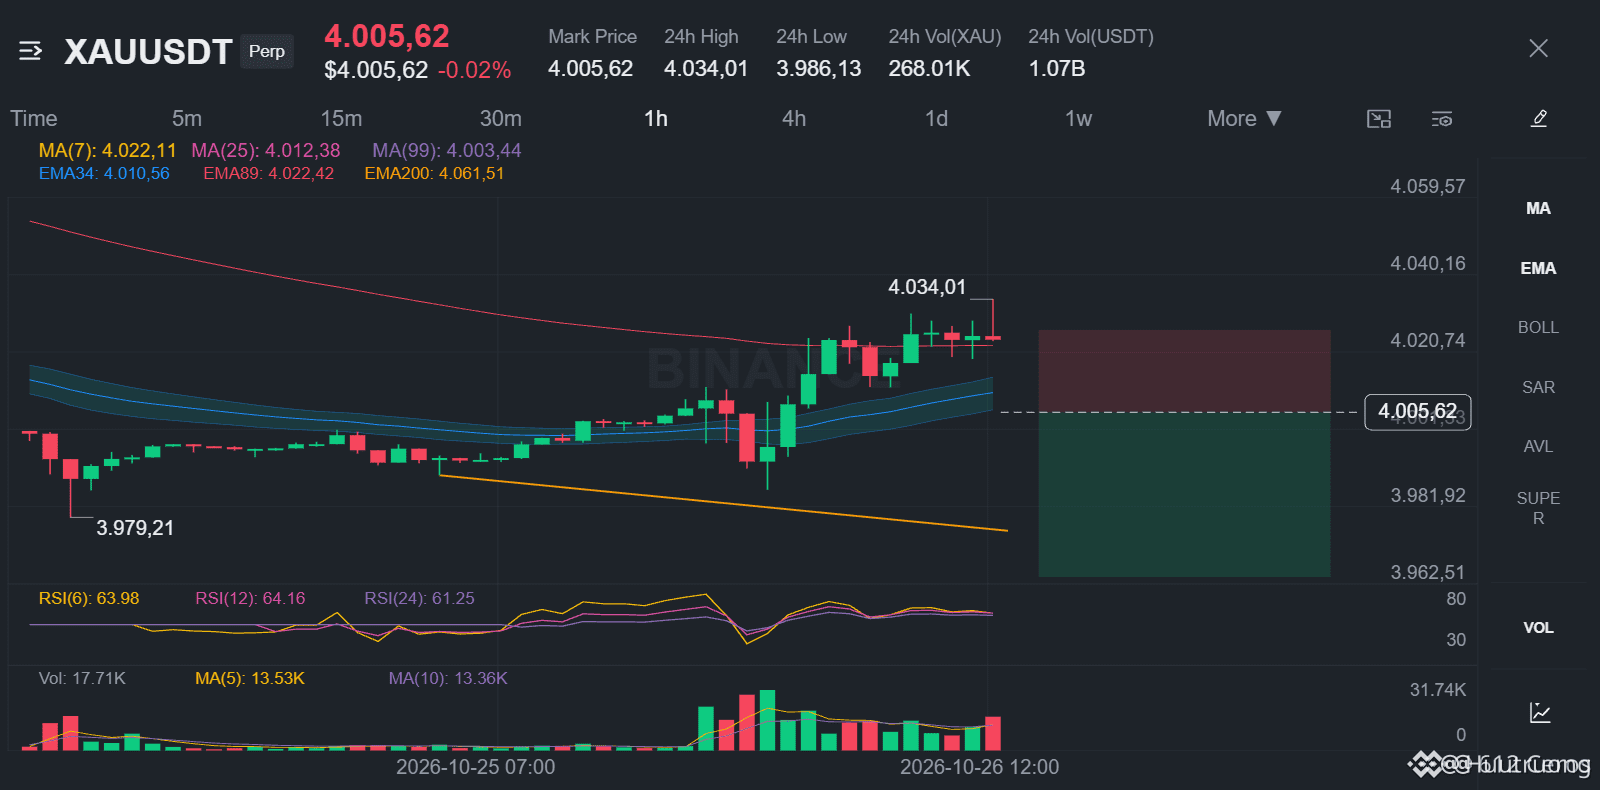
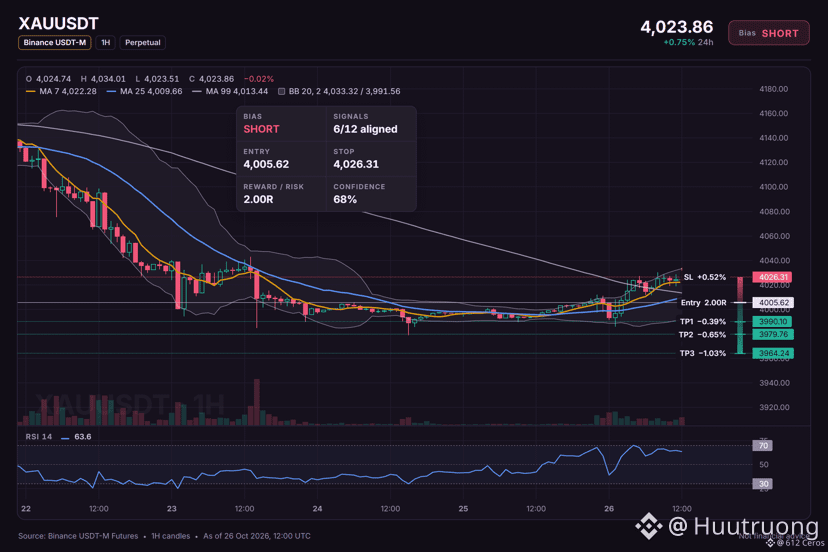
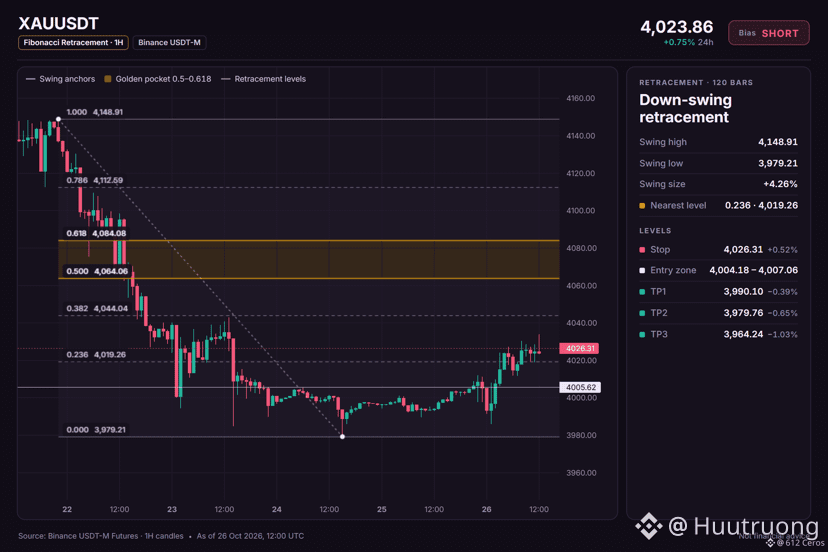
Has XAU finished stacking bearish candles for a clean short?
🔴 SHORT $XAU /USDT: expecting price to go DOWN
Bias: SHORT · Strong
Entry: 4004.18 – 4007.06
TP1: 3990.10 (-0.4%)
TP2: 3979.76 (-0.6%)
TP3: 3964.24 (-1.0%)
SL: 4026.31 (+0.5%)
Plan: enter only inside the zone, close 50% at TP1, 25% at TP2, 25% at TP3, and move the stop to entry after TP1.
Why SHORT? XAU checklist: 6/12 agree, 2 against.
• Daily trend down (below EMA50 & EMA200)
• 4h trend down (below EMA50 & EMA200)
• 1h trend down (below EMA50 & EMA200)
Watch: Buyers have the momentum (1h RSI 63.6)
Watch: The idea is wrong if price reaches the stop at 4026.31
Verdict: The daily, 4h and 1h trends all show price below EMA50 below EMA200, meaning every major timeframe is pointing down, but the 1h RSI at 63.6 says buyers currently hold the momentum, which could pause the drop.
Where do you set your invalidation level for this short?
{future}(XAUUSDT)
Has XAU finished stacking bearish candles for a clean short?
🔴 SHORT $XAU /USDT: expecting price to go DOWN
Bias: SHORT · Strong
Entry: 4004.18 – 4007.06
TP1: 3990.10 (-0.4%)
TP2: 3979.76 (-0.6%)
TP3: 3964.24 (-1.0%)
SL: 4026.31 (+0.5%)
Plan: enter only inside the zone, close 50% at TP1, 25% at TP2, 25% at TP3, and move the stop to entry after TP1.
Why SHORT? XAU checklist: 6/12 agree, 2 against.
• Daily trend down (below EMA50 & EMA200)
• 4h trend down (below EMA50 & EMA200)
• 1h trend down (below EMA50 & EMA200)
Watch: Buyers have the momentum (1h RSI 63.6)
Watch: The idea is wrong if price reaches the stop at 4026.31
Verdict: The daily, 4h and 1h trends all show price below EMA50 below EMA200, meaning every major timeframe is pointing down, but the 1h RSI at 63.6 says buyers currently hold the momentum, which could pause the drop.
Where do you set your invalidation level for this short?
9
·
--
Bärisch
Übersetzung ansehen
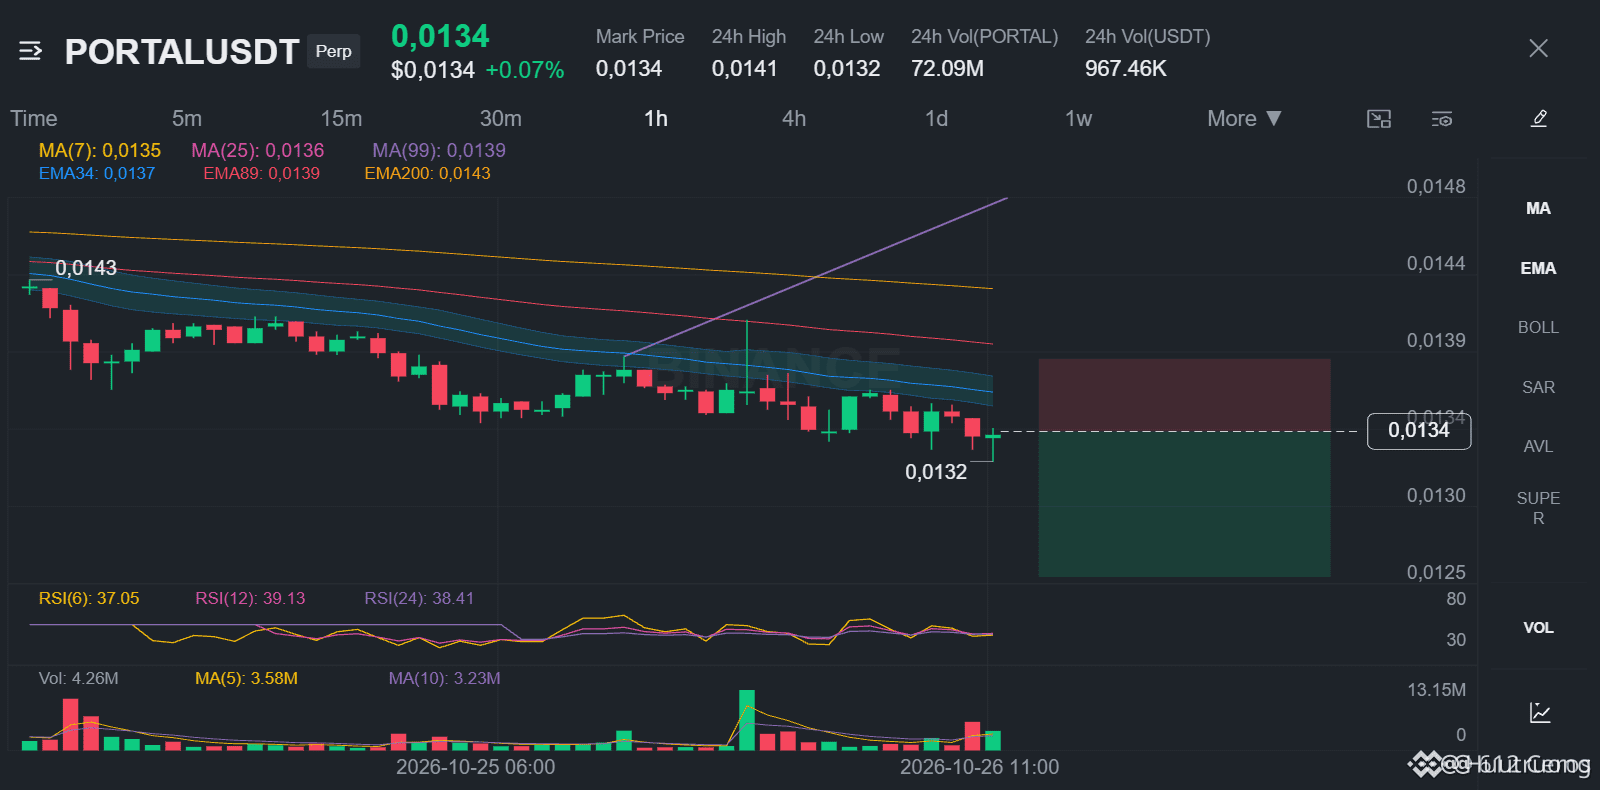
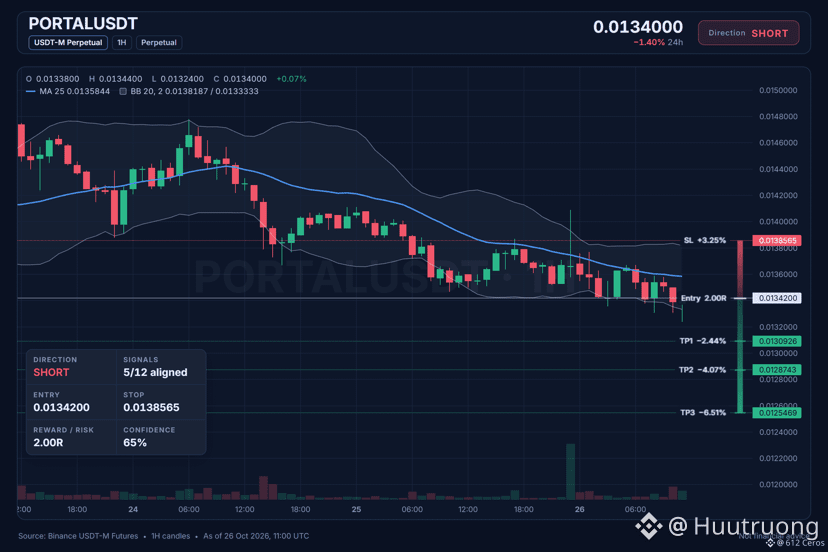
PORTAL is leaning down on stacked EMAs.
🔴 SHORT $PORTAL /USDT: expecting price to go DOWN
Bias: SHORT · Leaning
Entry: 0.0133975 – 0.0134425
TP1: 0.0130926 (-2.4%)
TP2: 0.0128743 (-4.1%)
TP3: 0.0125469 (-6.5%)
SL: 0.0138565 (+3.3%)
Plan: enter only inside the zone, close 50% at TP1, 25% at TP2, 25% at TP3, and move the stop to entry after TP1.
Note: moderate conviction only, keep size light.
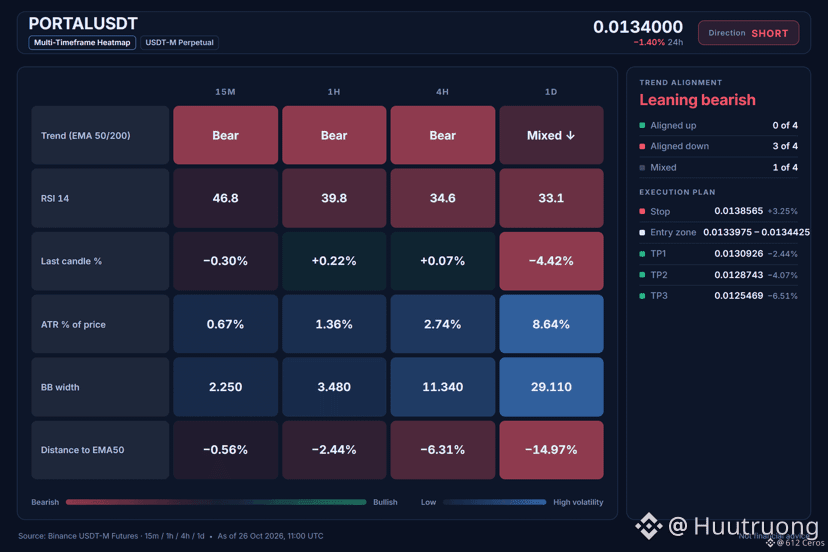
Why SHORT? 5/12 signals agree, 1 against.
• 4h trend down (below EMA50 & EMA200)
• 1h trend down (below EMA50 & EMA200)
• Sellers are driving the move (15m ADX 20.4)
Risk: BTC is rising, this coin follows (corr 0.63)
The reasoning:
The 1h and 4h trends both show bearish stacks with price below EMA50 and EMA200. Sellers are in control with ADX 20.4 and RSI near 35 on both timeframes. The daily trend is mixed and BTC is rising with 0.63 correlation, which is the main risk.
Where would you place your stop for this trade?
{spot}(PORTALUSDT)
PORTAL is leaning down on stacked EMAs.
🔴 SHORT $PORTAL /USDT: expecting price to go DOWN
Bias: SHORT · Leaning
Entry: 0.0133975 – 0.0134425
TP1: 0.0130926 (-2.4%)
TP2: 0.0128743 (-4.1%)
TP3: 0.0125469 (-6.5%)
SL: 0.0138565 (+3.3%)
Plan: enter only inside the zone, close 50% at TP1, 25% at TP2, 25% at TP3, and move the stop to entry after TP1.
Note: moderate conviction only, keep size light.
Why SHORT? 5/12 signals agree, 1 against.
• 4h trend down (below EMA50 & EMA200)
• 1h trend down (below EMA50 & EMA200)
• Sellers are driving the move (15m ADX 20.4)
Risk: BTC is rising, this coin follows (corr 0.63)
The reasoning:
The 1h and 4h trends both show bearish stacks with price below EMA50 and EMA200. Sellers are in control with ADX 20.4 and RSI near 35 on both timeframes. The daily trend is mixed and BTC is rising with 0.63 correlation, which is the main risk.
Where would you place your stop for this trade?
4
·
--
Bullisch
Übersetzung ansehen
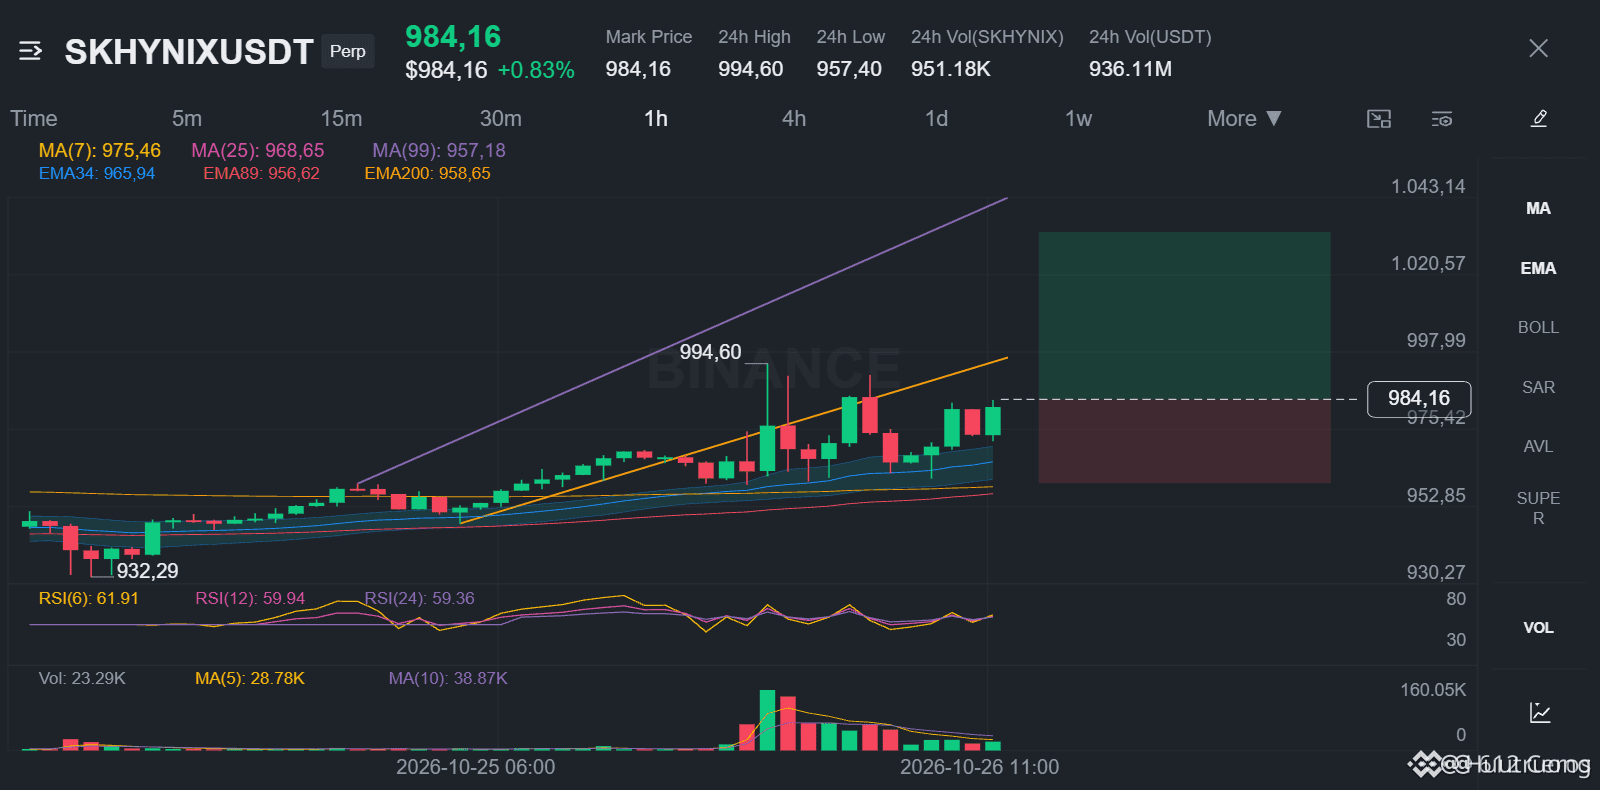
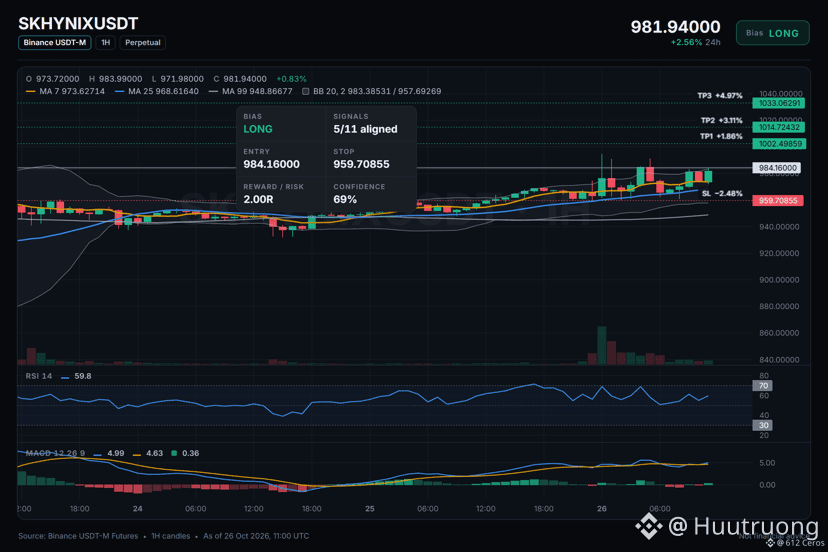
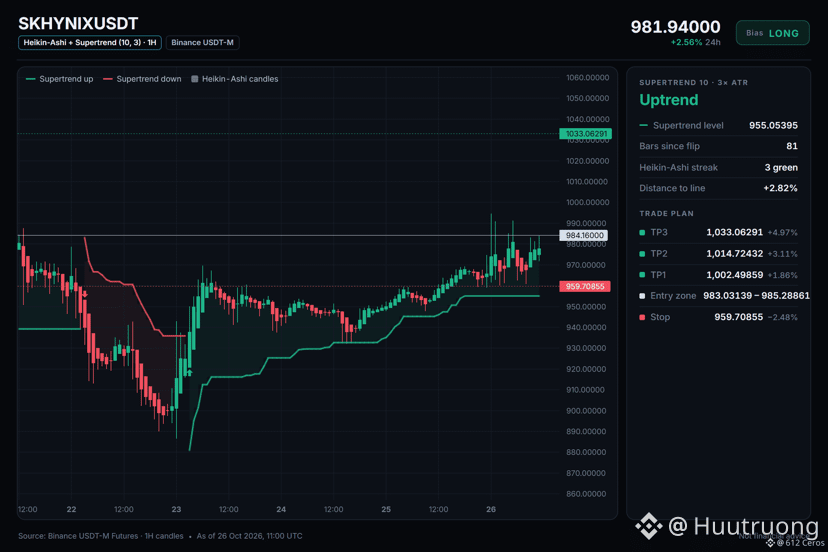
SKHYNIX is not weak just because it is range-bound
🟢 LONG $SKHYNIX /USDT: expecting price to go UP
Bias: LONG · Leaning
Entry: 983.03139 – 985.28861
TP1: 1002.49859 (+1.9%)
TP2: 1014.72432 (+3.1%)
TP3: 1033.06291 (+5.0%)
SL: 959.70855 (-2.5%)
Plan: enter only inside the zone, close 50% at TP1, 25% at TP2, 25% at TP3, and move the stop to entry after TP1.
Note: moderate conviction only, keep size light.
Why LONG? 5/11 signals agree, 0 against.
• 1h trend up (above EMA50 & EMA200)
• Buyers have the momentum (4h RSI 62.6)
• Buyers have the momentum (1h RSI 59.8)
Q: Why go long when the daily trend is range?
A: The 1h trend stacks bullish, so short-term buyers are in control.
Q: When is this long setup wrong?
A: A break below 959.70855 invalidates the trade immediately.
What is your level on SKHYNIX, bullish or bearish?
{future}(SKHYNIXUSDT)
SKHYNIX is not weak just because it is range-bound
🟢 LONG $SKHYNIX /USDT: expecting price to go UP
Bias: LONG · Leaning
Entry: 983.03139 – 985.28861
TP1: 1002.49859 (+1.9%)
TP2: 1014.72432 (+3.1%)
TP3: 1033.06291 (+5.0%)
SL: 959.70855 (-2.5%)
Plan: enter only inside the zone, close 50% at TP1, 25% at TP2, 25% at TP3, and move the stop to entry after TP1.
Note: moderate conviction only, keep size light.
Why LONG? 5/11 signals agree, 0 against.
• 1h trend up (above EMA50 & EMA200)
• Buyers have the momentum (4h RSI 62.6)
• Buyers have the momentum (1h RSI 59.8)
Q: Why go long when the daily trend is range?
A: The 1h trend stacks bullish, so short-term buyers are in control.
Q: When is this long setup wrong?
A: A break below 959.70855 invalidates the trade immediately.
What is your level on SKHYNIX, bullish or bearish?
9
·
--
Bärisch
Übersetzung ansehen
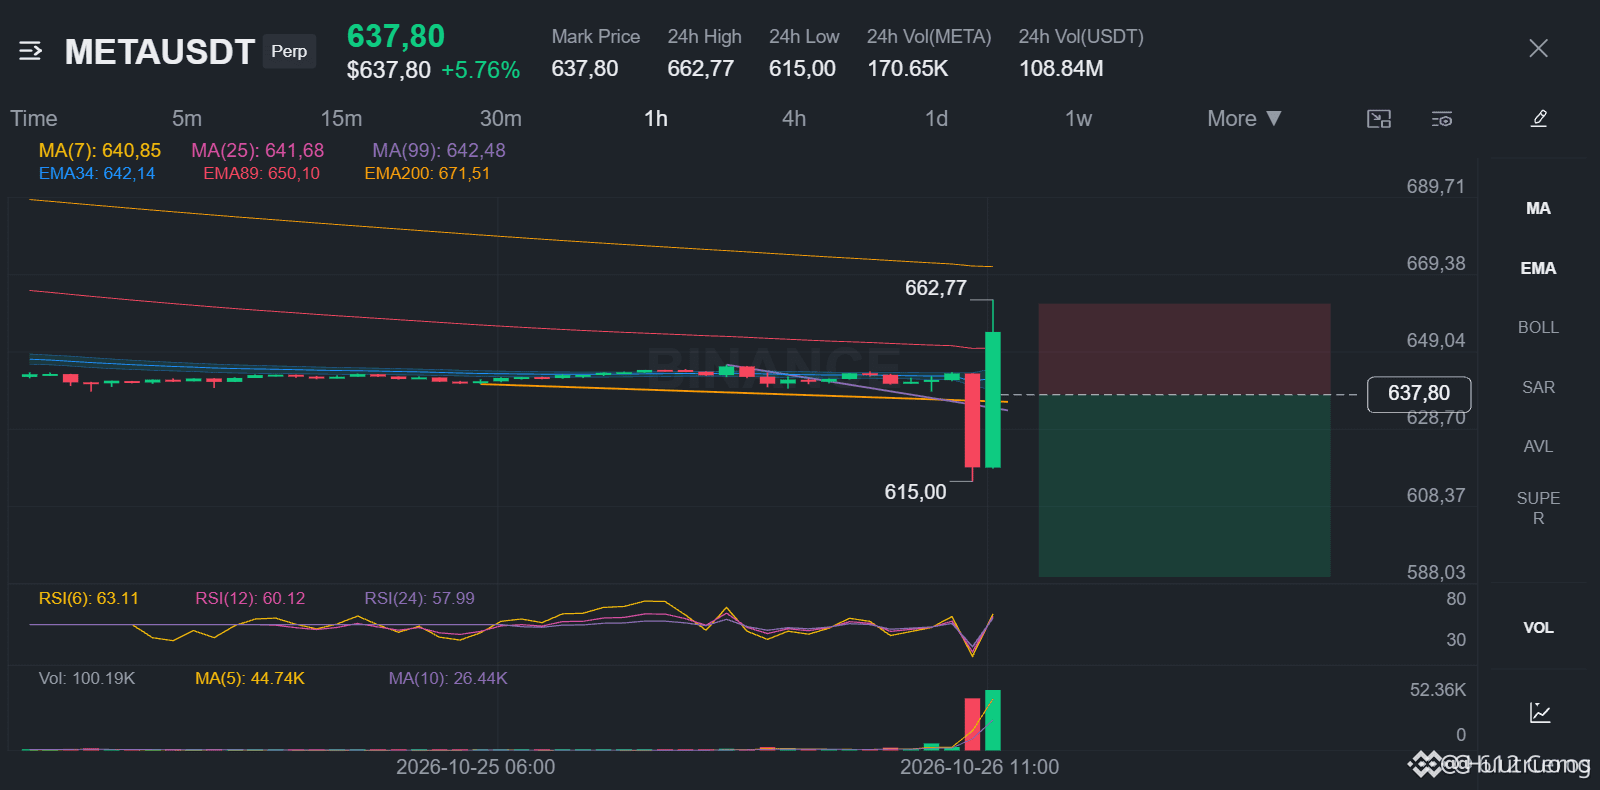
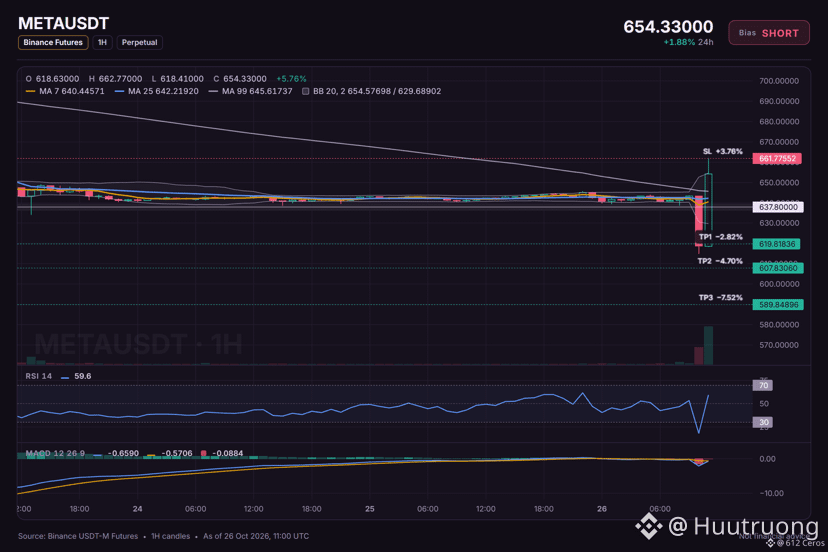
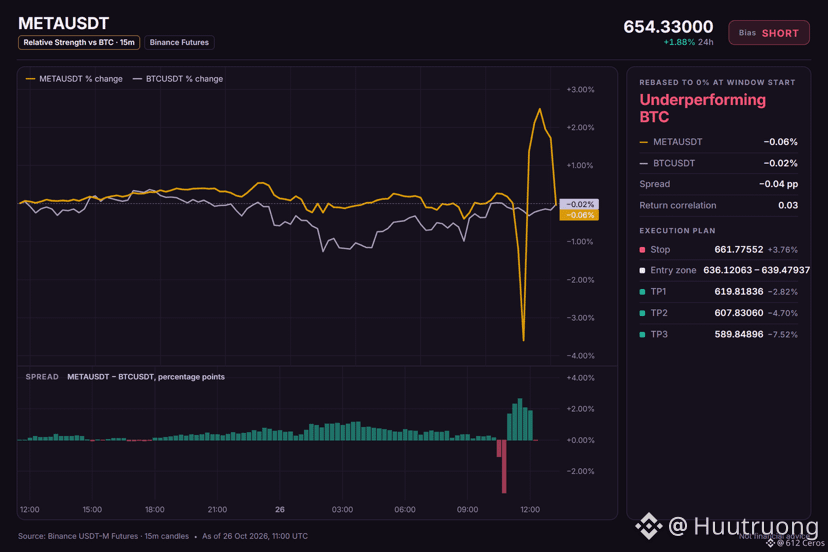
META under EMA50 and EMA200 on the 4h chart
🔴 SHORT $META /USDT: expecting price to go DOWN
Bias: SHORT · Leaning
Entry: 636.12063 – 639.47937
TP1: 619.81836 (-2.8%)
TP2: 607.83060 (-4.7%)
TP3: 589.84896 (-7.5%)
SL: 661.77552 (+3.8%)
Plan: enter only inside the zone, close 50% at TP1, 25% at TP2, 25% at TP3, and move the stop to entry after TP1.
Note: moderate conviction only, keep size light.
Why SHORT? 3/12 signals agree, 1 against.
• 4h trend down (below EMA50 & EMA200)
• 1h trend down (below EMA50 & EMA200)
• Sellers are driving the move (15m ADX 20.3)
Risk: Buyers have the momentum (1h RSI 59.6)
META in 3 points:
1/3 The 4h trend shows price below EMA50 below EMA200, a bearish stack indicating the swing trend is down.
2/3 The 1h trend mirrors this with price below EMA50 below EMA200, keeping the short-term trend down.
3/3 A 1h RSI at 59.6 shows bullish momentum above 55, which would invalidate the short if sustained.
What level would make you ignore this short?
{future}(METAUSDT)
META under EMA50 and EMA200 on the 4h chart
🔴 SHORT $META /USDT: expecting price to go DOWN
Bias: SHORT · Leaning
Entry: 636.12063 – 639.47937
TP1: 619.81836 (-2.8%)
TP2: 607.83060 (-4.7%)
TP3: 589.84896 (-7.5%)
SL: 661.77552 (+3.8%)
Plan: enter only inside the zone, close 50% at TP1, 25% at TP2, 25% at TP3, and move the stop to entry after TP1.
Note: moderate conviction only, keep size light.
Why SHORT? 3/12 signals agree, 1 against.
• 4h trend down (below EMA50 & EMA200)
• 1h trend down (below EMA50 & EMA200)
• Sellers are driving the move (15m ADX 20.3)
Risk: Buyers have the momentum (1h RSI 59.6)
META in 3 points:
1/3 The 4h trend shows price below EMA50 below EMA200, a bearish stack indicating the swing trend is down.
2/3 The 1h trend mirrors this with price below EMA50 below EMA200, keeping the short-term trend down.
3/3 A 1h RSI at 59.6 shows bullish momentum above 55, which would invalidate the short if sustained.
What level would make you ignore this short?
7
·
--
Übersetzung ansehen
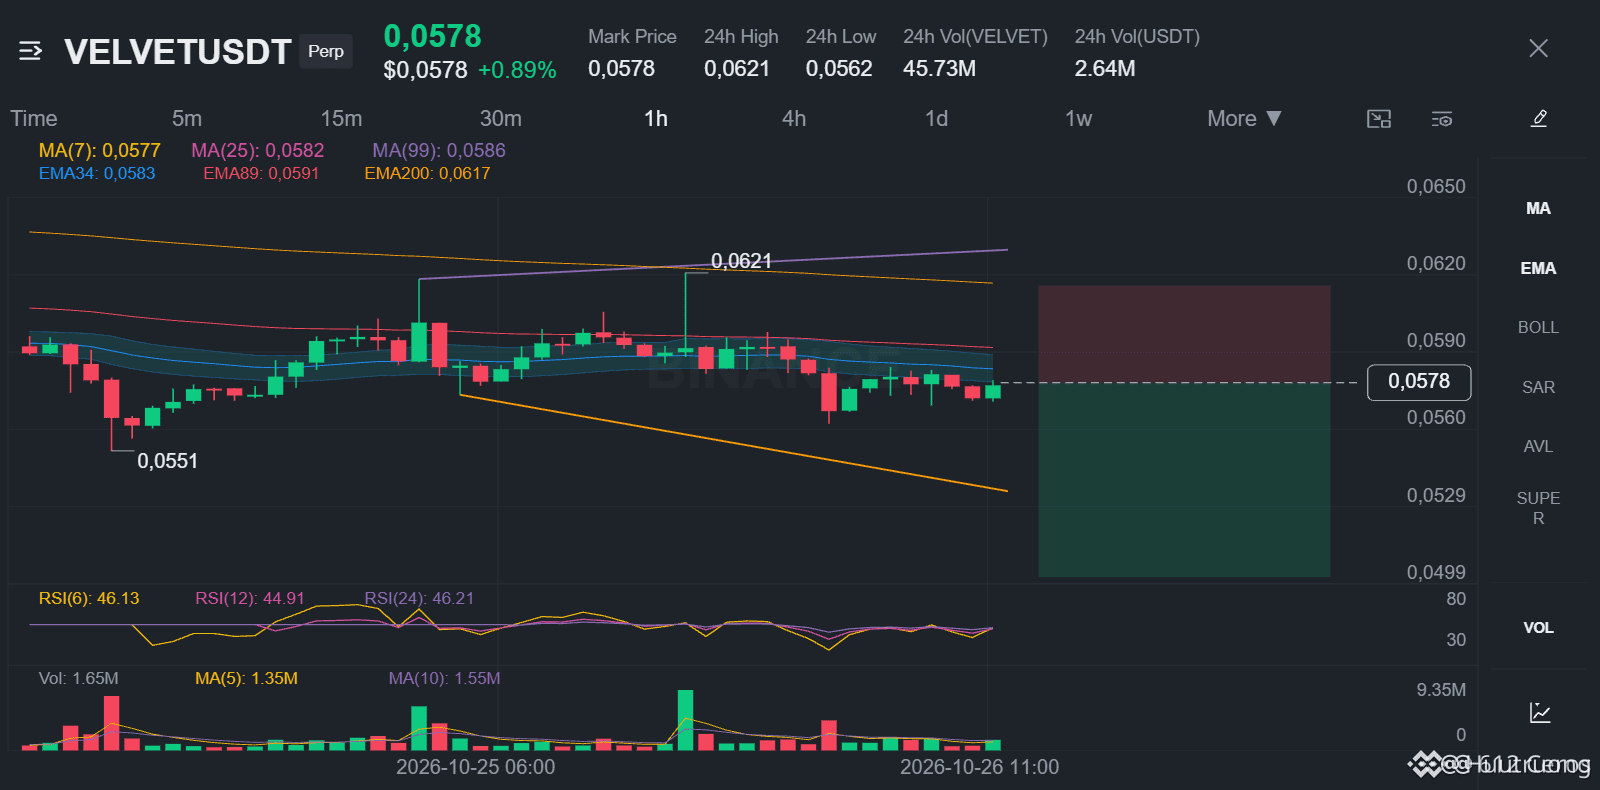
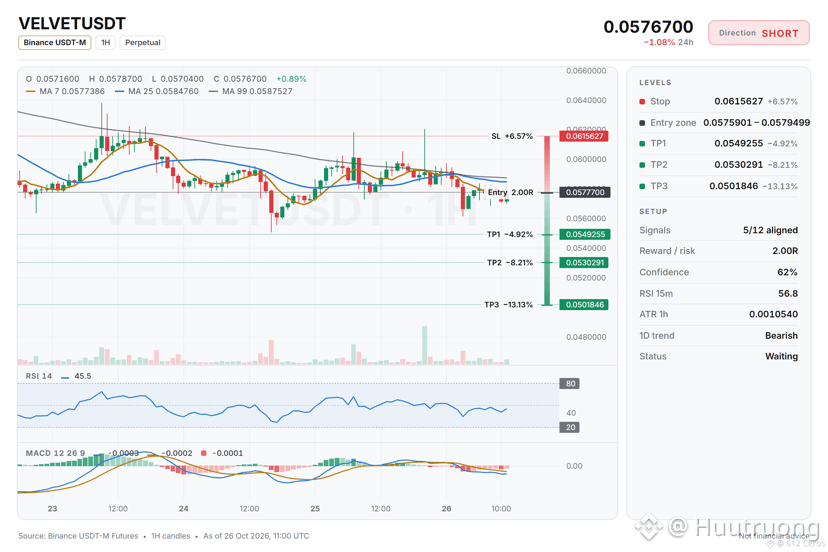
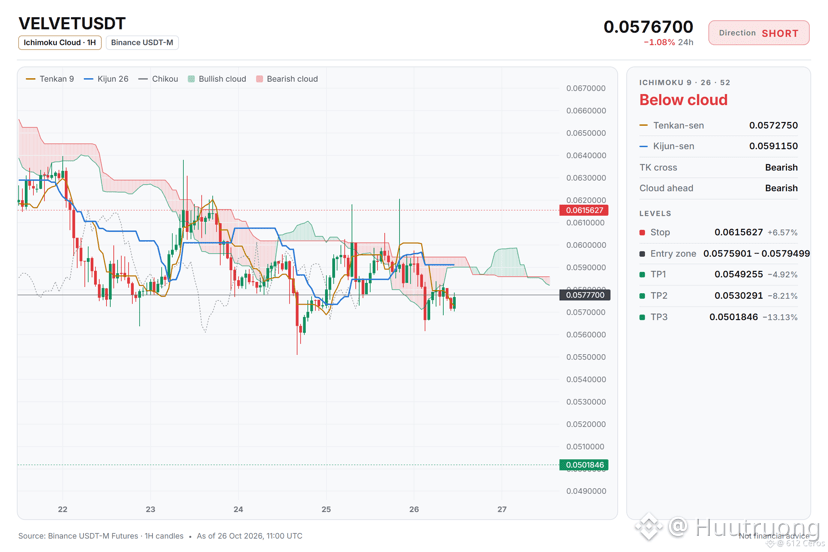
VELVET is fading inside a daily bearish stack.
🔴 SHORT $VELVET /USDT: expecting price to go DOWN
Bias: SHORT · Leaning
Entry: 0.0575901 – 0.0579499
TP1: 0.0549255 (-4.9%)
TP2: 0.0530291 (-8.2%)
TP3: 0.0501846 (-13.1%)
SL: 0.0615627 (+6.6%)
Plan: enter only inside the zone, close 50% at TP1, 25% at TP2, 25% at TP3, and move the stop to entry after TP1.
Note: moderate conviction only, keep size light.
Why SHORT? 5/12 signals agree, 3 against.
• Daily trend down (below EMA50 & EMA200)
• 4h trend down (below EMA50 & EMA200)
• 1h trend down (below EMA50 & EMA200)
Risk: Buyers are driving the move (15m ADX 24.5)
Bear path:
If price holds below the entry zone and the daily trend keeps it under the EMAs, it could drift toward the first target, as the 4h bearish stack suggests sellers are in control.
What kills it:
Buyer volume and a rising 15m RSI prove the move is driven by demand, so I would exit and wait.
Where are you taking profit on a short here?
{future}(VELVETUSDT)
VELVET is fading inside a daily bearish stack.
🔴 SHORT $VELVET /USDT: expecting price to go DOWN
Bias: SHORT · Leaning
Entry: 0.0575901 – 0.0579499
TP1: 0.0549255 (-4.9%)
TP2: 0.0530291 (-8.2%)
TP3: 0.0501846 (-13.1%)
SL: 0.0615627 (+6.6%)
Plan: enter only inside the zone, close 50% at TP1, 25% at TP2, 25% at TP3, and move the stop to entry after TP1.
Note: moderate conviction only, keep size light.
Why SHORT? 5/12 signals agree, 3 against.
• Daily trend down (below EMA50 & EMA200)
• 4h trend down (below EMA50 & EMA200)
• 1h trend down (below EMA50 & EMA200)
Risk: Buyers are driving the move (15m ADX 24.5)
Bear path:
If price holds below the entry zone and the daily trend keeps it under the EMAs, it could drift toward the first target, as the 4h bearish stack suggests sellers are in control.
What kills it:
Buyer volume and a rising 15m RSI prove the move is driven by demand, so I would exit and wait.
Where are you taking profit on a short here?
28
·
--
Bärisch
Übersetzung ansehen
TUT keeps stacking bearish candles on every trend.
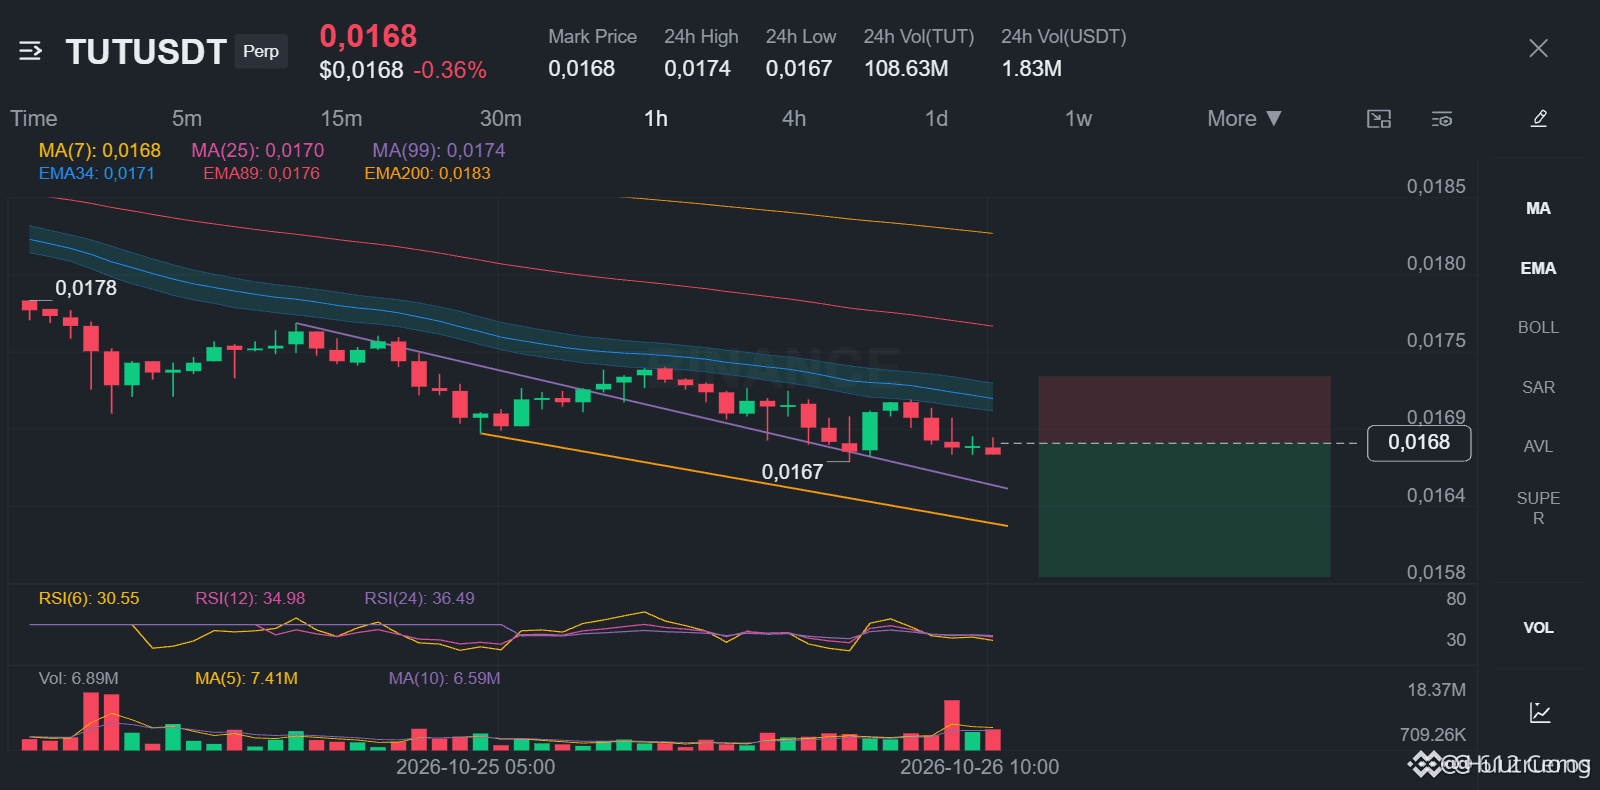
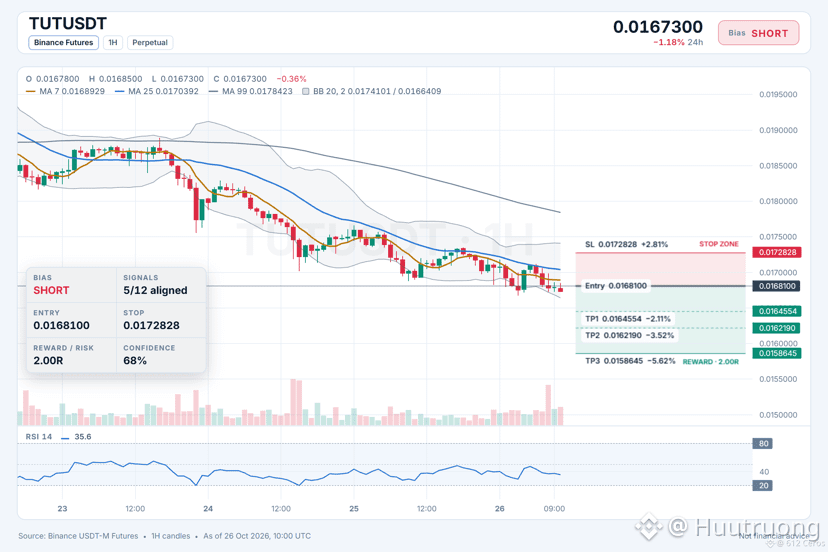
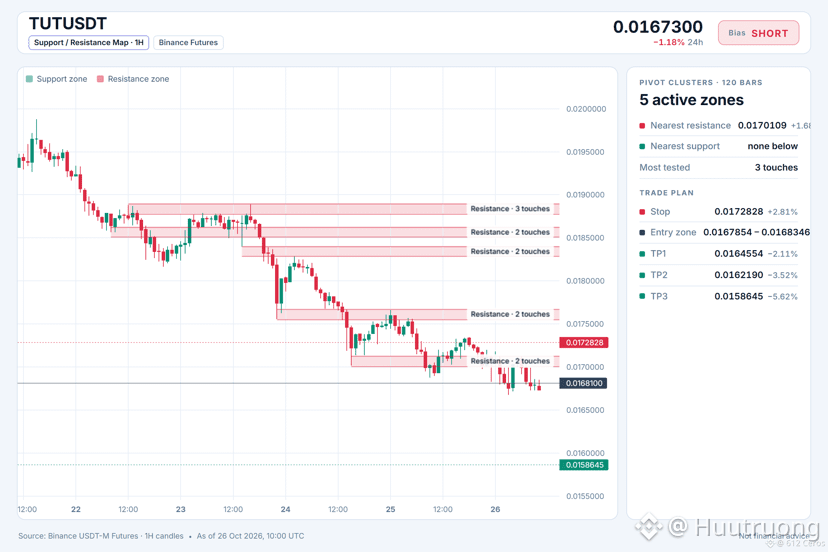
🔴 SHORT $TUT /USDT: expecting price to go DOWN
Bias: SHORT · Leaning
Entry: 0.0167854 – 0.0168346
TP1: 0.0164554 (-2.1%)
TP2: 0.0162190 (-3.5%)
TP3: 0.0158645 (-5.6%)
SL: 0.0172828 (+2.8%)
Plan: enter only inside the zone, close 50% at TP1, 25% at TP2, 25% at TP3, and move the stop to entry after TP1.
Note: moderate conviction only, keep size light.
Why SHORT? 5/12 signals agree, 0 against.
• 4h trend down (below EMA50 & EMA200)
• 1h trend down (below EMA50 & EMA200)
• Sellers have the momentum (4h RSI 28.6)
Why I like it:
TUT is already below the 1h EMA50 and EMA200, so the short-term trend is down. The 1h RSI sits at 40.15, which means sellers still have momentum. The setup leans short with conviction still moderate.
Where do you want to get in on a short?
{spot}(TUTUSDT)
TUT keeps stacking bearish candles on every trend.
🔴 SHORT $TUT /USDT: expecting price to go DOWN
Bias: SHORT · Leaning
Entry: 0.0167854 – 0.0168346
TP1: 0.0164554 (-2.1%)
TP2: 0.0162190 (-3.5%)
TP3: 0.0158645 (-5.6%)
SL: 0.0172828 (+2.8%)
Plan: enter only inside the zone, close 50% at TP1, 25% at TP2, 25% at TP3, and move the stop to entry after TP1.
Note: moderate conviction only, keep size light.
Why SHORT? 5/12 signals agree, 0 against.
• 4h trend down (below EMA50 & EMA200)
• 1h trend down (below EMA50 & EMA200)
• Sellers have the momentum (4h RSI 28.6)
Why I like it:
TUT is already below the 1h EMA50 and EMA200, so the short-term trend is down. The 1h RSI sits at 40.15, which means sellers still have momentum. The setup leans short with conviction still moderate.
Where do you want to get in on a short?
6
·
--
Bärisch
Übersetzung ansehen
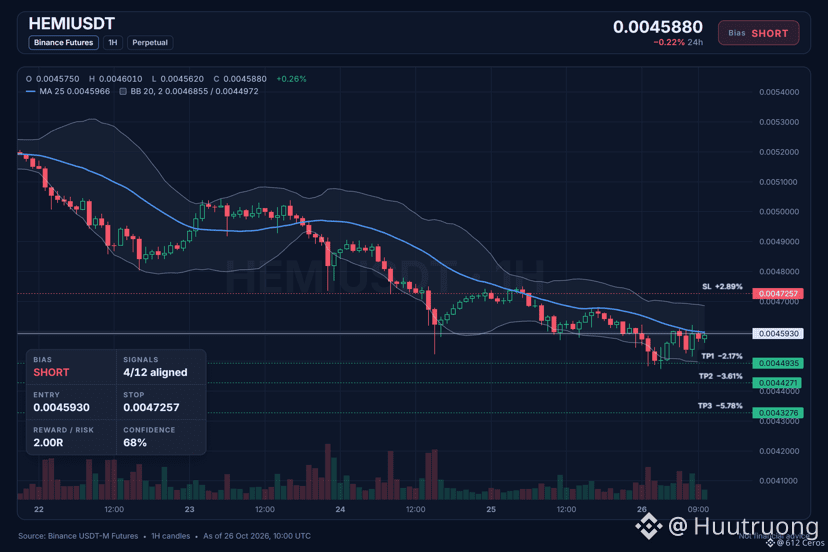
HEMI keeps stacking bearish candles on every trend
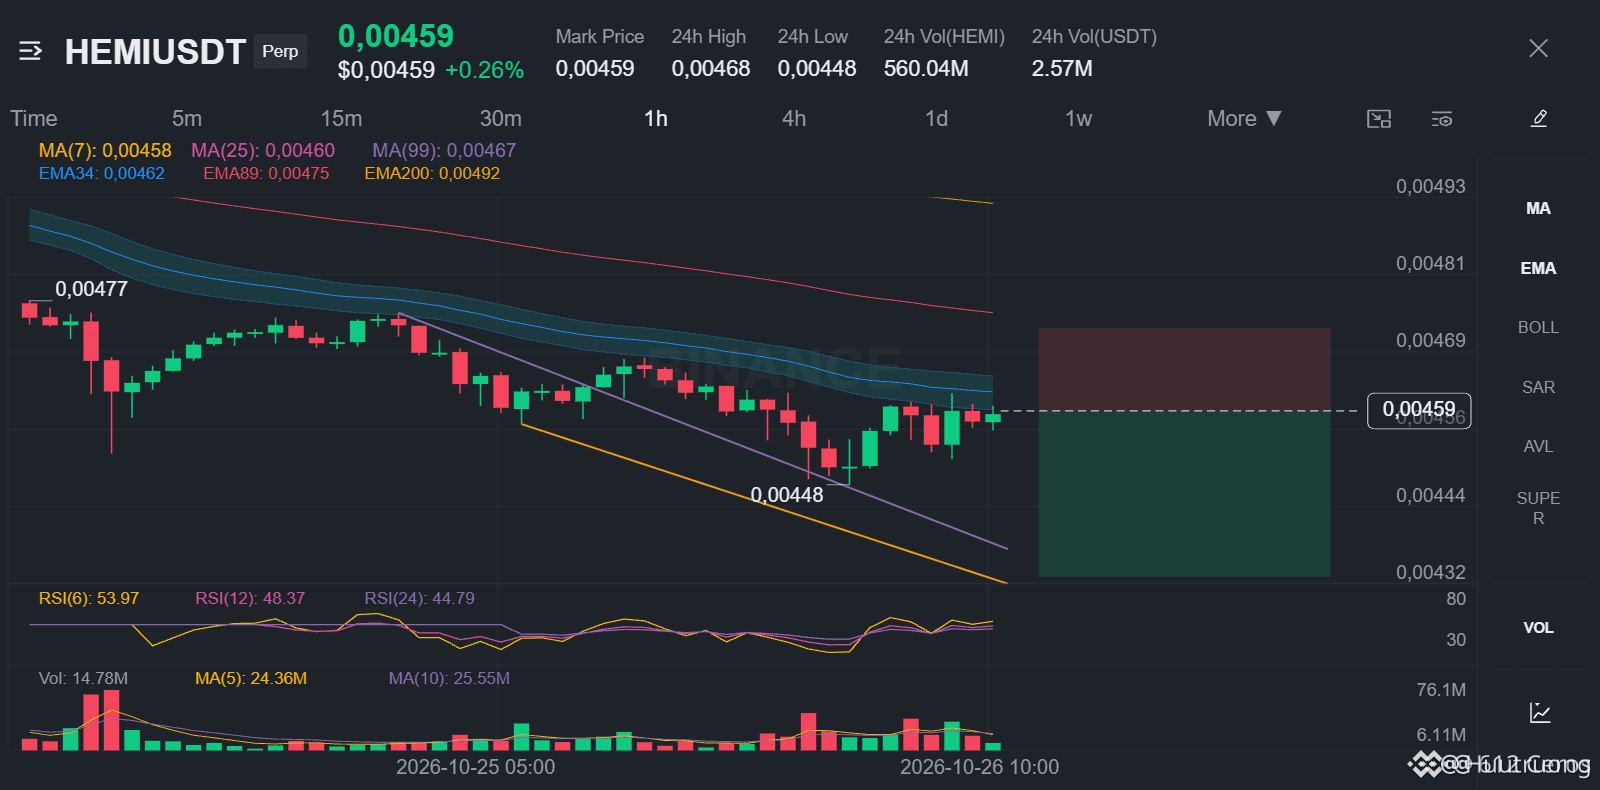
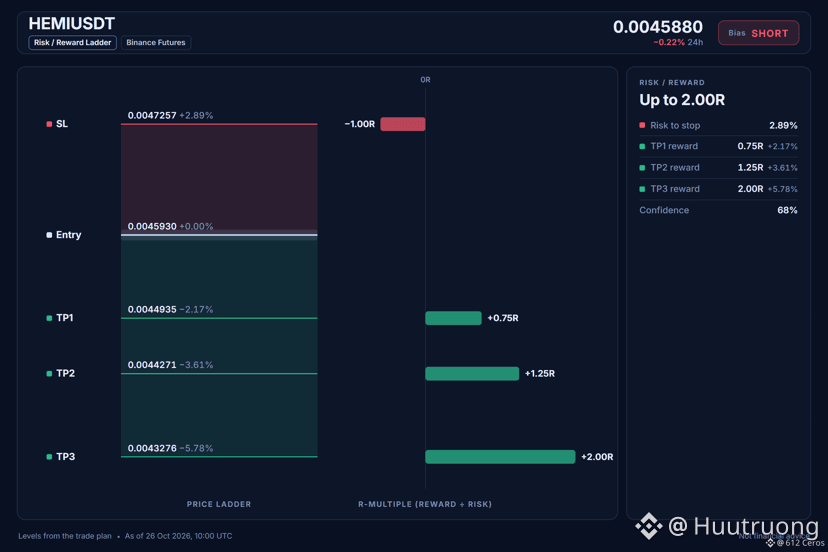
🔴 SHORT $HEMI /USDT: expecting price to go DOWN
Bias: SHORT · Leaning
Entry: 0.0045866 – 0.0045994
TP1: 0.0044935 (-2.2%)
TP2: 0.0044271 (-3.6%)
TP3: 0.0043276 (-5.8%)
SL: 0.0047257 (+2.9%)
Plan: enter only inside the zone, close 50% at TP1, 25% at TP2, 25% at TP3, and move the stop to entry after TP1.
Note: moderate conviction only, keep size light.
Why SHORT? 4/12 signals agree, 0 against.
• Daily trend down (below EMA50 & EMA200)
• 4h trend down (below EMA50 & EMA200)
• 1h trend down (below EMA50 & EMA200)
Q: Why short when the 1h RSI is neutral?
A: The 1h RSI at 47.1 shows momentum is undecided, so the short relies on the daily and 4h bearish stacks.
Q: When is this trade wrong if the daily trend flips?
A: The daily trend is bearish with price below EMA50 and EMA200, so a break above that stack invalidates the setup.
What is your HEMI level or counter-argument?
{spot}(HEMIUSDT)
HEMI keeps stacking bearish candles on every trend
🔴 SHORT $HEMI /USDT: expecting price to go DOWN
Bias: SHORT · Leaning
Entry: 0.0045866 – 0.0045994
TP1: 0.0044935 (-2.2%)
TP2: 0.0044271 (-3.6%)
TP3: 0.0043276 (-5.8%)
SL: 0.0047257 (+2.9%)
Plan: enter only inside the zone, close 50% at TP1, 25% at TP2, 25% at TP3, and move the stop to entry after TP1.
Note: moderate conviction only, keep size light.
Why SHORT? 4/12 signals agree, 0 against.
• Daily trend down (below EMA50 & EMA200)
• 4h trend down (below EMA50 & EMA200)
• 1h trend down (below EMA50 & EMA200)
Q: Why short when the 1h RSI is neutral?
A: The 1h RSI at 47.1 shows momentum is undecided, so the short relies on the daily and 4h bearish stacks.
Q: When is this trade wrong if the daily trend flips?
A: The daily trend is bearish with price below EMA50 and EMA200, so a break above that stack invalidates the setup.
What is your HEMI level or counter-argument?
11
·
--
Bärisch
Übersetzung ansehen
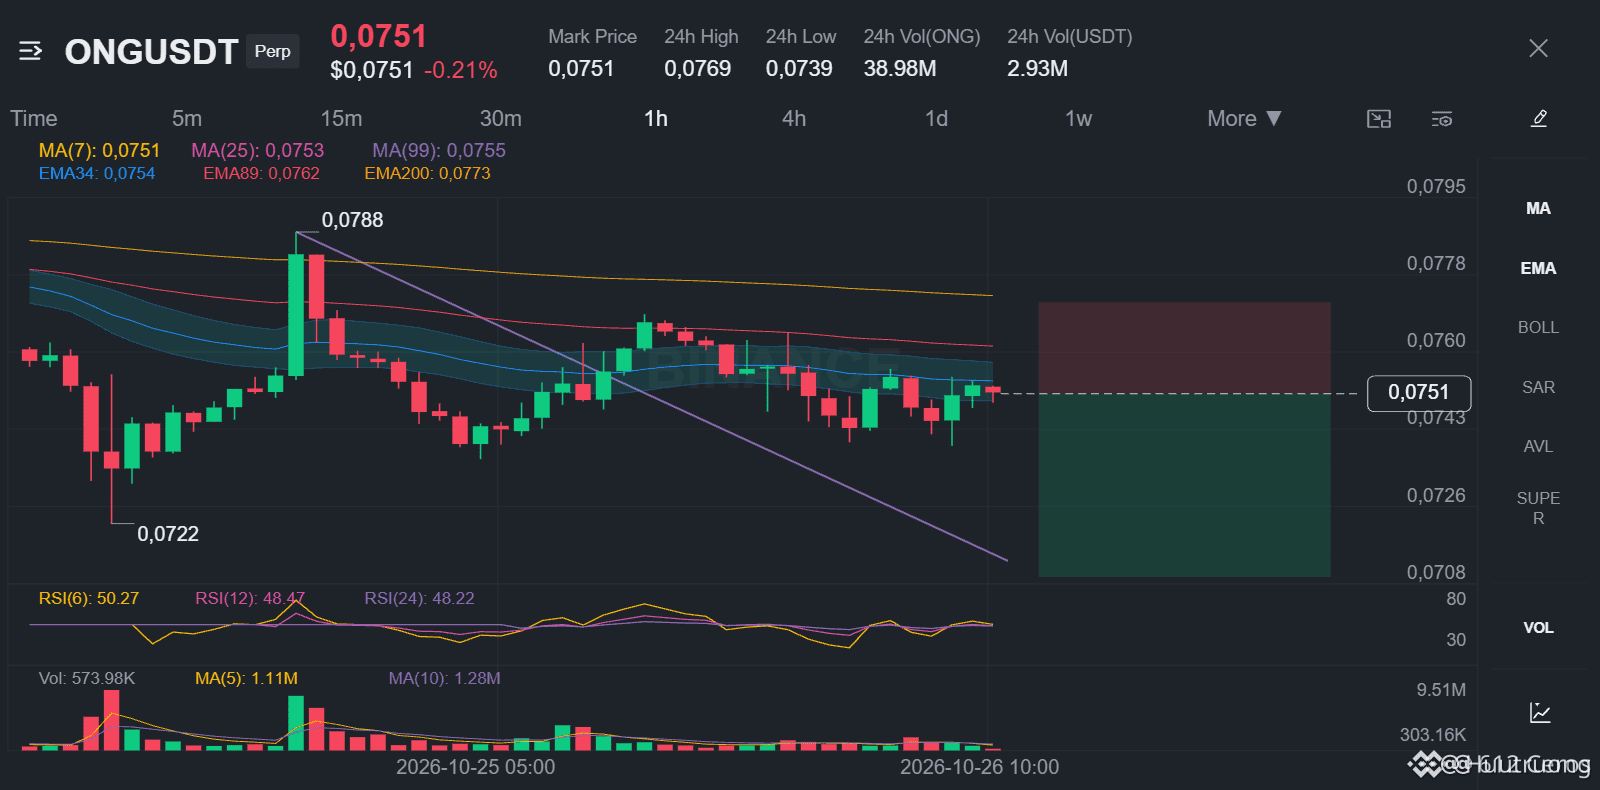
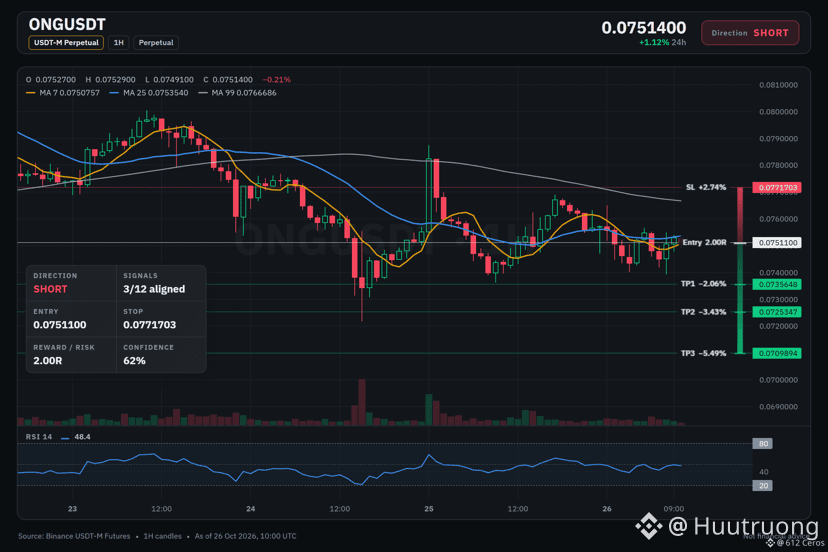
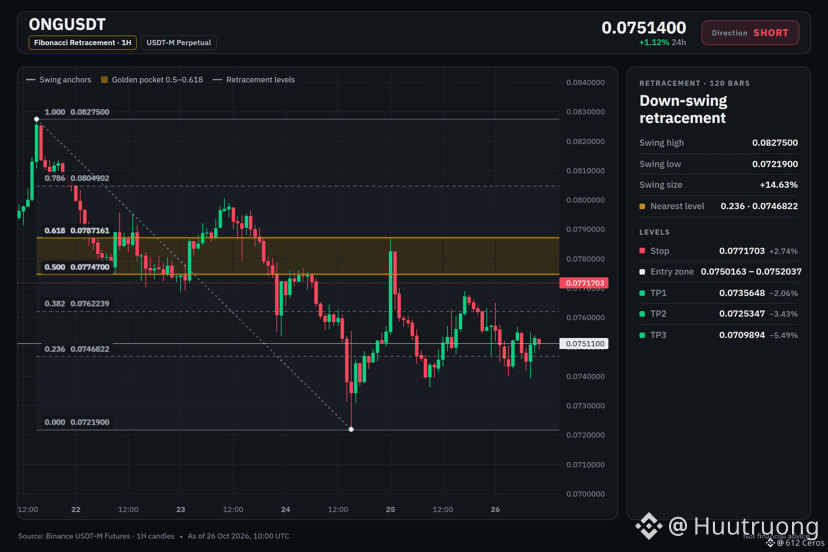
ONG keeps selling below EMA50.
🔴 SHORT $ONG /USDT: expecting price to go DOWN
Bias: SHORT · Leaning
Entry: 0.0750163 – 0.0752037
TP1: 0.0735648 (-2.1%)
TP2: 0.0725347 (-3.4%)
TP3: 0.0709894 (-5.5%)
SL: 0.0771703 (+2.7%)
Plan: enter only inside the zone, close 50% at TP1, 25% at TP2, 25% at TP3, and move the stop to entry after TP1.
Note: moderate conviction only, keep size light.
Why SHORT? ONG checklist: 3/12 agree, 0 against.
• 4h trend down (below EMA50 & EMA200)
• 1h trend down (below EMA50 & EMA200)
• Sellers have the momentum (4h RSI 41.6)
Watch: The idea is wrong if price reaches the stop at 0.0771703
Bottom line: The 4h trend is down with price below EMA50 and EMA200, which means the swing is bearish. The 1h trend is also down, and 4h RSI is below 45, showing sellers have momentum. However, conviction is moderate because some factors disagree.
Do you see a better short level?
{spot}(ONGUSDT)
ONG keeps selling below EMA50.
🔴 SHORT $ONG /USDT: expecting price to go DOWN
Bias: SHORT · Leaning
Entry: 0.0750163 – 0.0752037
TP1: 0.0735648 (-2.1%)
TP2: 0.0725347 (-3.4%)
TP3: 0.0709894 (-5.5%)
SL: 0.0771703 (+2.7%)
Plan: enter only inside the zone, close 50% at TP1, 25% at TP2, 25% at TP3, and move the stop to entry after TP1.
Note: moderate conviction only, keep size light.
Why SHORT? ONG checklist: 3/12 agree, 0 against.
• 4h trend down (below EMA50 & EMA200)
• 1h trend down (below EMA50 & EMA200)
• Sellers have the momentum (4h RSI 41.6)
Watch: The idea is wrong if price reaches the stop at 0.0771703
Bottom line: The 4h trend is down with price below EMA50 and EMA200, which means the swing is bearish. The 1h trend is also down, and 4h RSI is below 45, showing sellers have momentum. However, conviction is moderate because some factors disagree.
Do you see a better short level?
10
·
--
Bärisch
Übersetzung ansehen
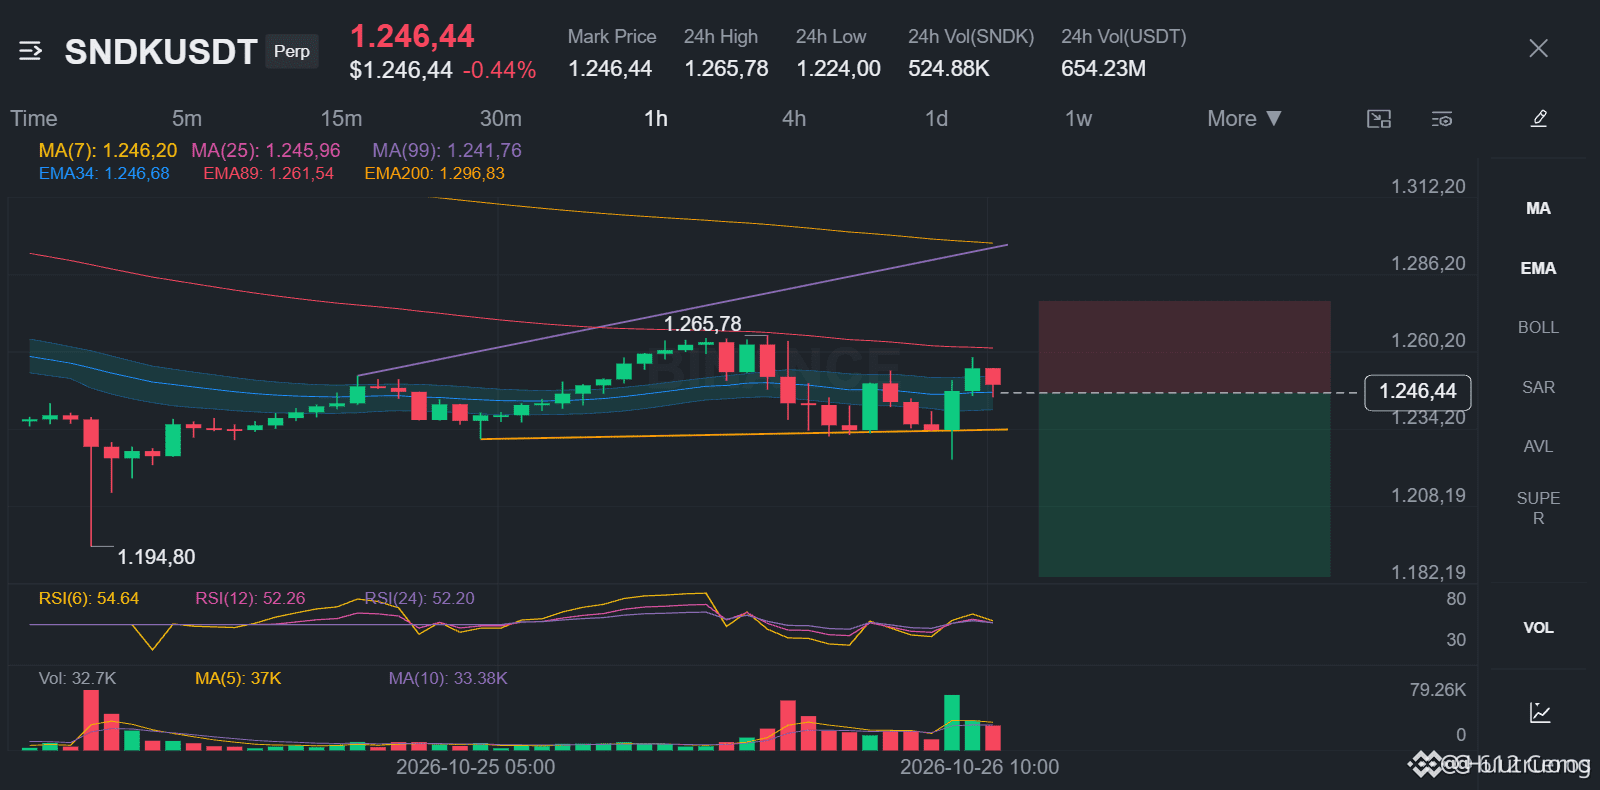
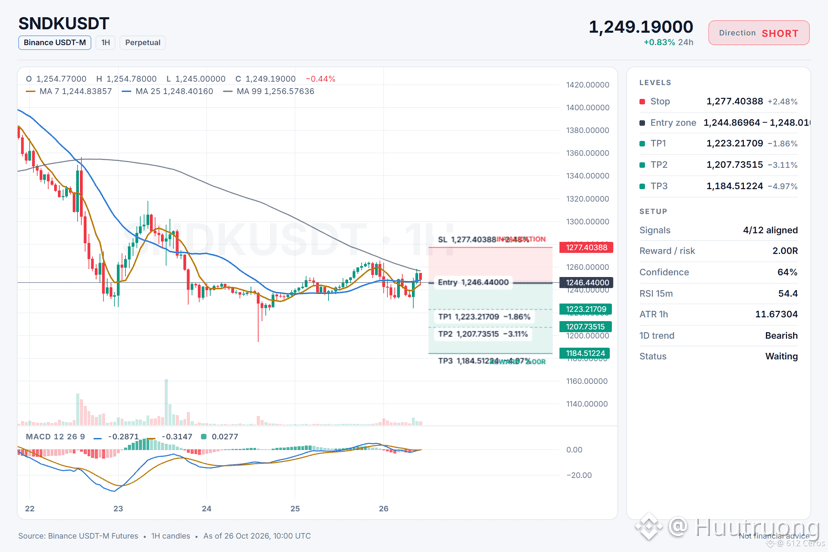
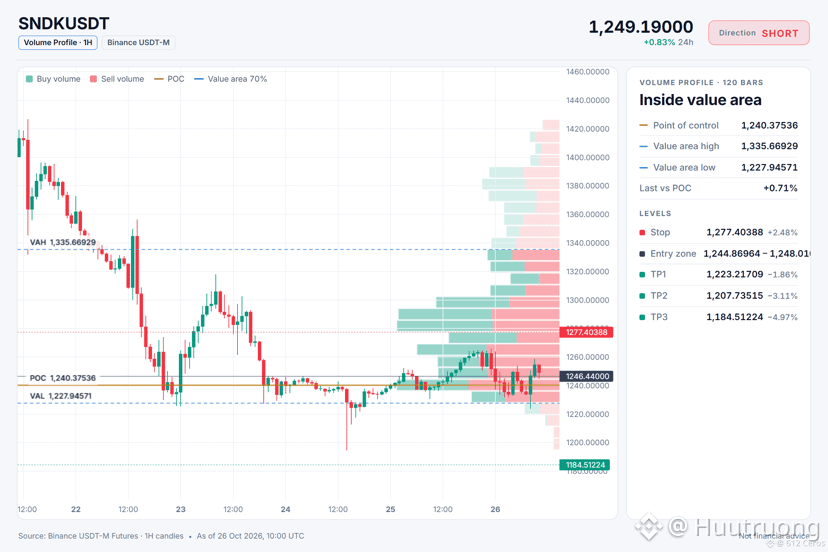
SNDK looks weak, but I need to see more proof.
🔴 SHORT $SNDK /USDT: expecting price to go DOWN
Bias: SHORT · Leaning
Entry: 1244.86964 – 1248.01036
TP1: 1223.21709 (-1.9%)
TP2: 1207.73515 (-3.1%)
TP3: 1184.51224 (-5.0%)
SL: 1277.40388 (+2.5%)
Plan: enter only inside the zone, close 50% at TP1, 25% at TP2, 25% at TP3, and move the stop to entry after TP1.
Note: moderate conviction only, keep size light.
Why SHORT? 4/12 signals agree, 1 against.
• Daily trend down (below EMA50 & EMA200)
• 4h trend down (below EMA50 & EMA200)
• 1h trend down (below EMA50 & EMA200)
Risk: BTC is rising, this coin follows (corr 0.62)
Journal note: SNDK
I'm watching SNDK for a short trade. The daily trend is bearish and the 4h trend is bearish too, which means the big and swing picture are both down. I want to see price hold below the 1h EMA50, currently 1246.44, before I take it.
Where would you set your invalidation level?
6
·
--
Bärisch
Übersetzung ansehen
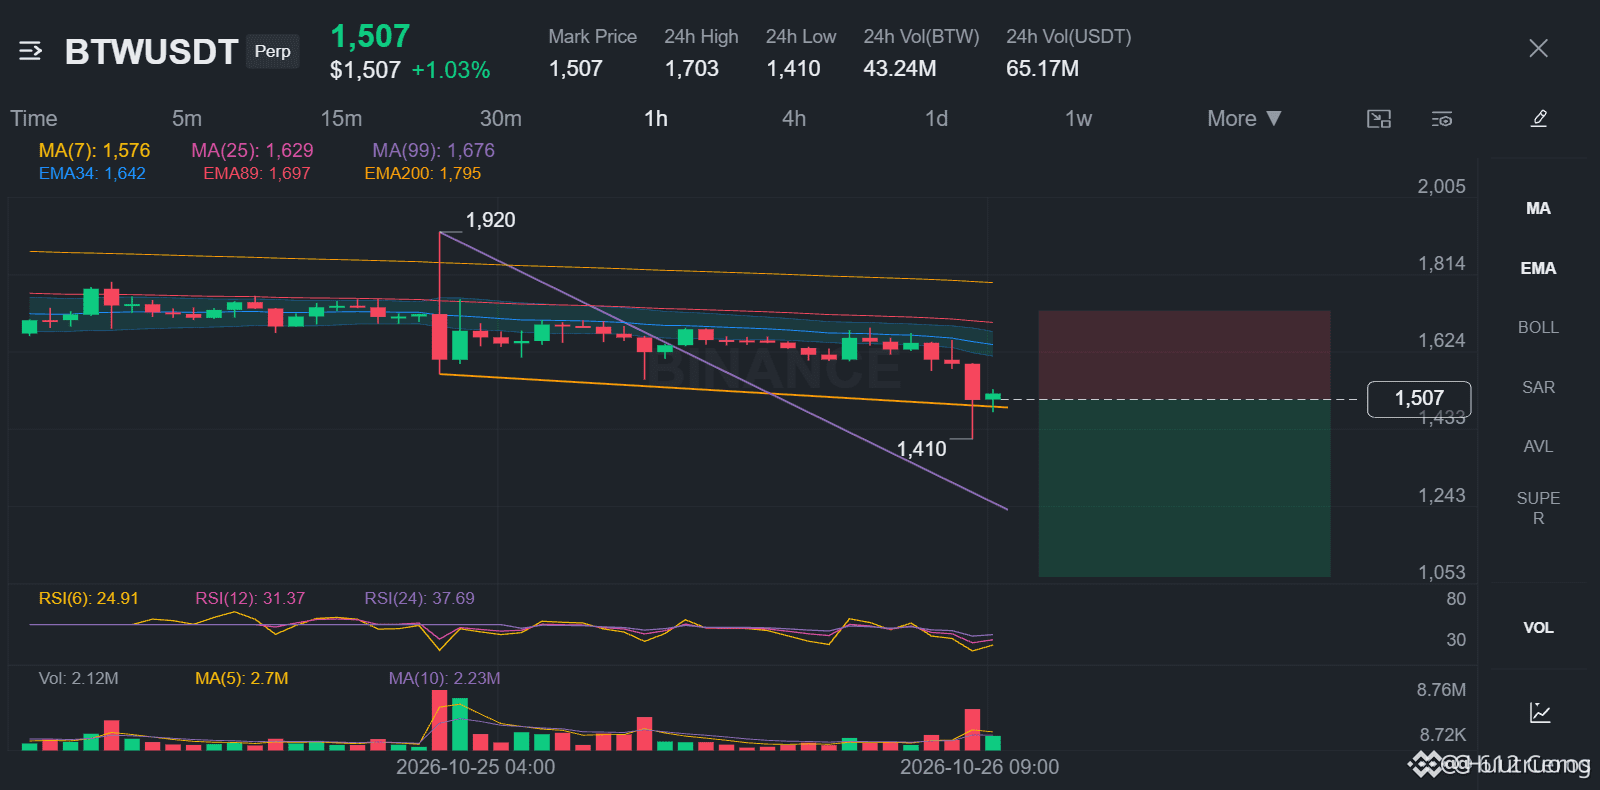
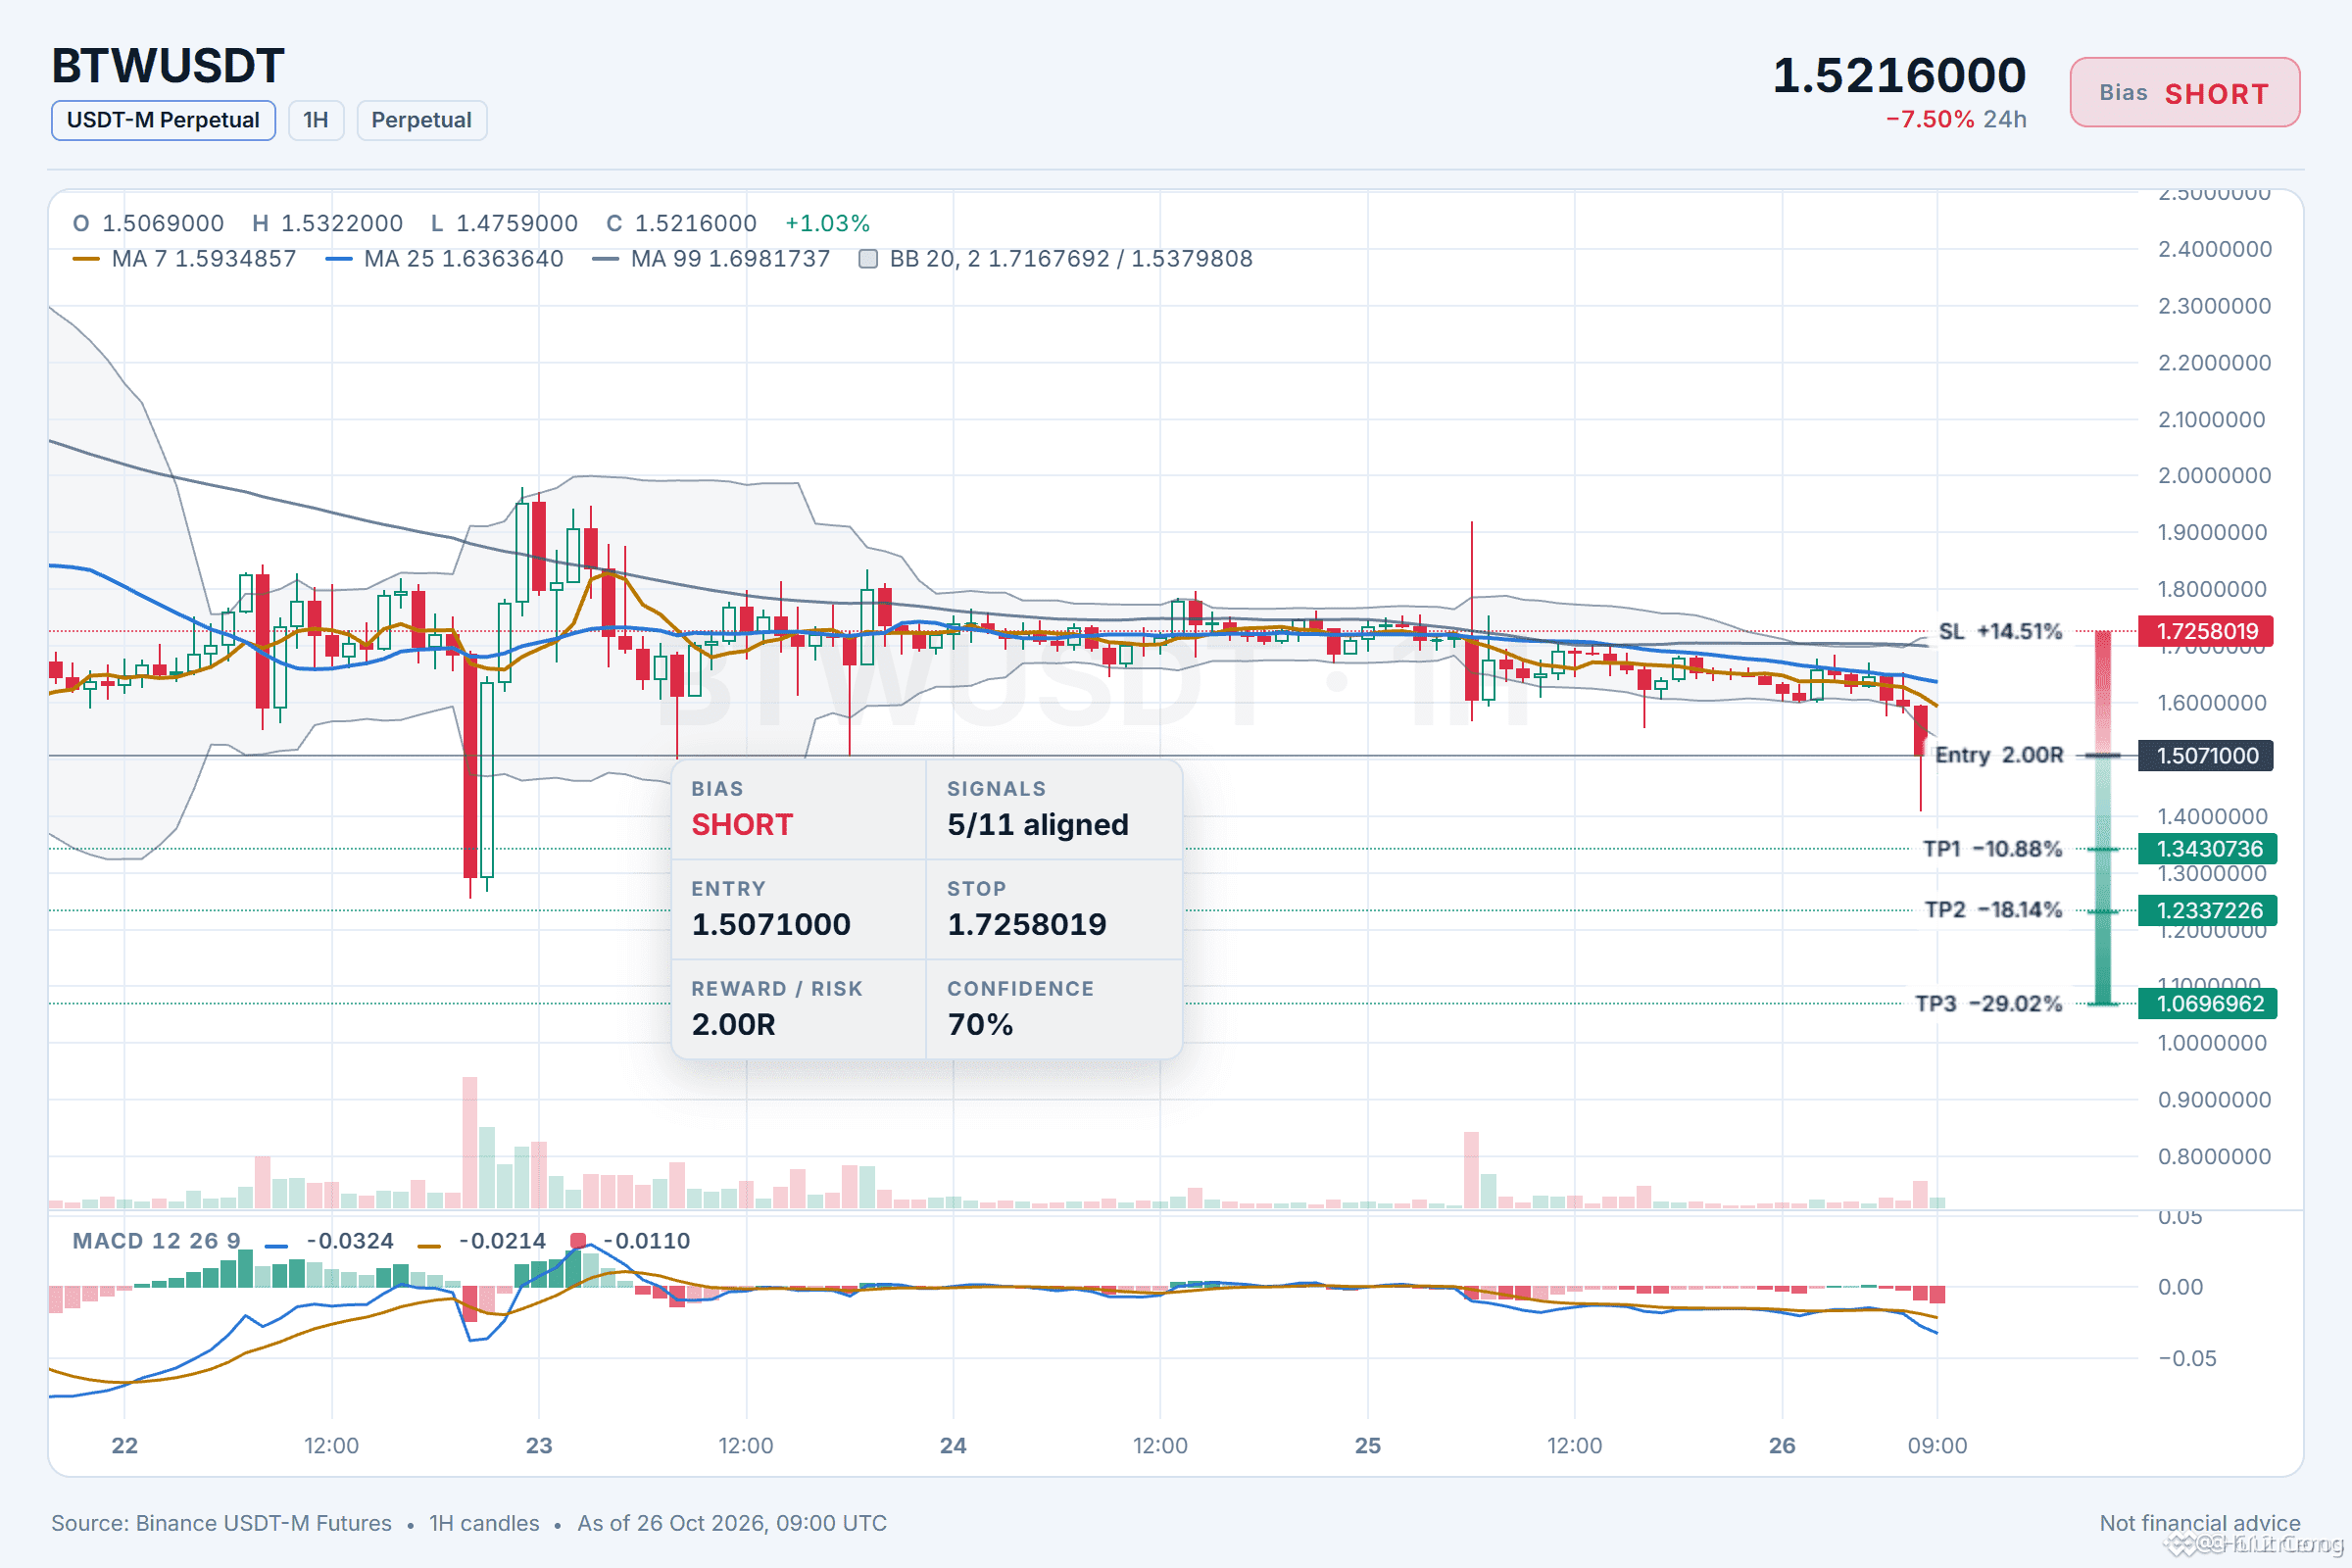
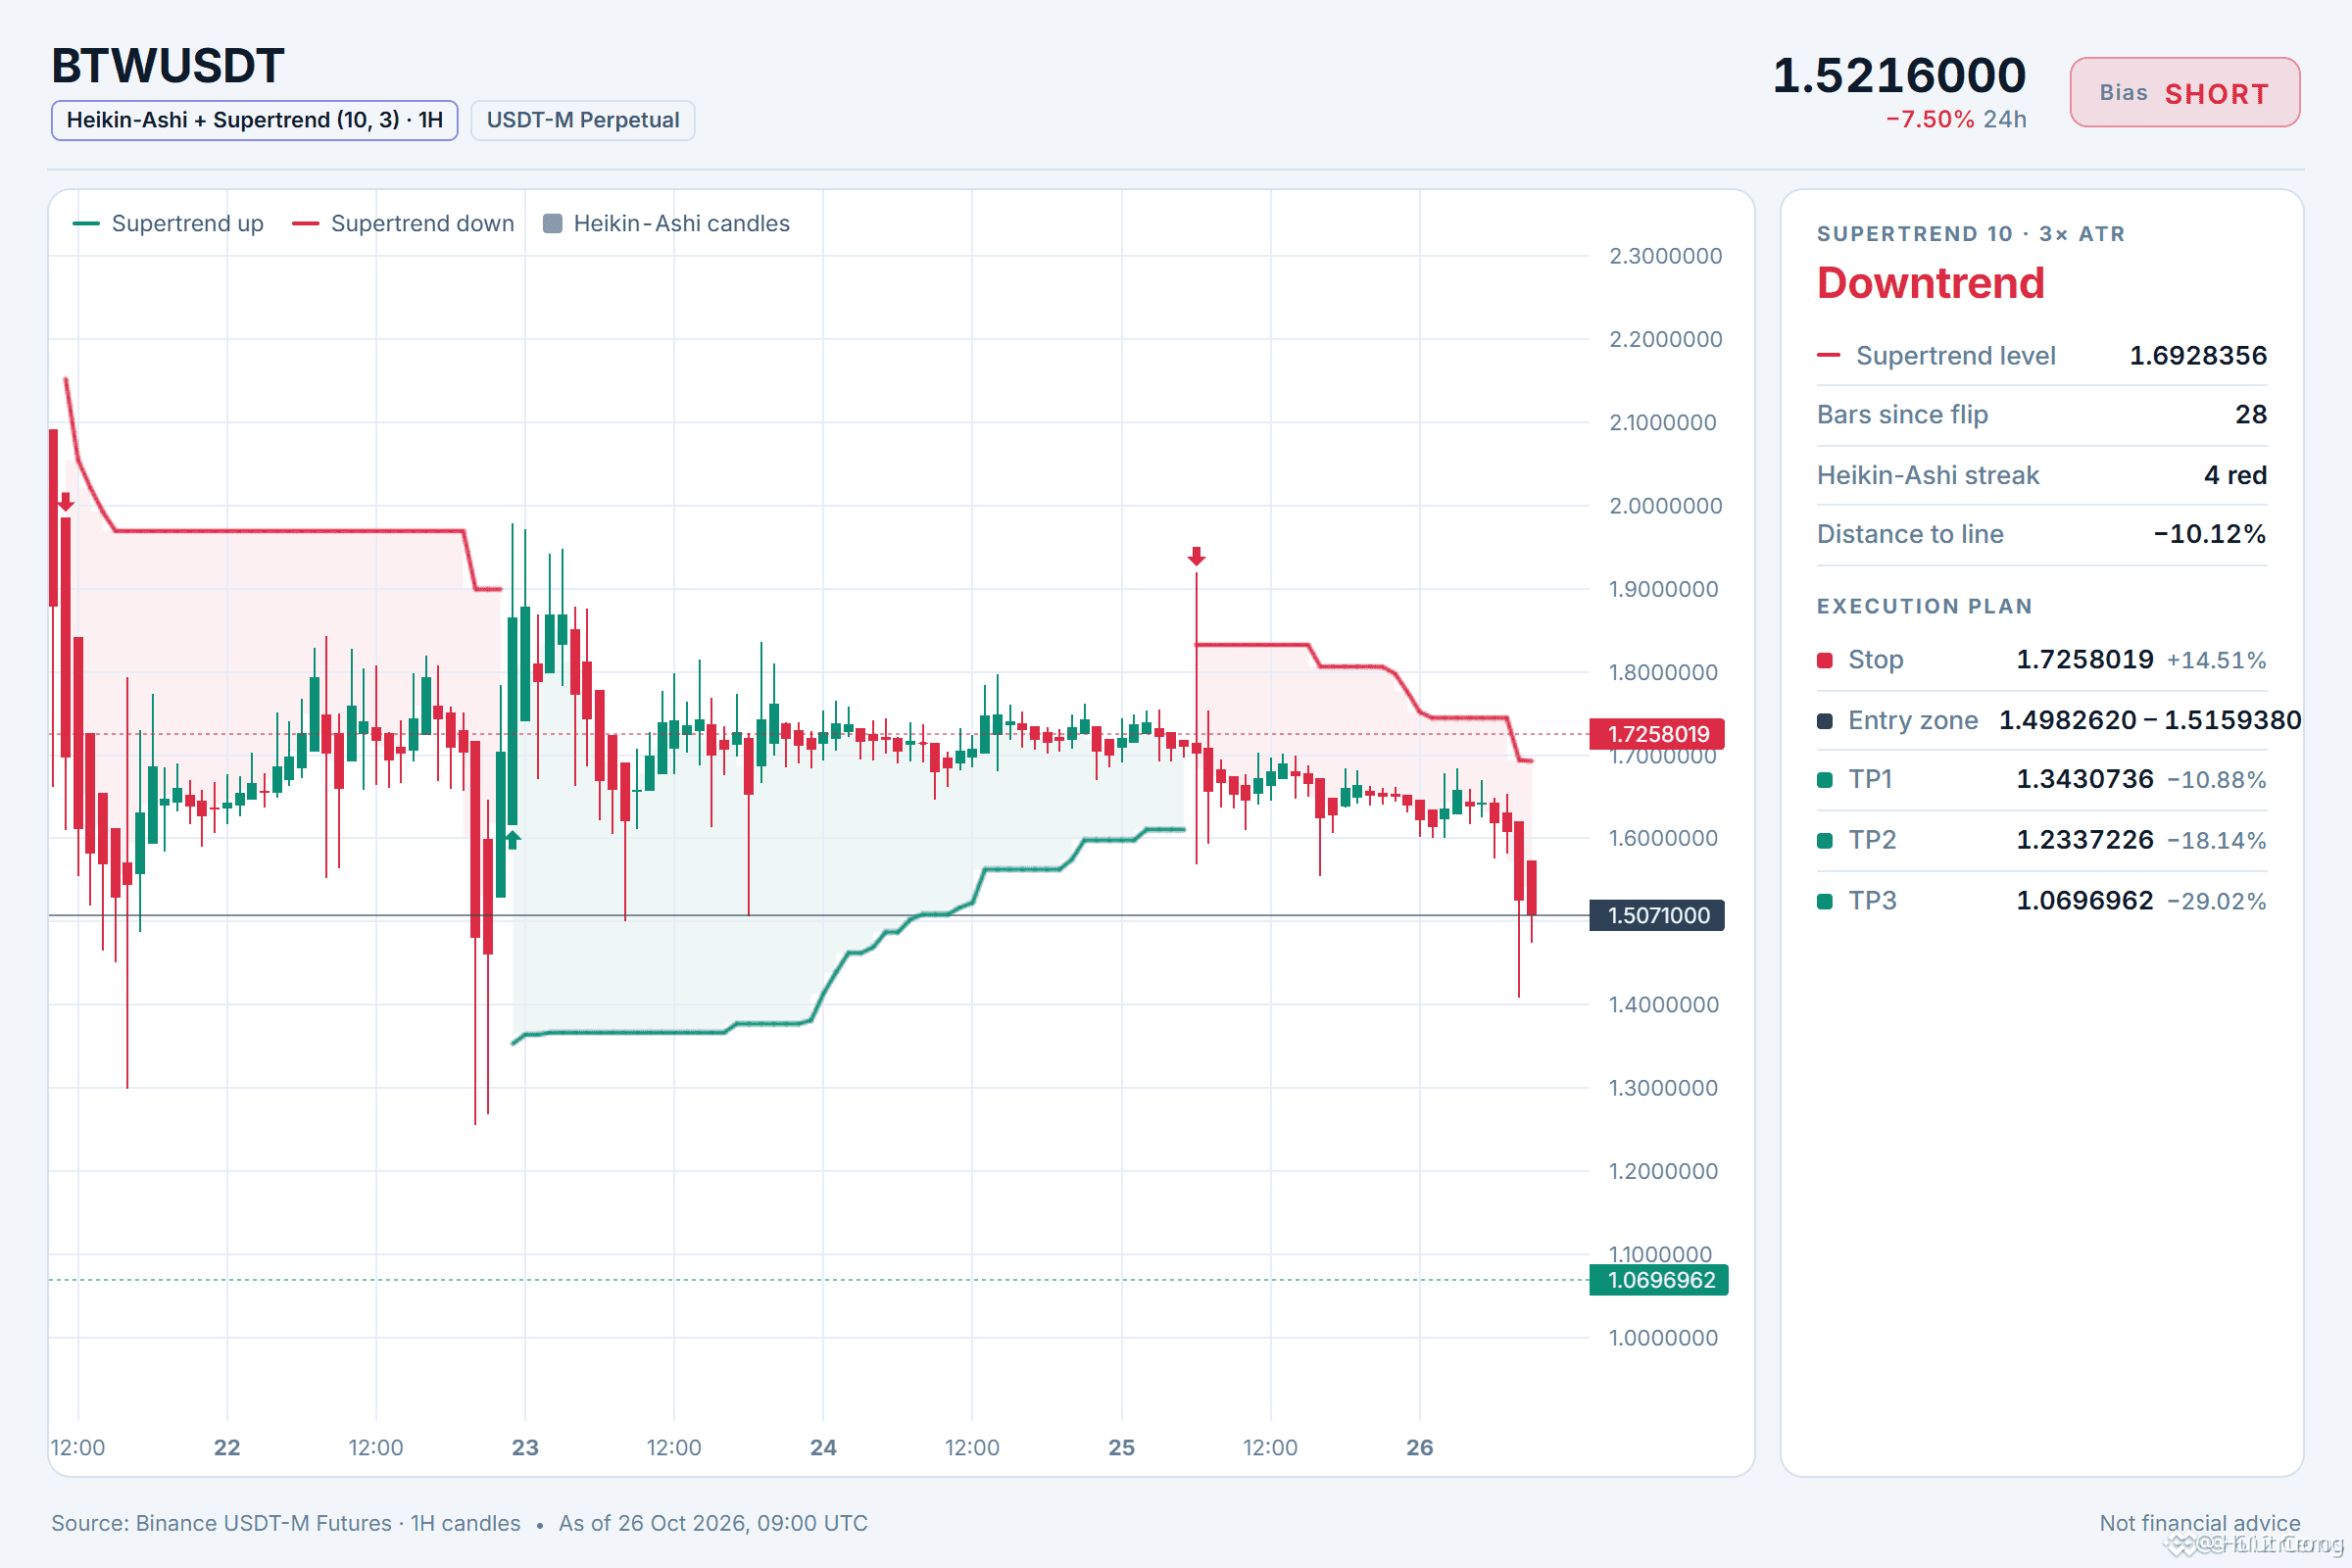
🔴 SHORT $BTW /USDT: expecting price to go DOWN
Bias: SHORT · Leaning
Entry: 1.4982620 – 1.5159380
TP1: 1.3430736 (-10.9%)
TP2: 1.2337226 (-18.1%)
TP3: 1.0696962 (-29.0%)
SL: 1.7258019 (+14.5%)
Plan: enter only inside the zone, close 50% at TP1, 25% at TP2, 25% at TP3, and move the stop to entry after TP1.
Note: moderate conviction only, keep size light.
1h price under EMA50 and EMA200
Why SHORT? 5/11 signals agree, 0 against.
• 1h trend down (below EMA50 & EMA200)
• Sellers are driving the move (15m ADX 35.0)
• Sellers have the momentum (4h RSI 41.4)
1h RSI sits at 33, meaning sellers have clear momentum. Entry is around 1.5071000, and the invalidation sits at 1.7258019.
What is your invalidation level for this short?
7
·
--
Bullisch
Übersetzung ansehen
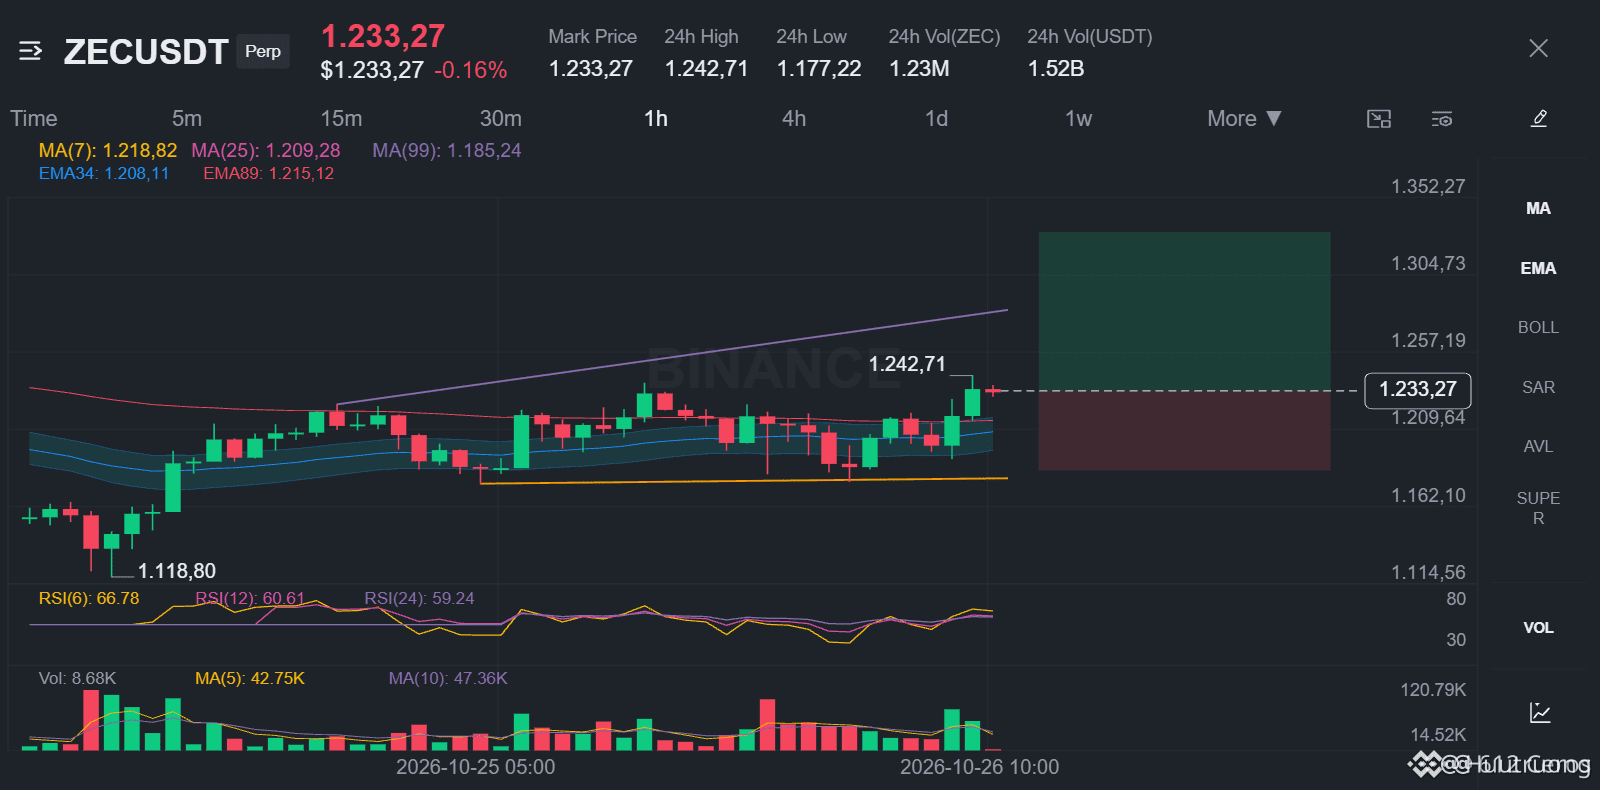
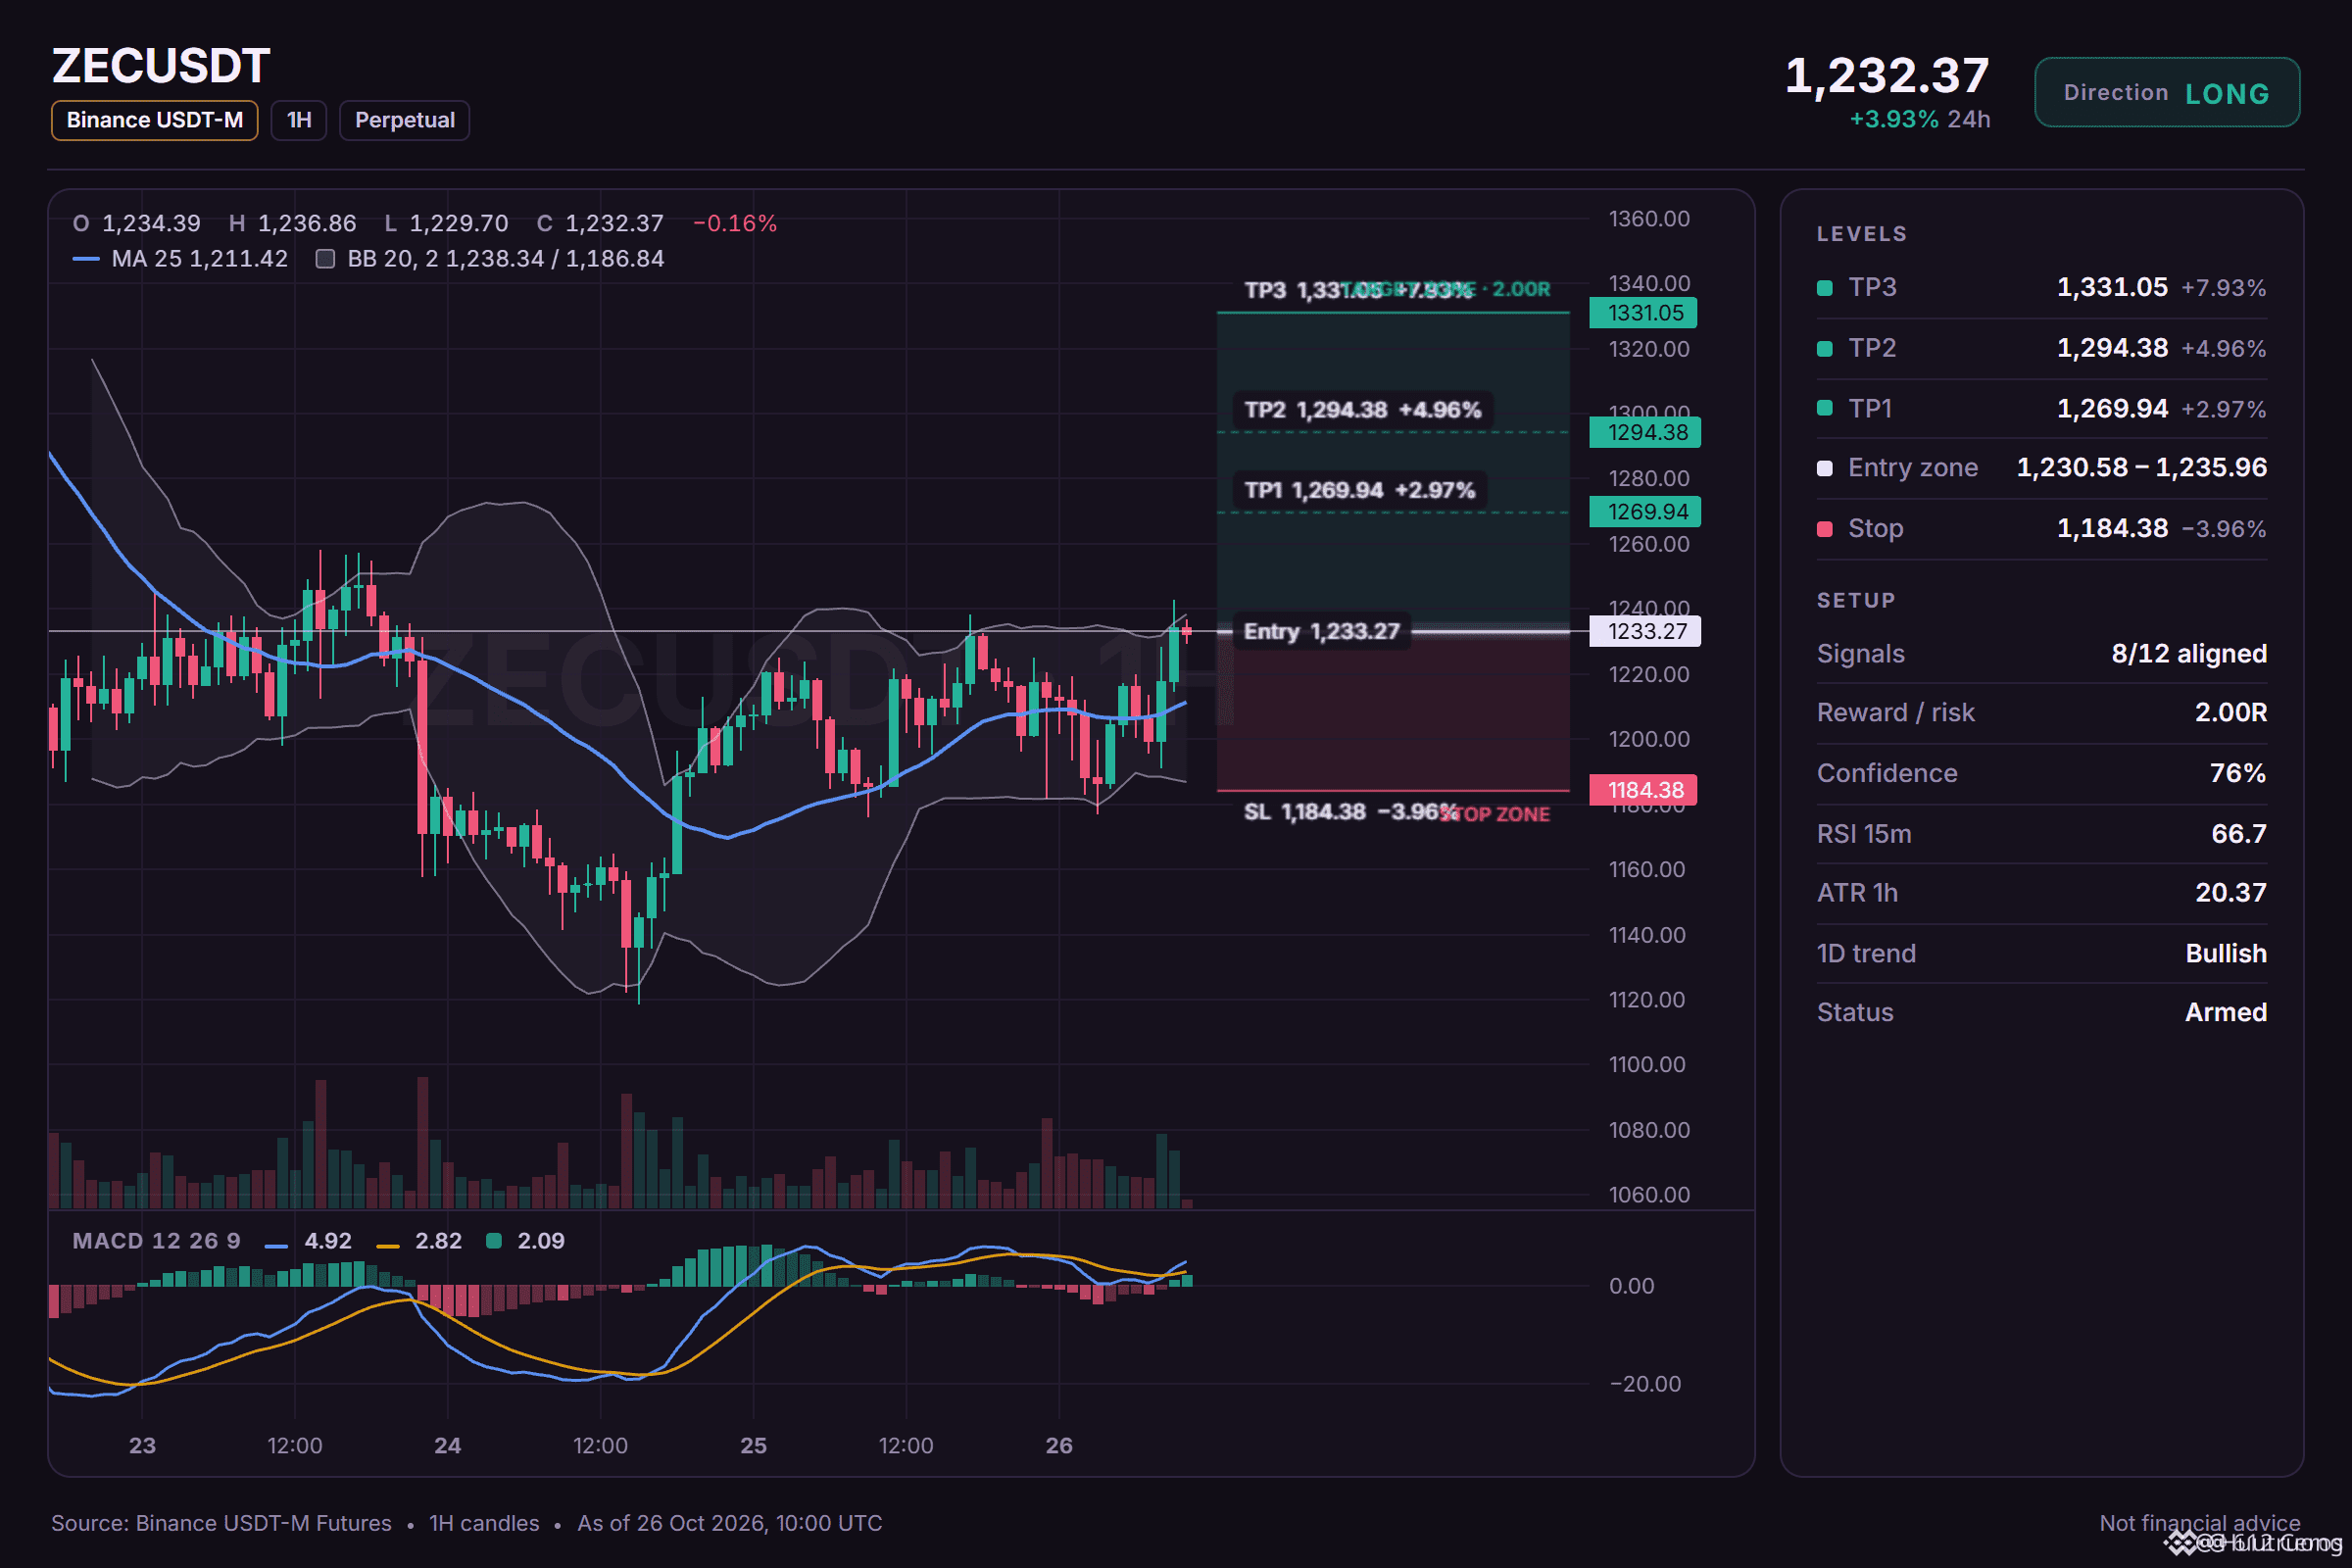
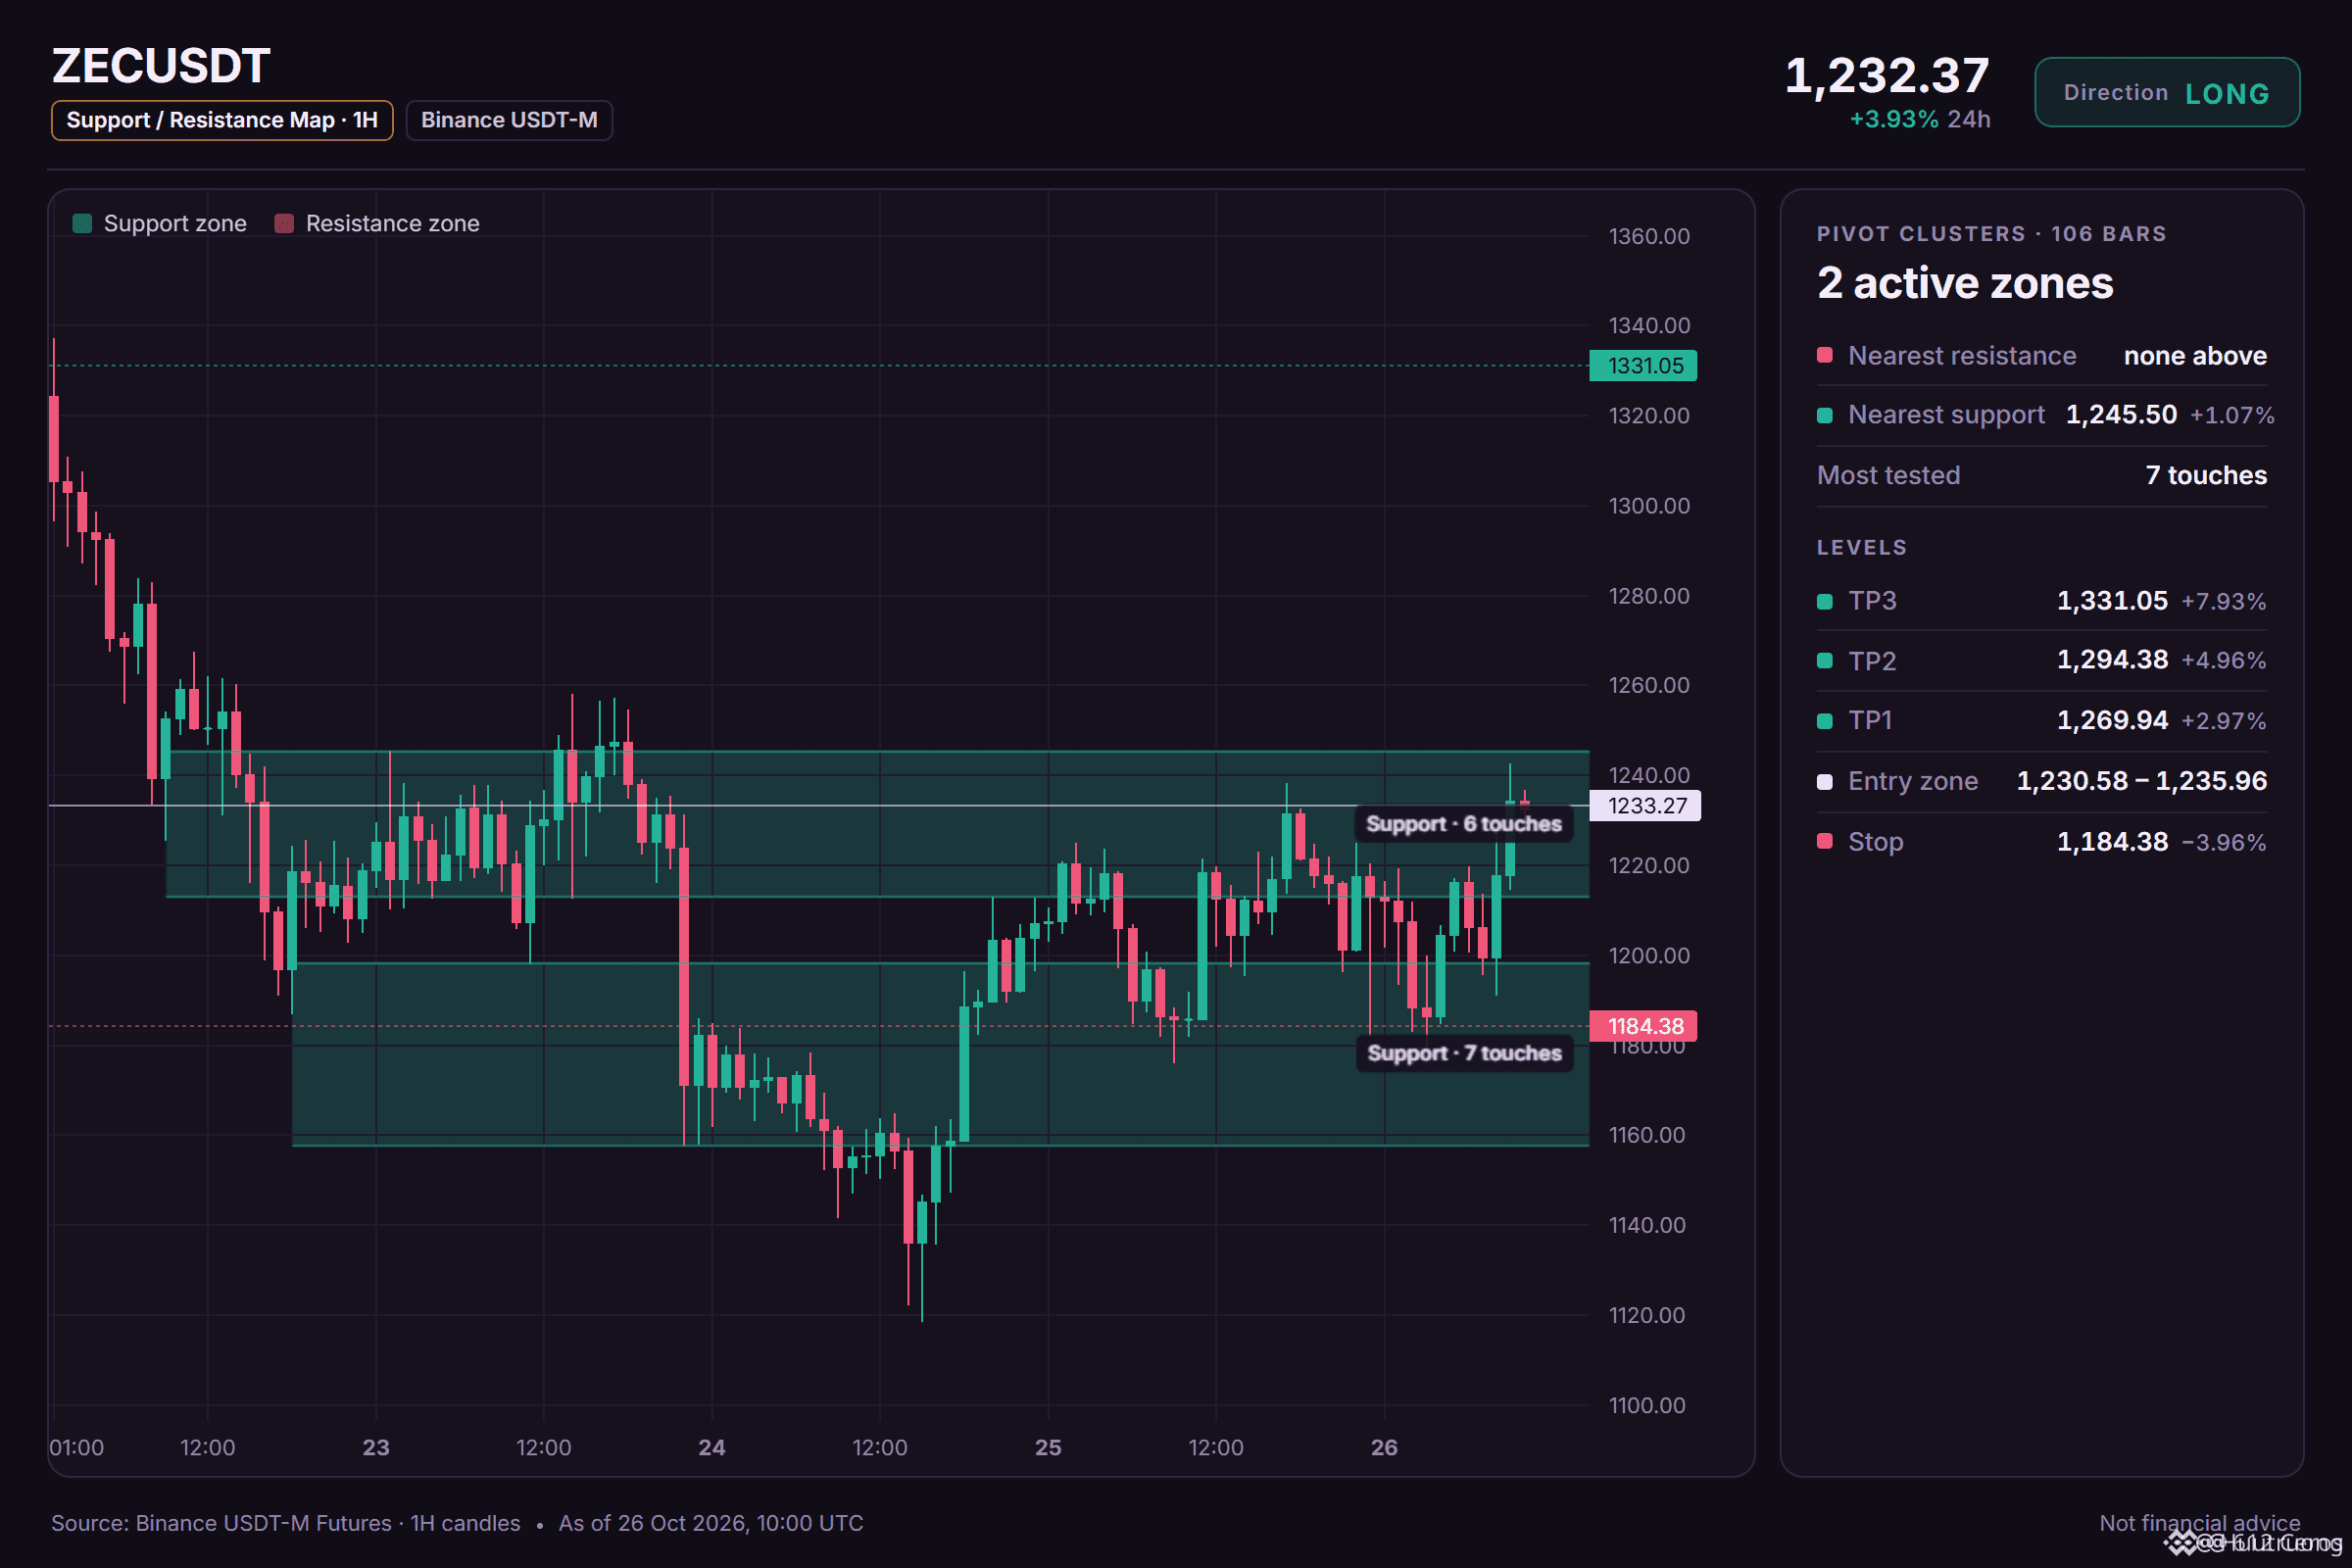
ZEC long setup: the levels I'm watching
🟢 LONG $ZEC /USDT: expecting price to go UP
Bias: LONG · Strong
Entry: 1230.58 – 1235.96
TP1: 1269.94 (+3.0%)
TP2: 1294.38 (+5.0%)
TP3: 1331.05 (+7.9%)
SL: 1184.38 (-4.0%)
Plan: enter only inside the zone, close 50% at TP1, 25% at TP2, 25% at TP3, and move the stop to entry after TP1.
Why LONG? 8/12 signals agree, 1 against.
• Daily trend up (above EMA50 & EMA200)
• 1h trend up (above EMA50 & EMA200)
• BTC is rising, this coin follows (corr 0.82)
Risk: Range top, sellers often step in (RSI z +2.01)
Why I like it:
The daily trend reads bullish, and 8/12 signals aligned favour the long side. The plan is to work the 1230.58 – 1235.96 zone, scale out at 1269.94 and 1294.38, and stay patient for 1331.05. A move through 1184.38 means the idea is wrong and the stop does its job.
Does tag 1269.94 first, or the stop?
8
·
--
Bullisch
Übersetzung ansehen
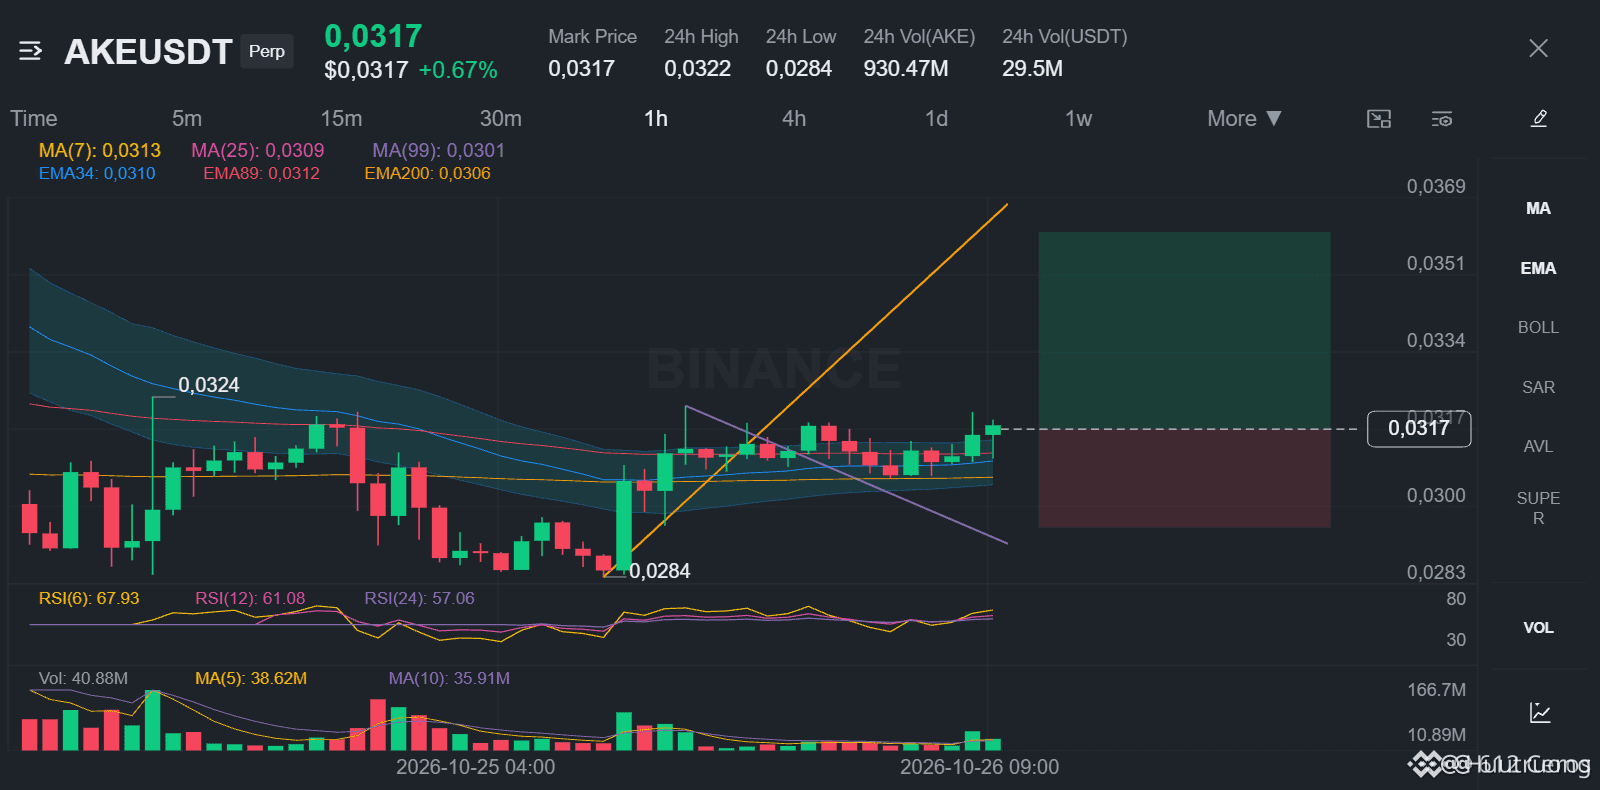
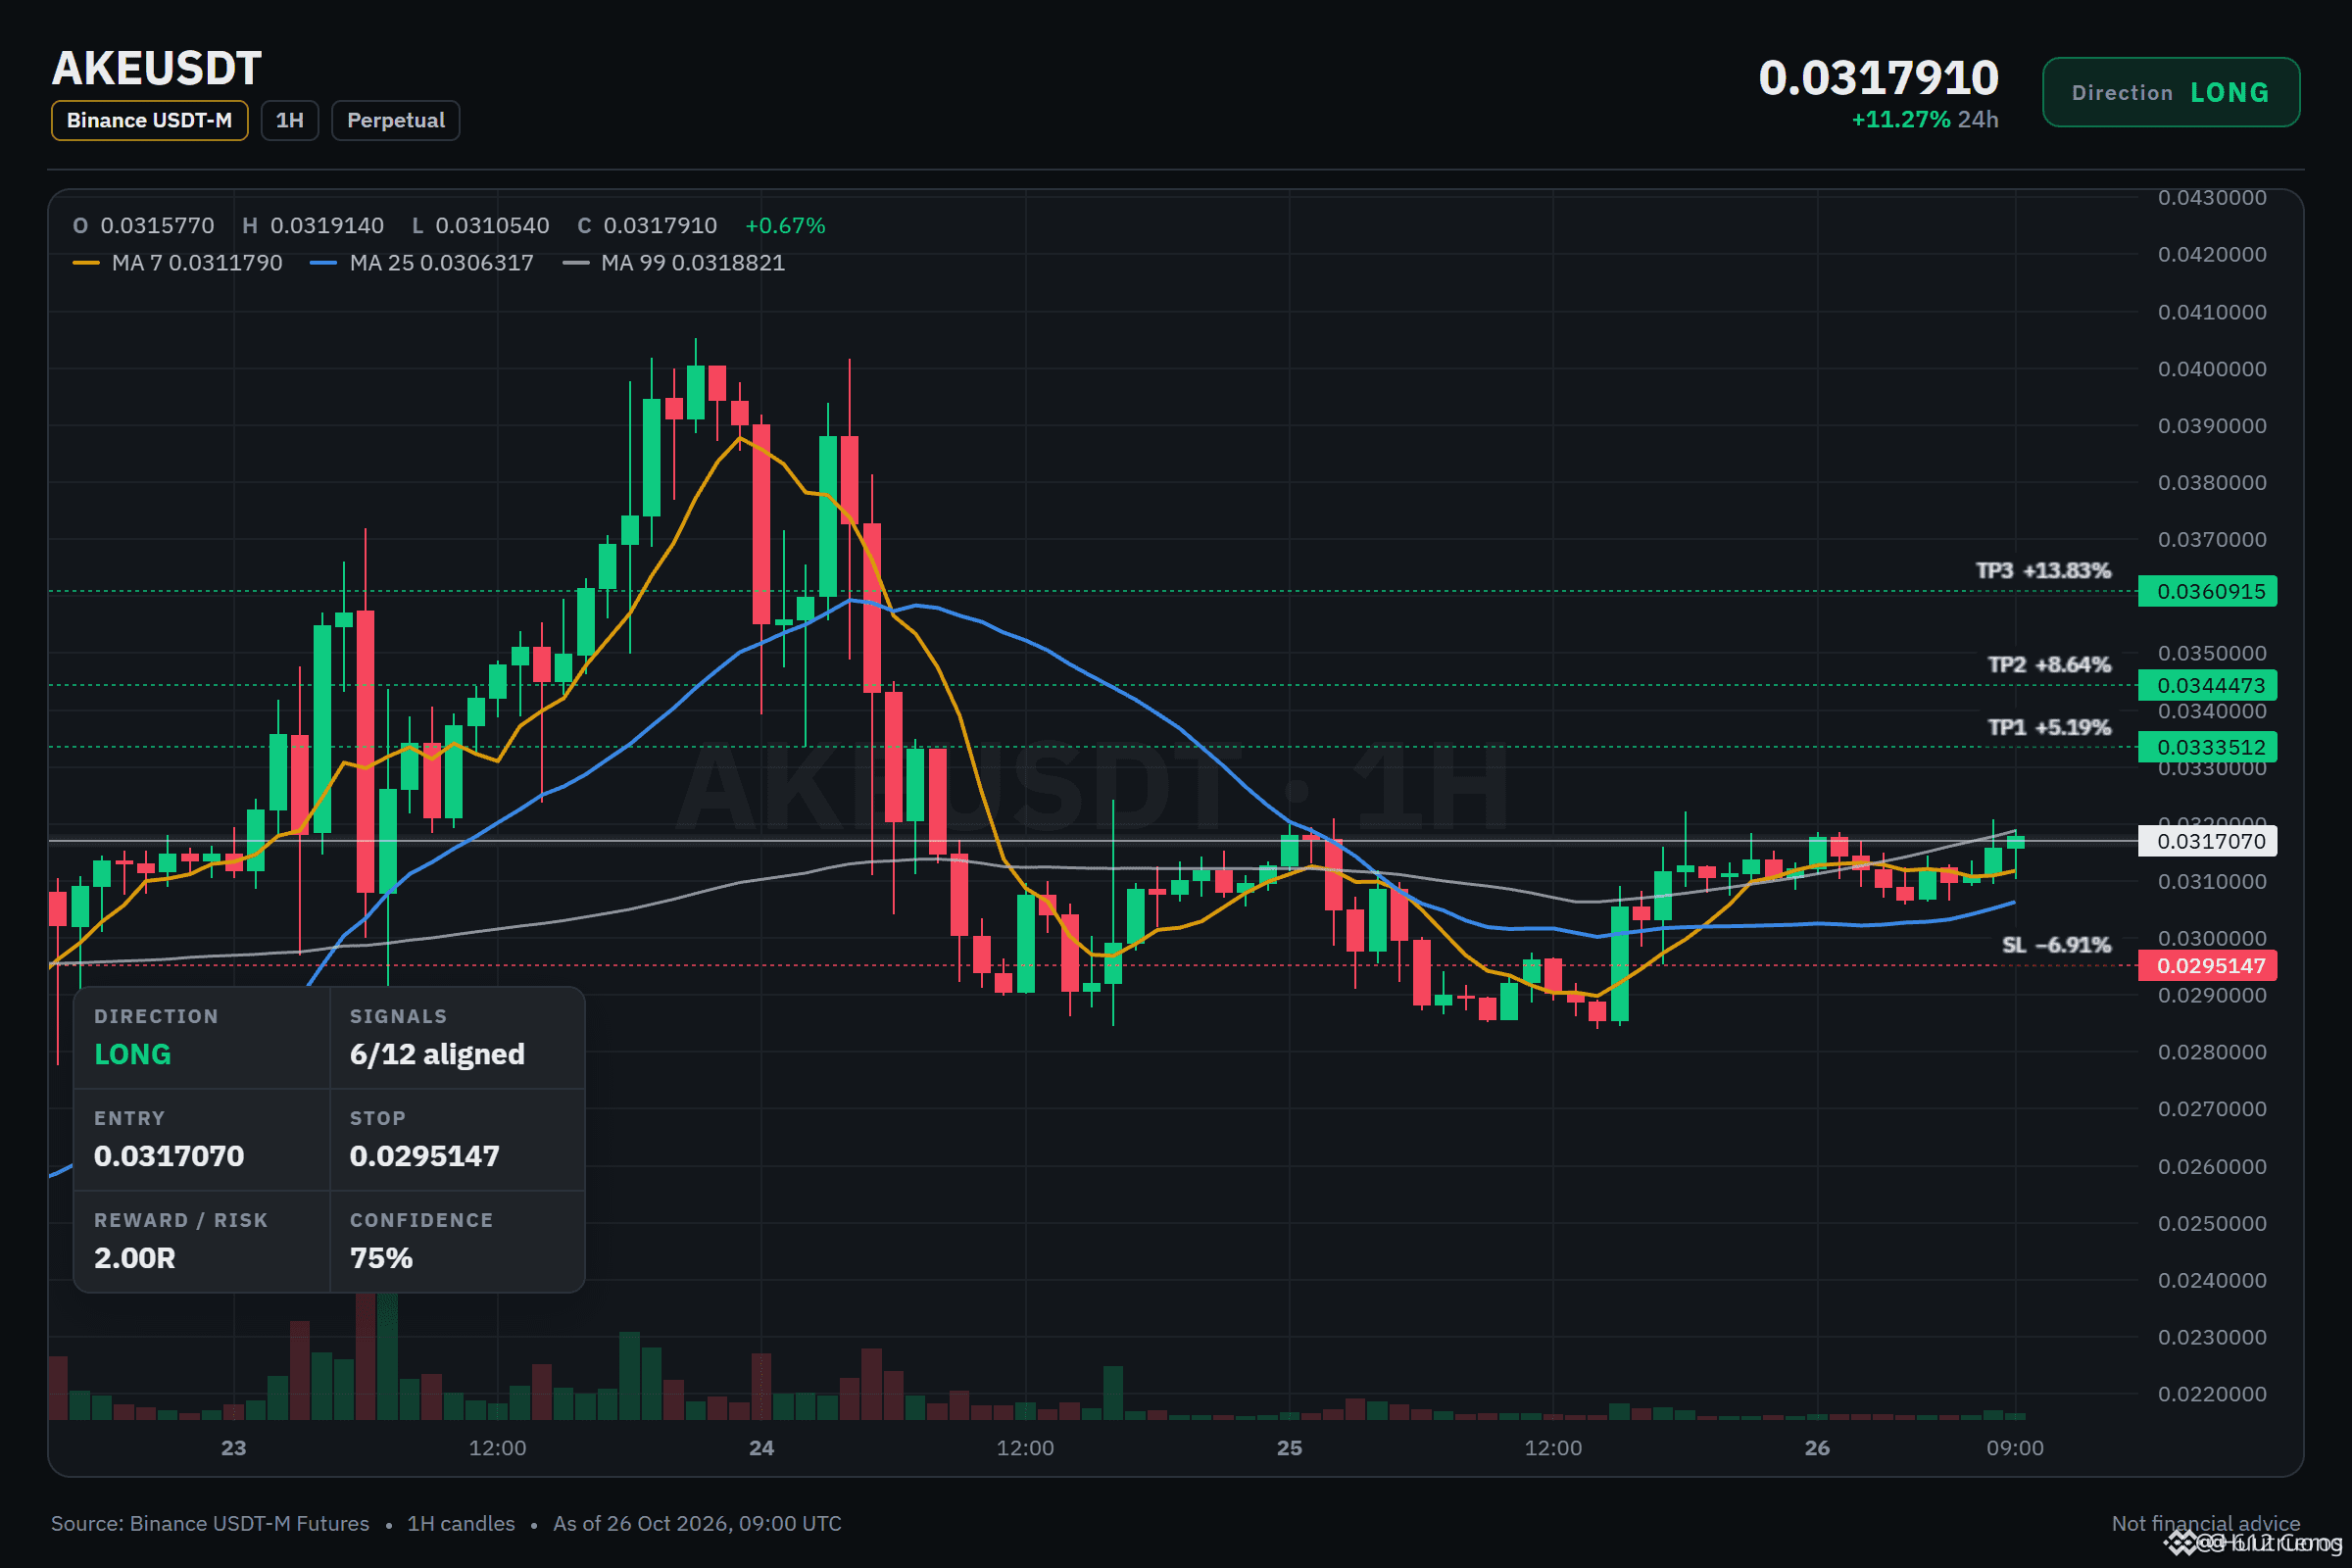
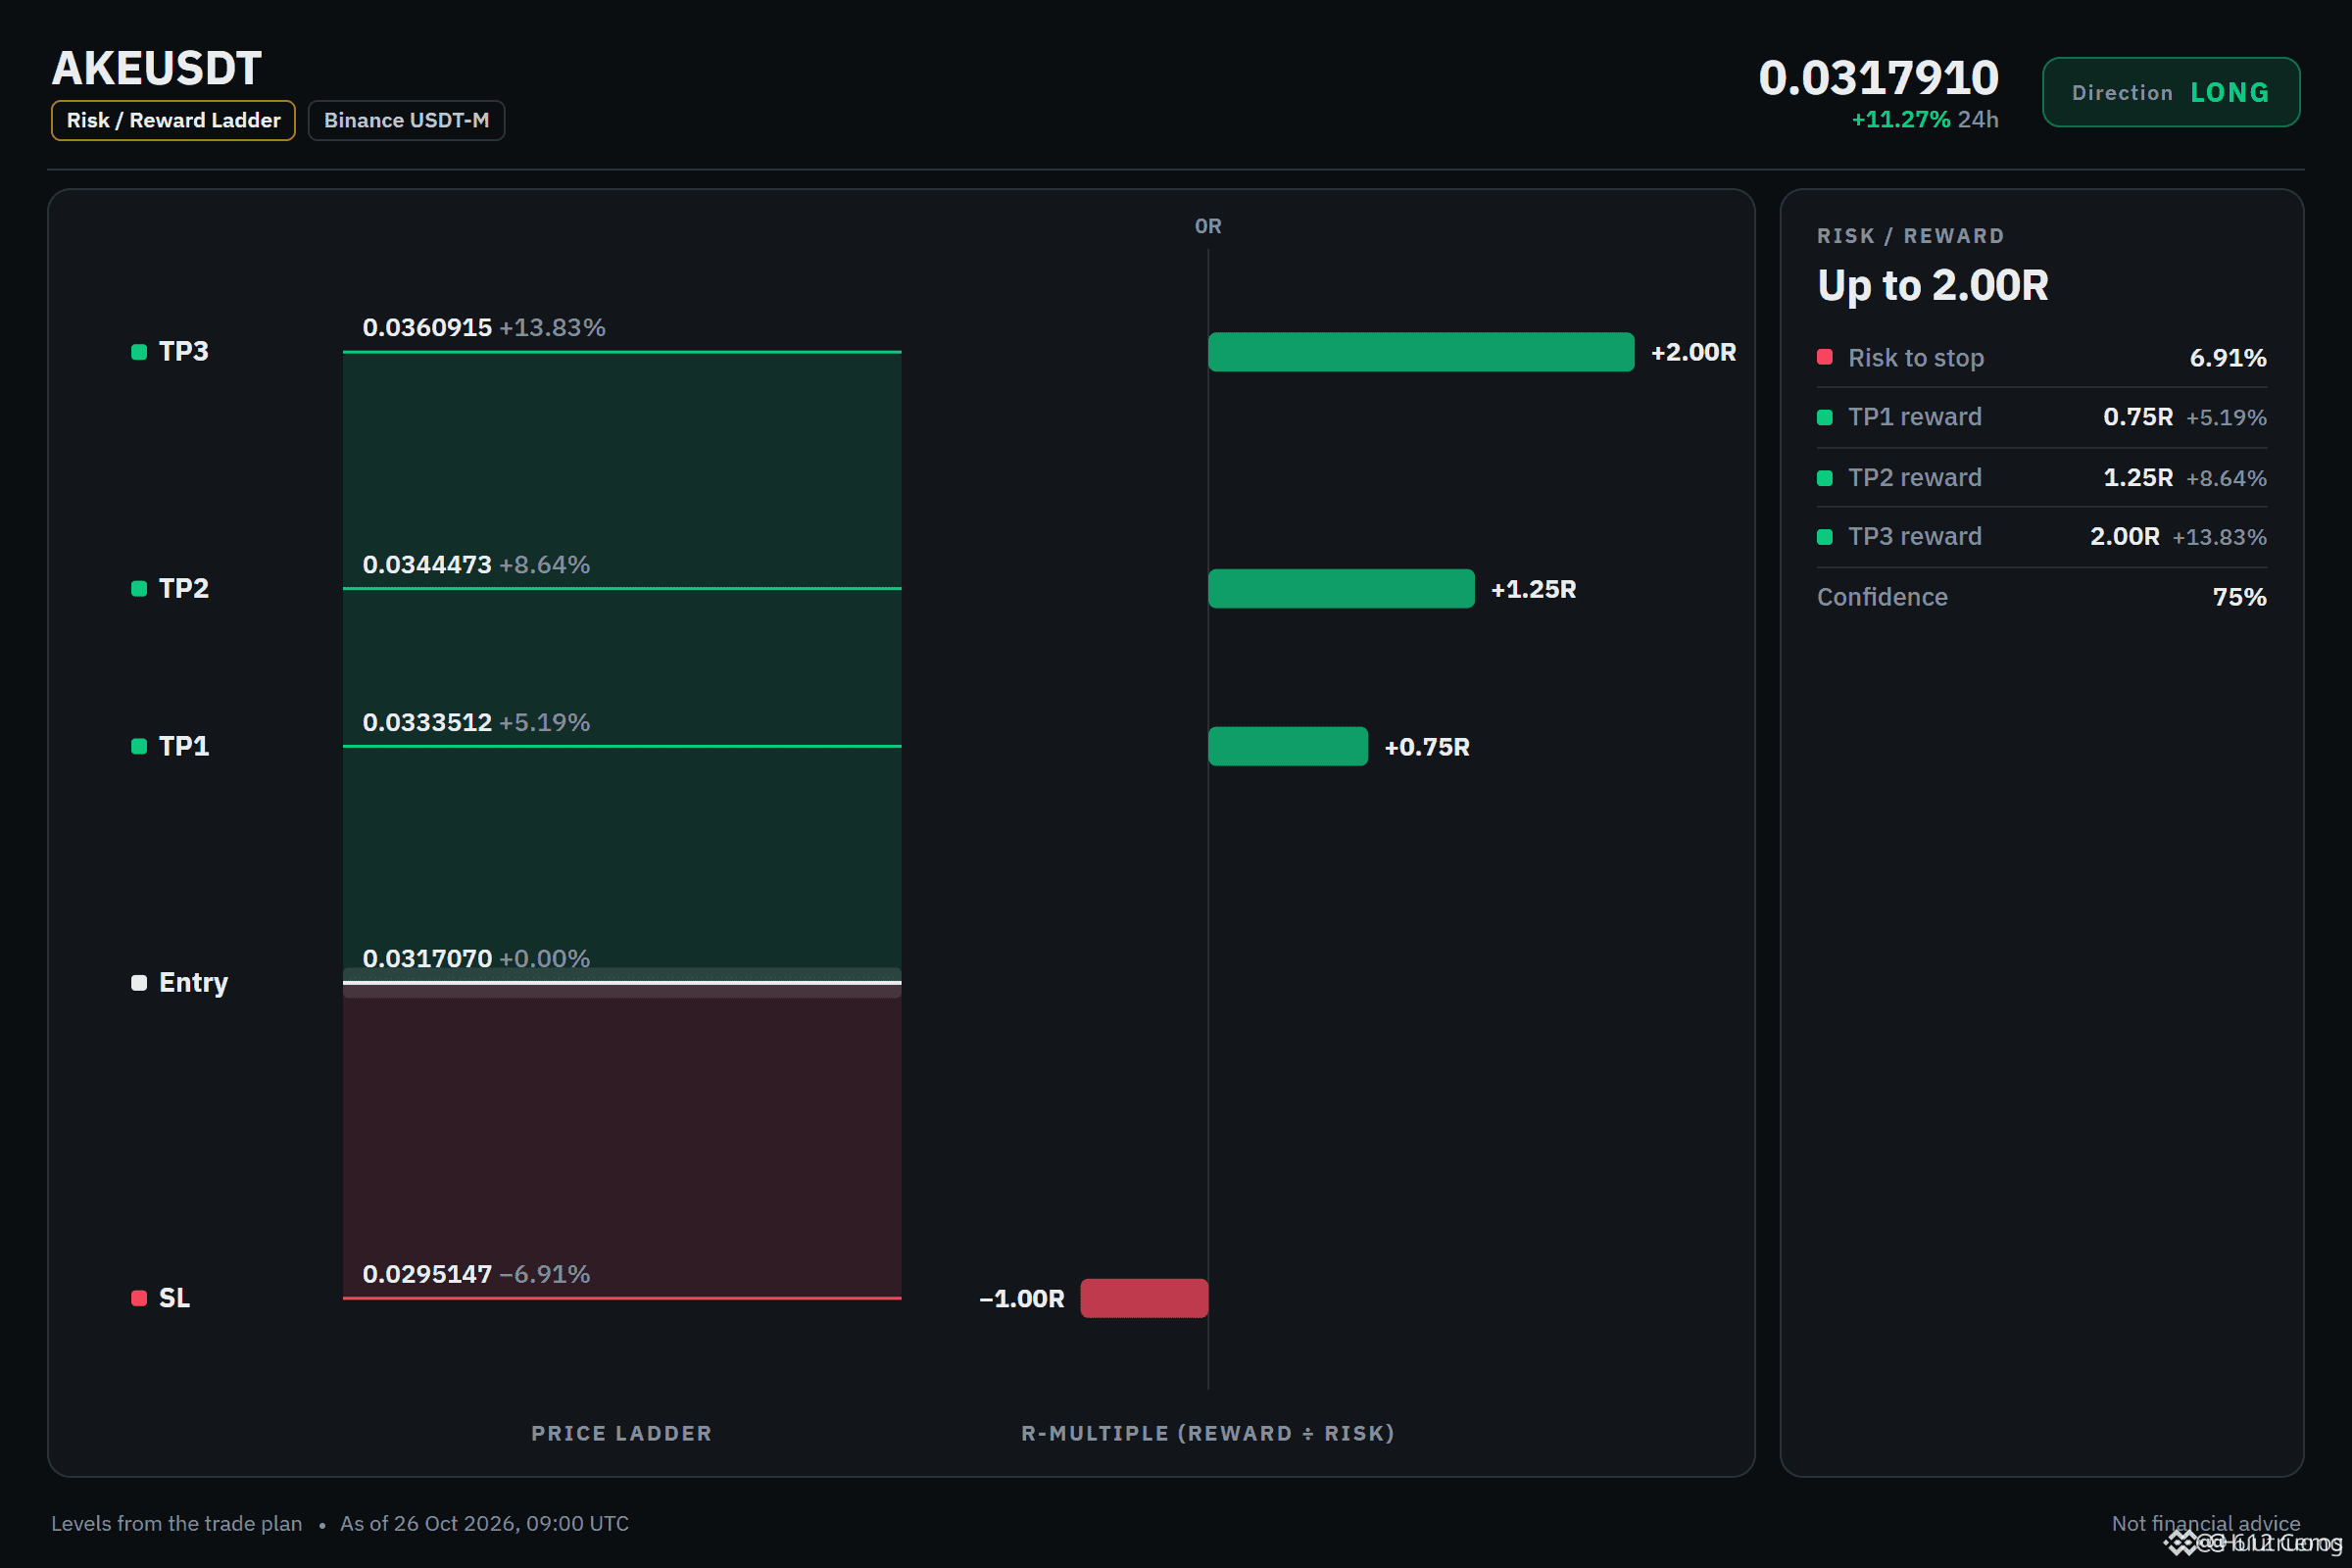
AKE breaks above stacked EMAs on every trend
🟢 LONG $AKE /USDT: expecting price to go UP
Bias: LONG · Strong
Entry: 0.0316008 – 0.0318132
TP1: 0.0333512 (+5.2%)
TP2: 0.0344473 (+8.6%)
TP3: 0.0360915 (+13.8%)
SL: 0.0295147 (-6.9%)
Plan: enter only inside the zone, close 50% at TP1, 25% at TP2, 25% at TP3, and move the stop to entry after TP1.
Why LONG? What I checked: 6/12 agree, 0 against.
• Daily trend up (above EMA50 & EMA200)
• 4h trend up (above EMA50 & EMA200)
• 1h trend up (above EMA50 & EMA200)
Watch: The idea is wrong if price reaches the stop at 0.0295147
Net read: The daily bullish stack (price above EMA50 and EMA200) is the strongest tailwind, while the 4h RSI at 49.8 means momentum is undecided and offers no help.
Where do you want to take profits if AKE keeps rising?
5
·
--
Bärisch
Übersetzung ansehen
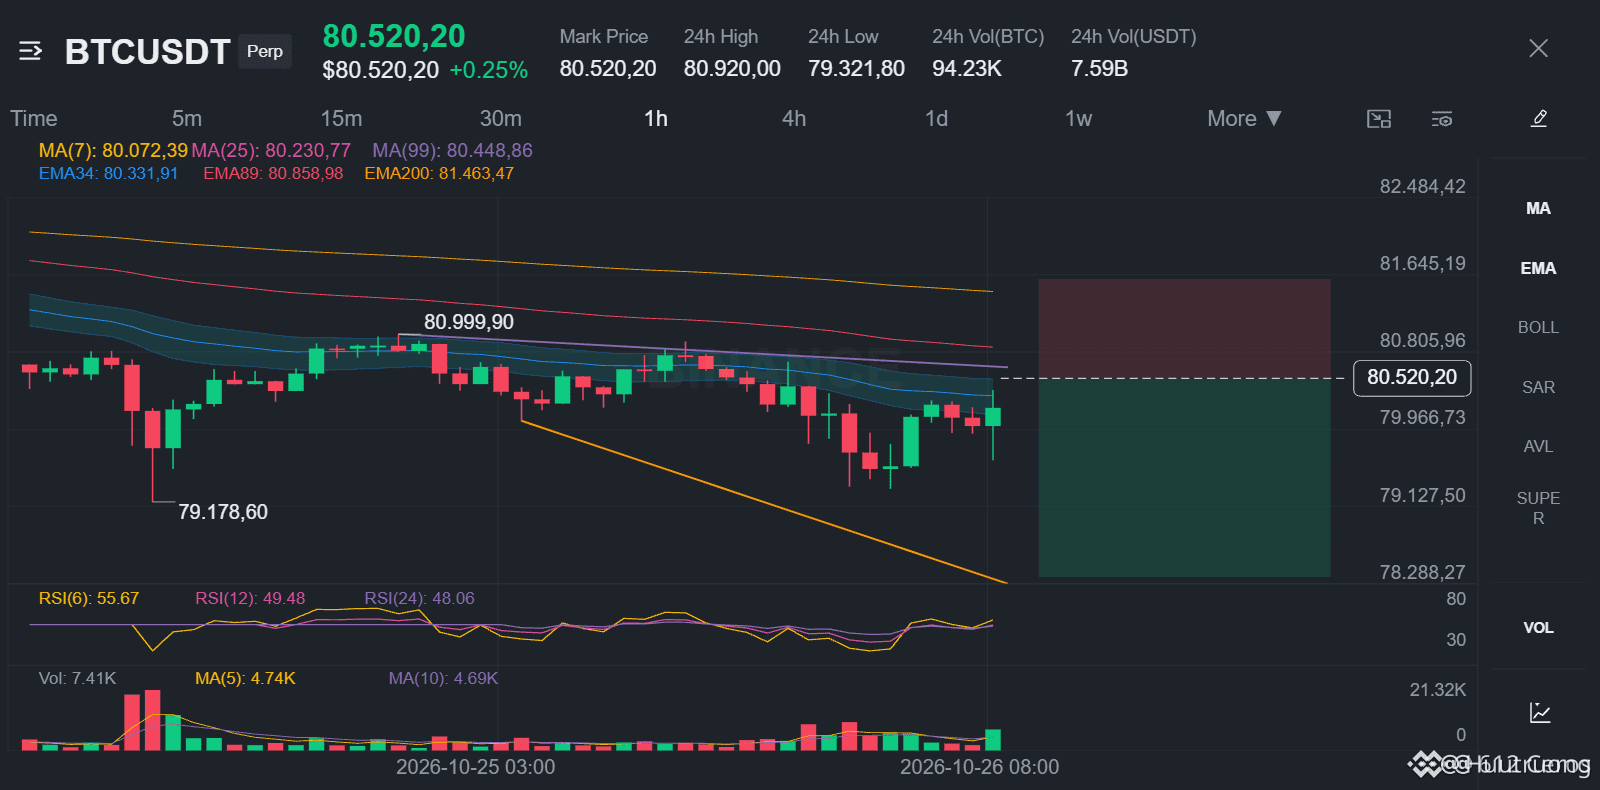
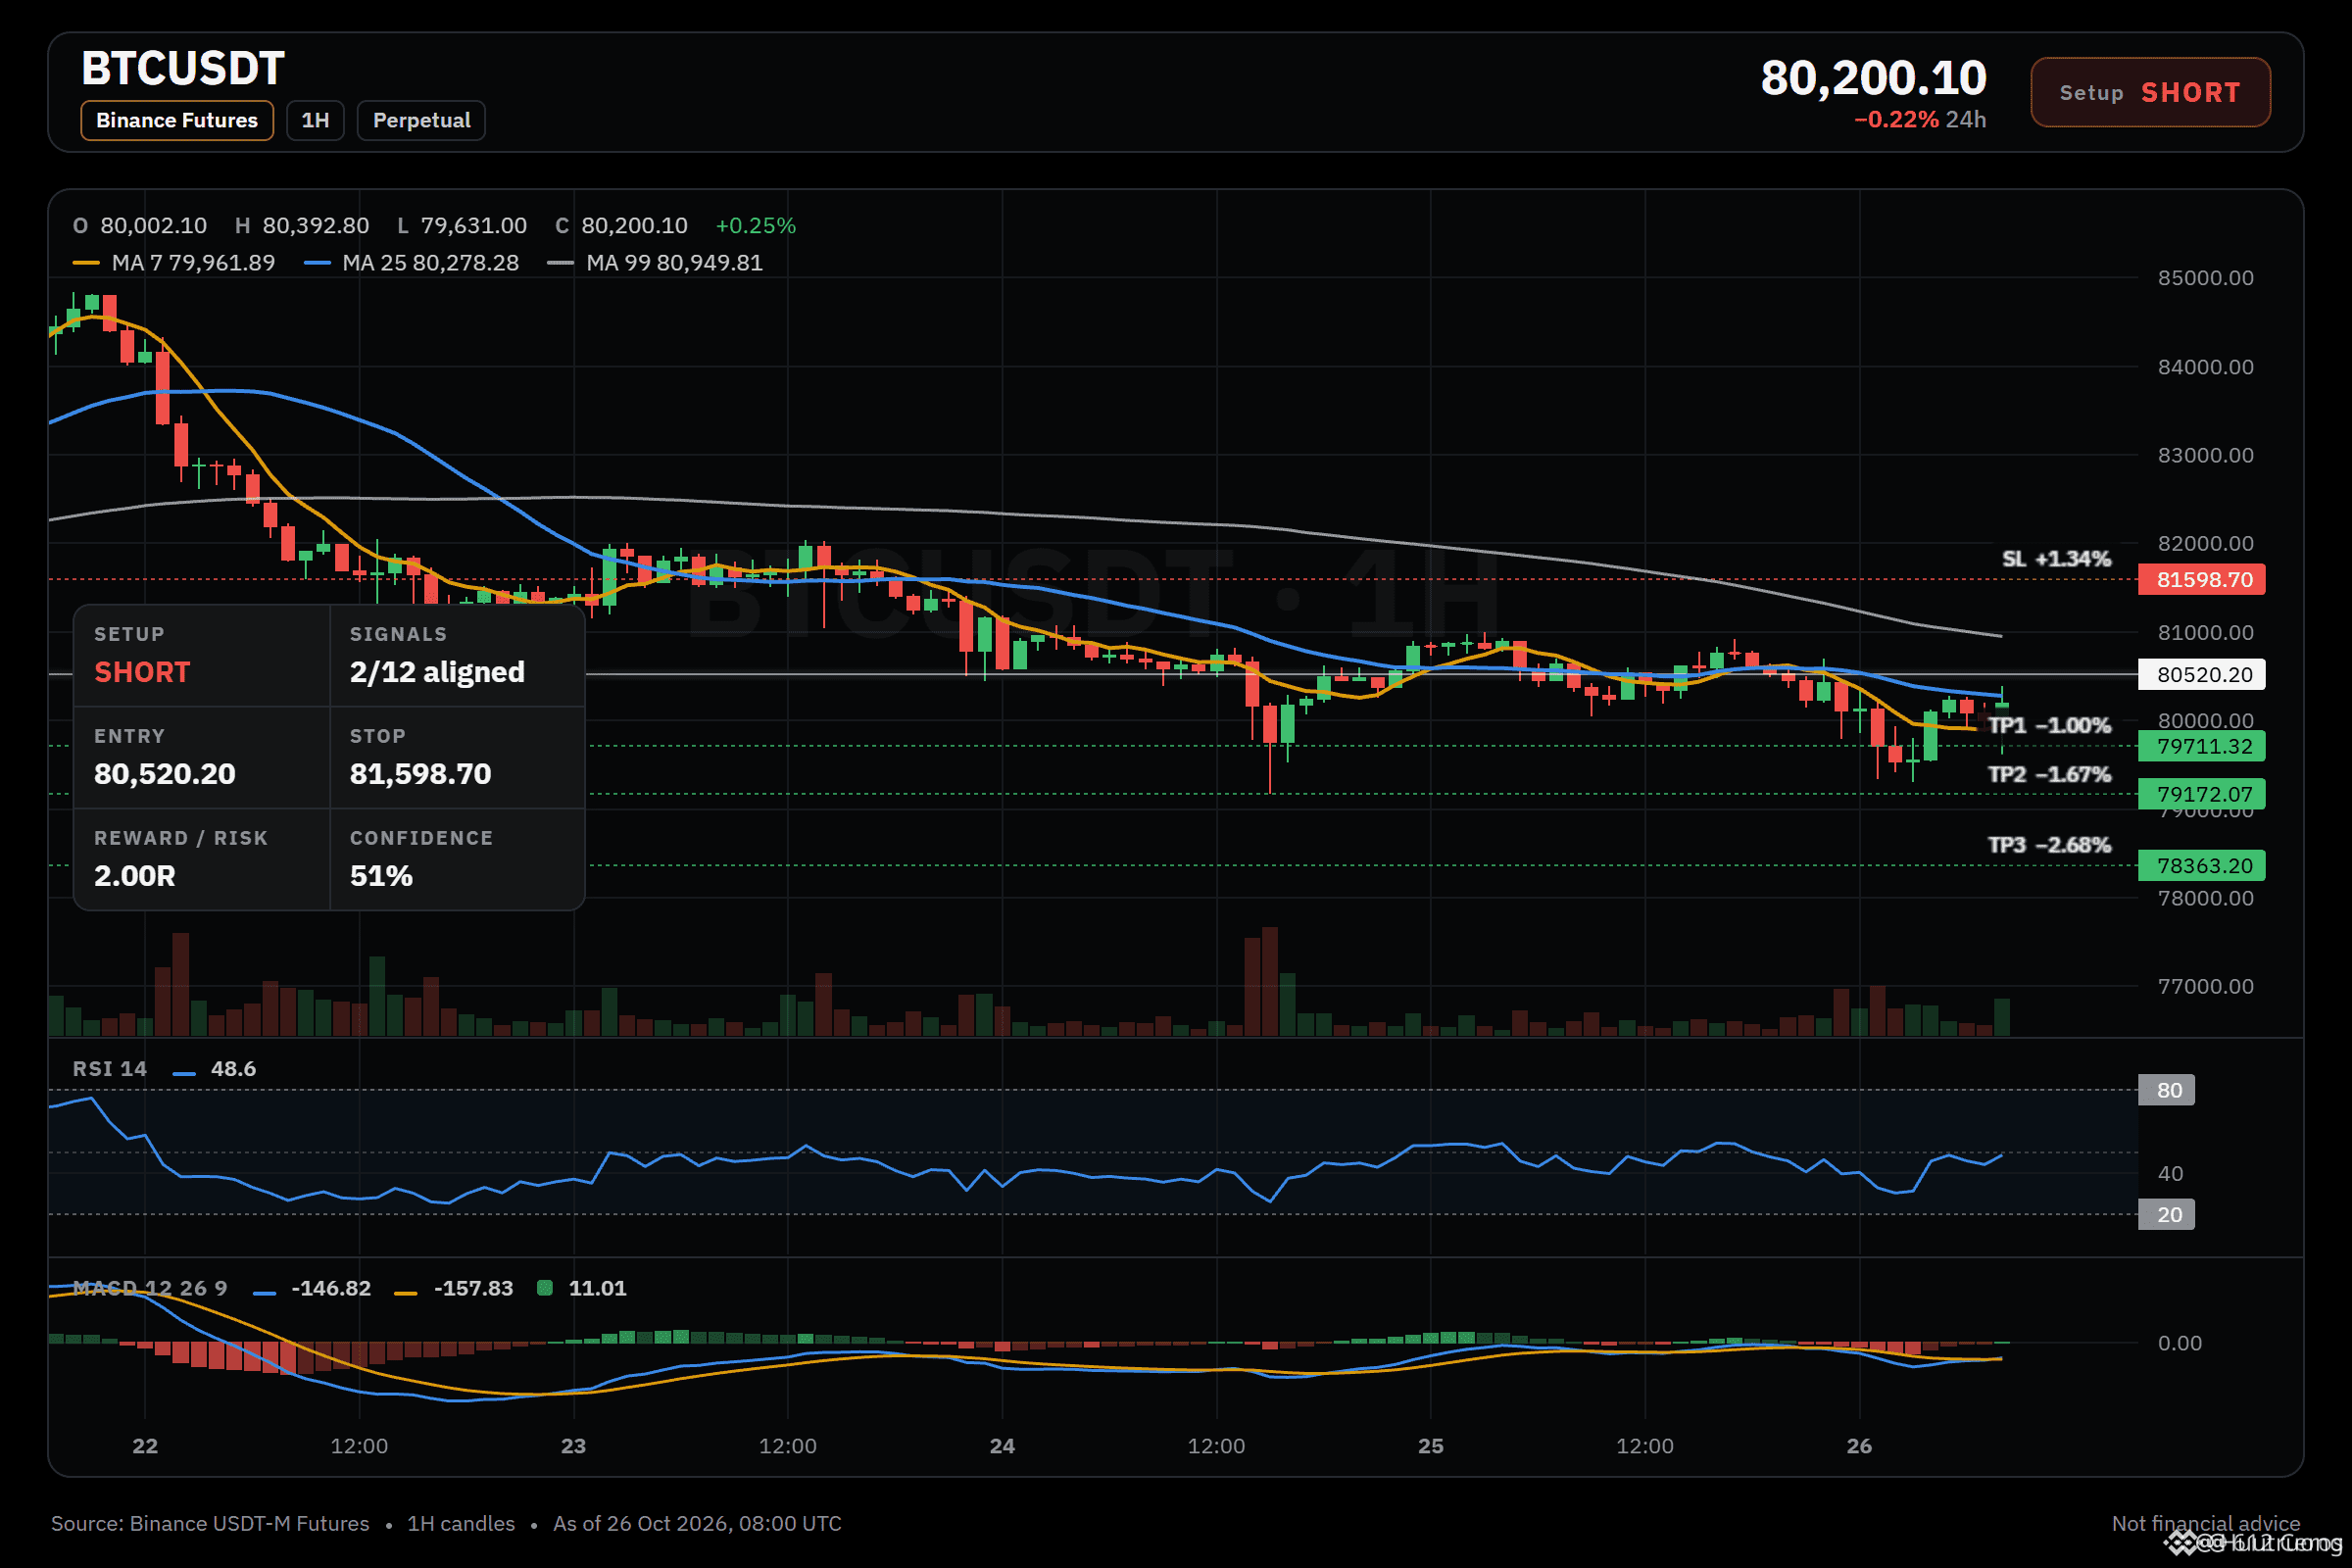
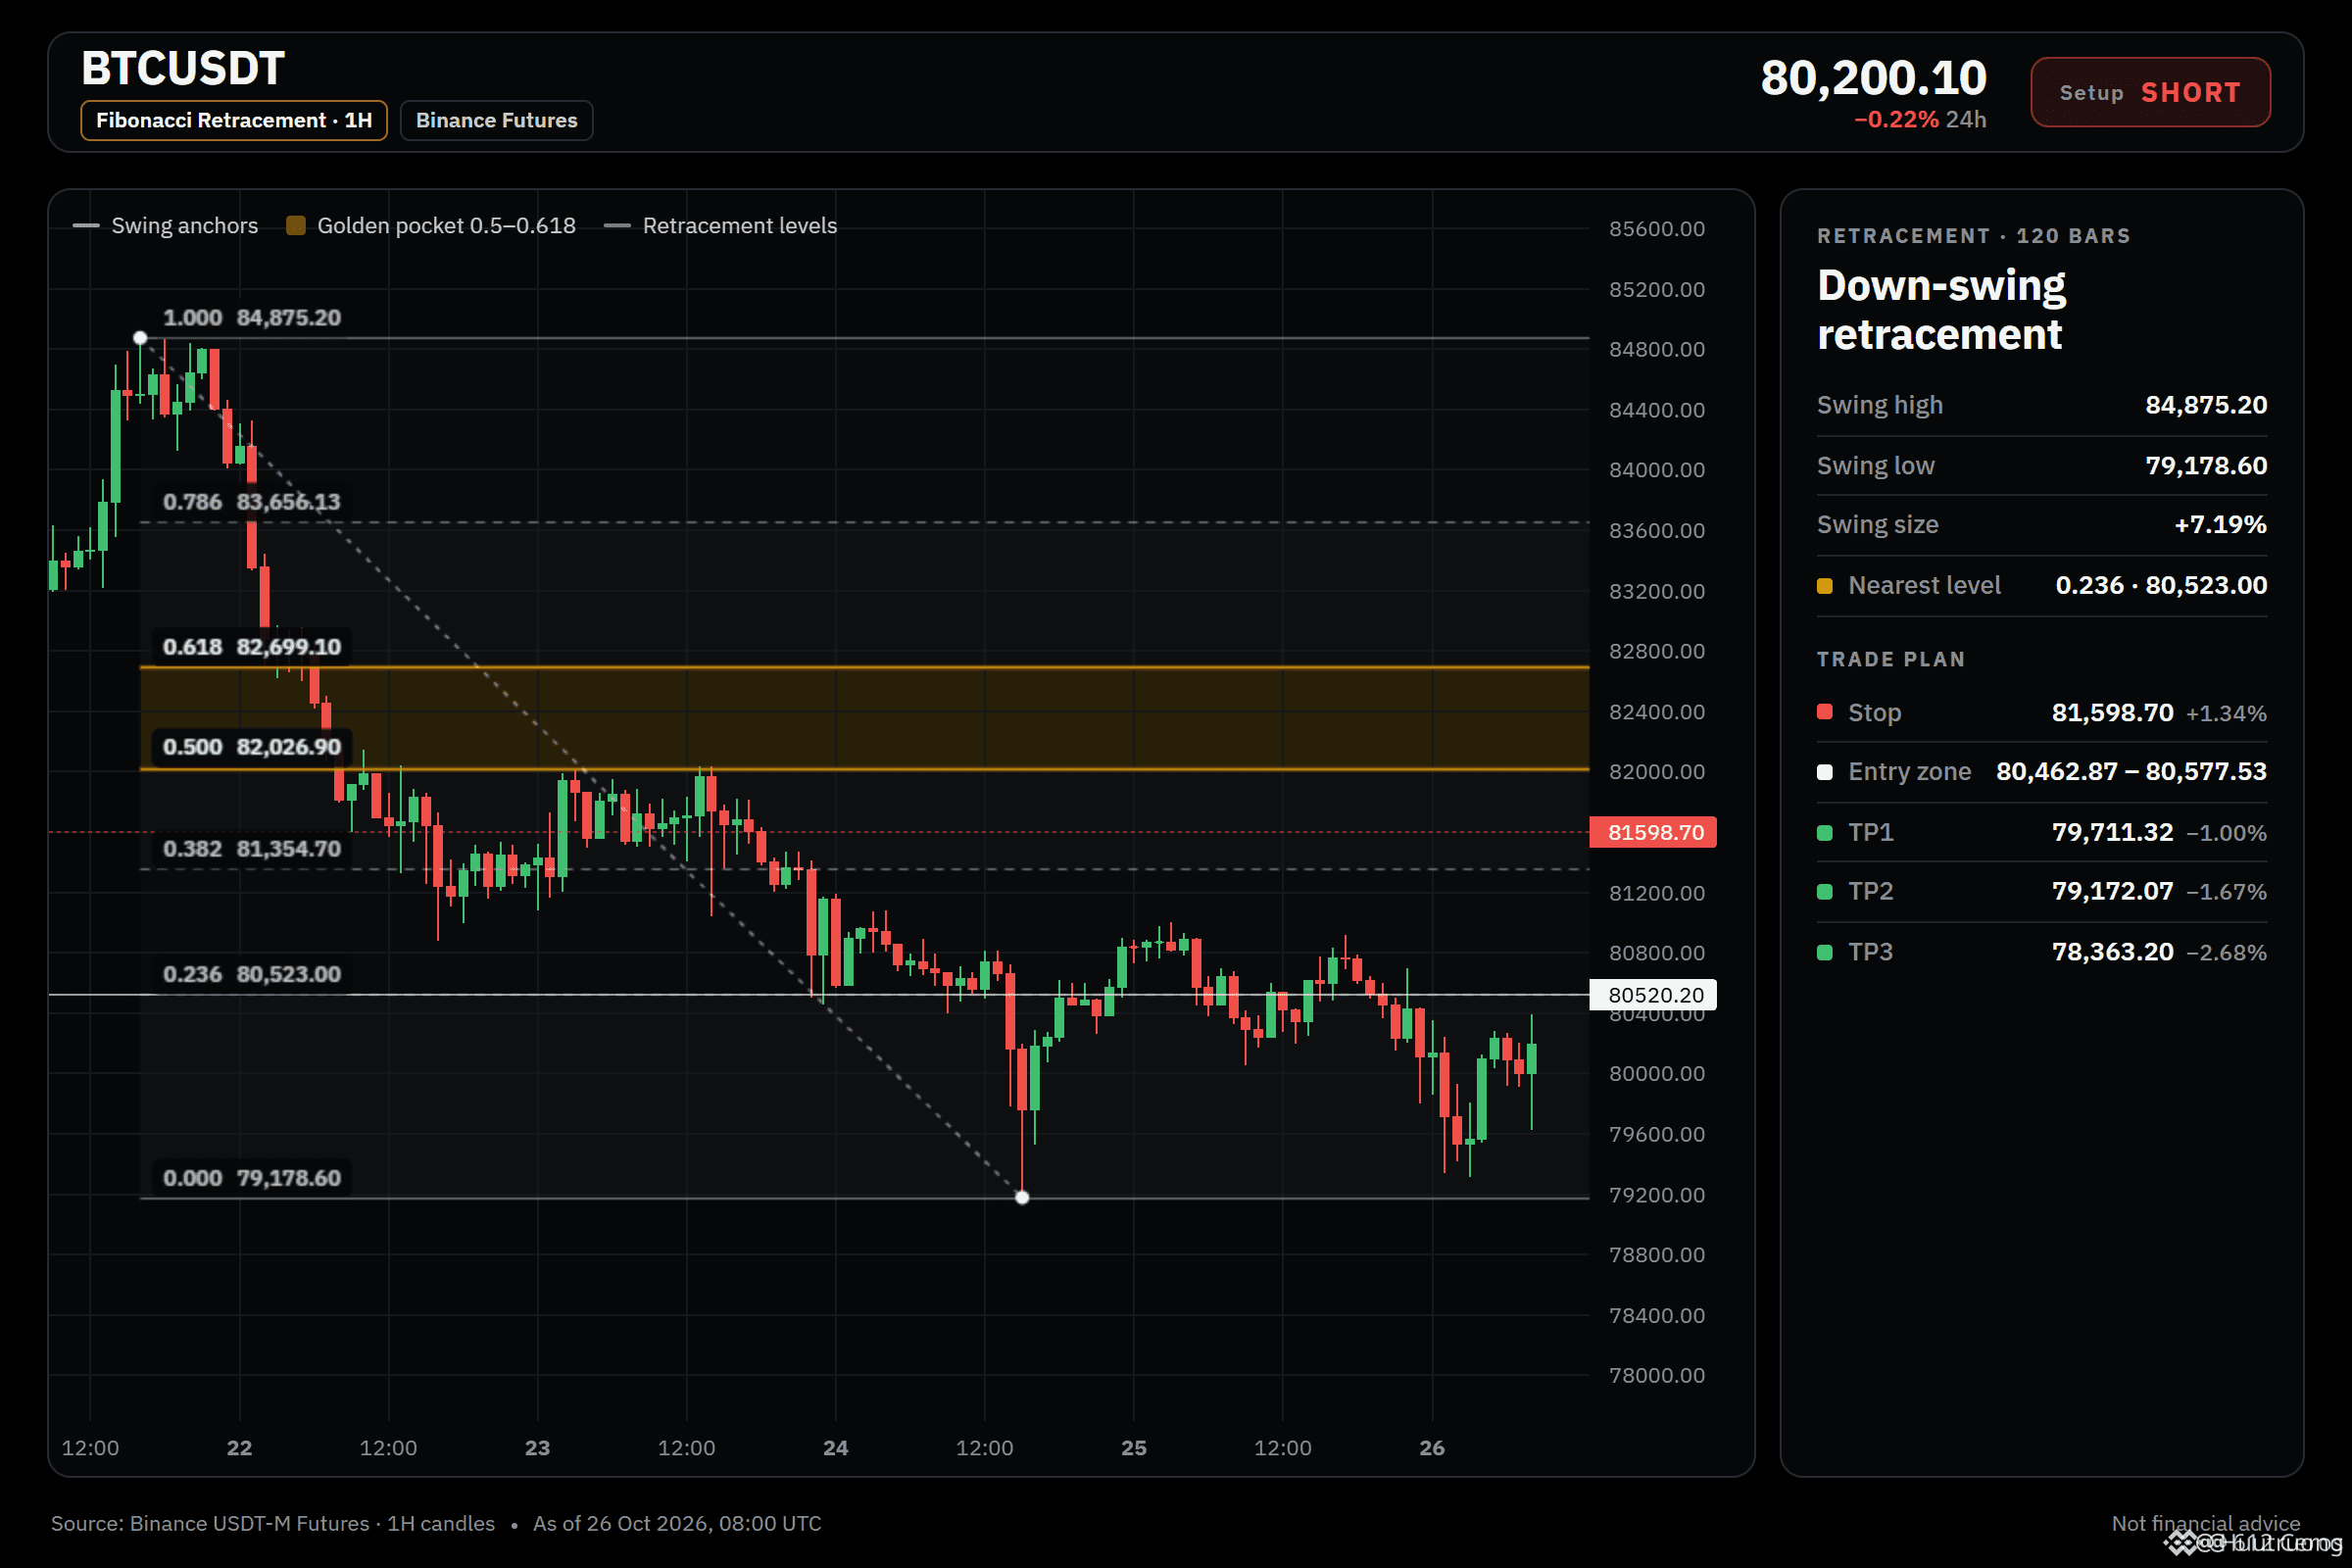
price below EMA50 and EMA200 on the 4h
🔴 SHORT $BTC /USDT: expecting price to go DOWN
Bias: SHORT · Leaning
Entry: 80462.87 – 80577.53
TP1: 79711.32 (-1.0%)
TP2: 79172.07 (-1.7%)
TP3: 78363.20 (-2.7%)
SL: 81598.70 (+1.3%)
Plan: enter only inside the zone, close 50% at TP1, 25% at TP2, 25% at TP3, and move the stop to entry after TP1.
Note: moderate conviction only, keep size light.
Why SHORT? 2/12 signals agree, 2 against.
• 4h trend down (below EMA50 & EMA200)
• Sellers have the momentum (4h RSI 38.4)
Risk: BTC is rising, this coin follows (corr 1.00)
Q: Why short when the daily trend is range?
A: The 4h bearish stack keeps the swing trend down.
Q: What if buyers are pressing right now?
A: The 15m RSI z-score of +1.36 shows buyers pushing.
What level would make you take the other side?
11
·
--
Übersetzung ansehen
📊 $AMZN Earnings Prediction | Bullish or Bearish? 🚀
I’m bullish on Amazon! Strong AWS growth, AI innovation, and expanding e-commerce could support its earnings. Will $AMZN beat market expectations? Let’s watch the results! 📈🔥
What’s your prediction?
#EarningsSeasonOnSquare #BinancePick $AMZN
{future}(AMZNUSDT)
📊 $AMZN Earnings Prediction | Bullish or Bearish? 🚀
I’m bullish on Amazon! Strong AWS growth, AI innovation, and expanding e-commerce could support its earnings. Will $AMZN beat market expectations? Let’s watch the results! 📈🔥
What’s your prediction?
#EarningsSeasonOnSquare #BinancePick $AMZN
I’m bullish on Amazon! Strong AWS growth, AI innovation, and expanding e-commerce could support its earnings. Will $AMZN beat market expectations? Let’s watch the results! 📈🔥
What’s your prediction?
#EarningsSeasonOnSquare #BinancePick $AMZN
6
·
--
Bärisch
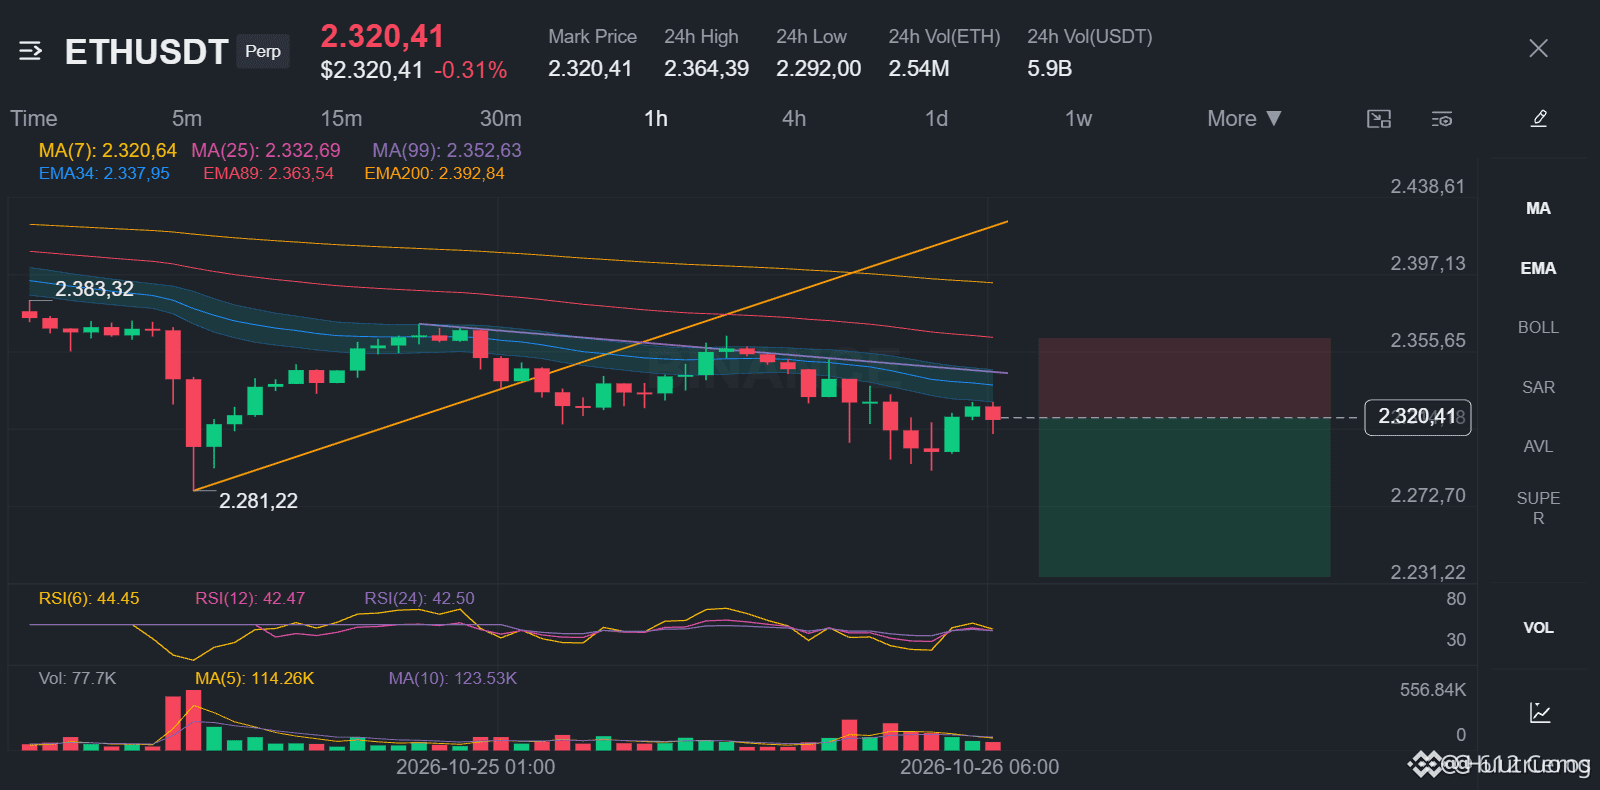
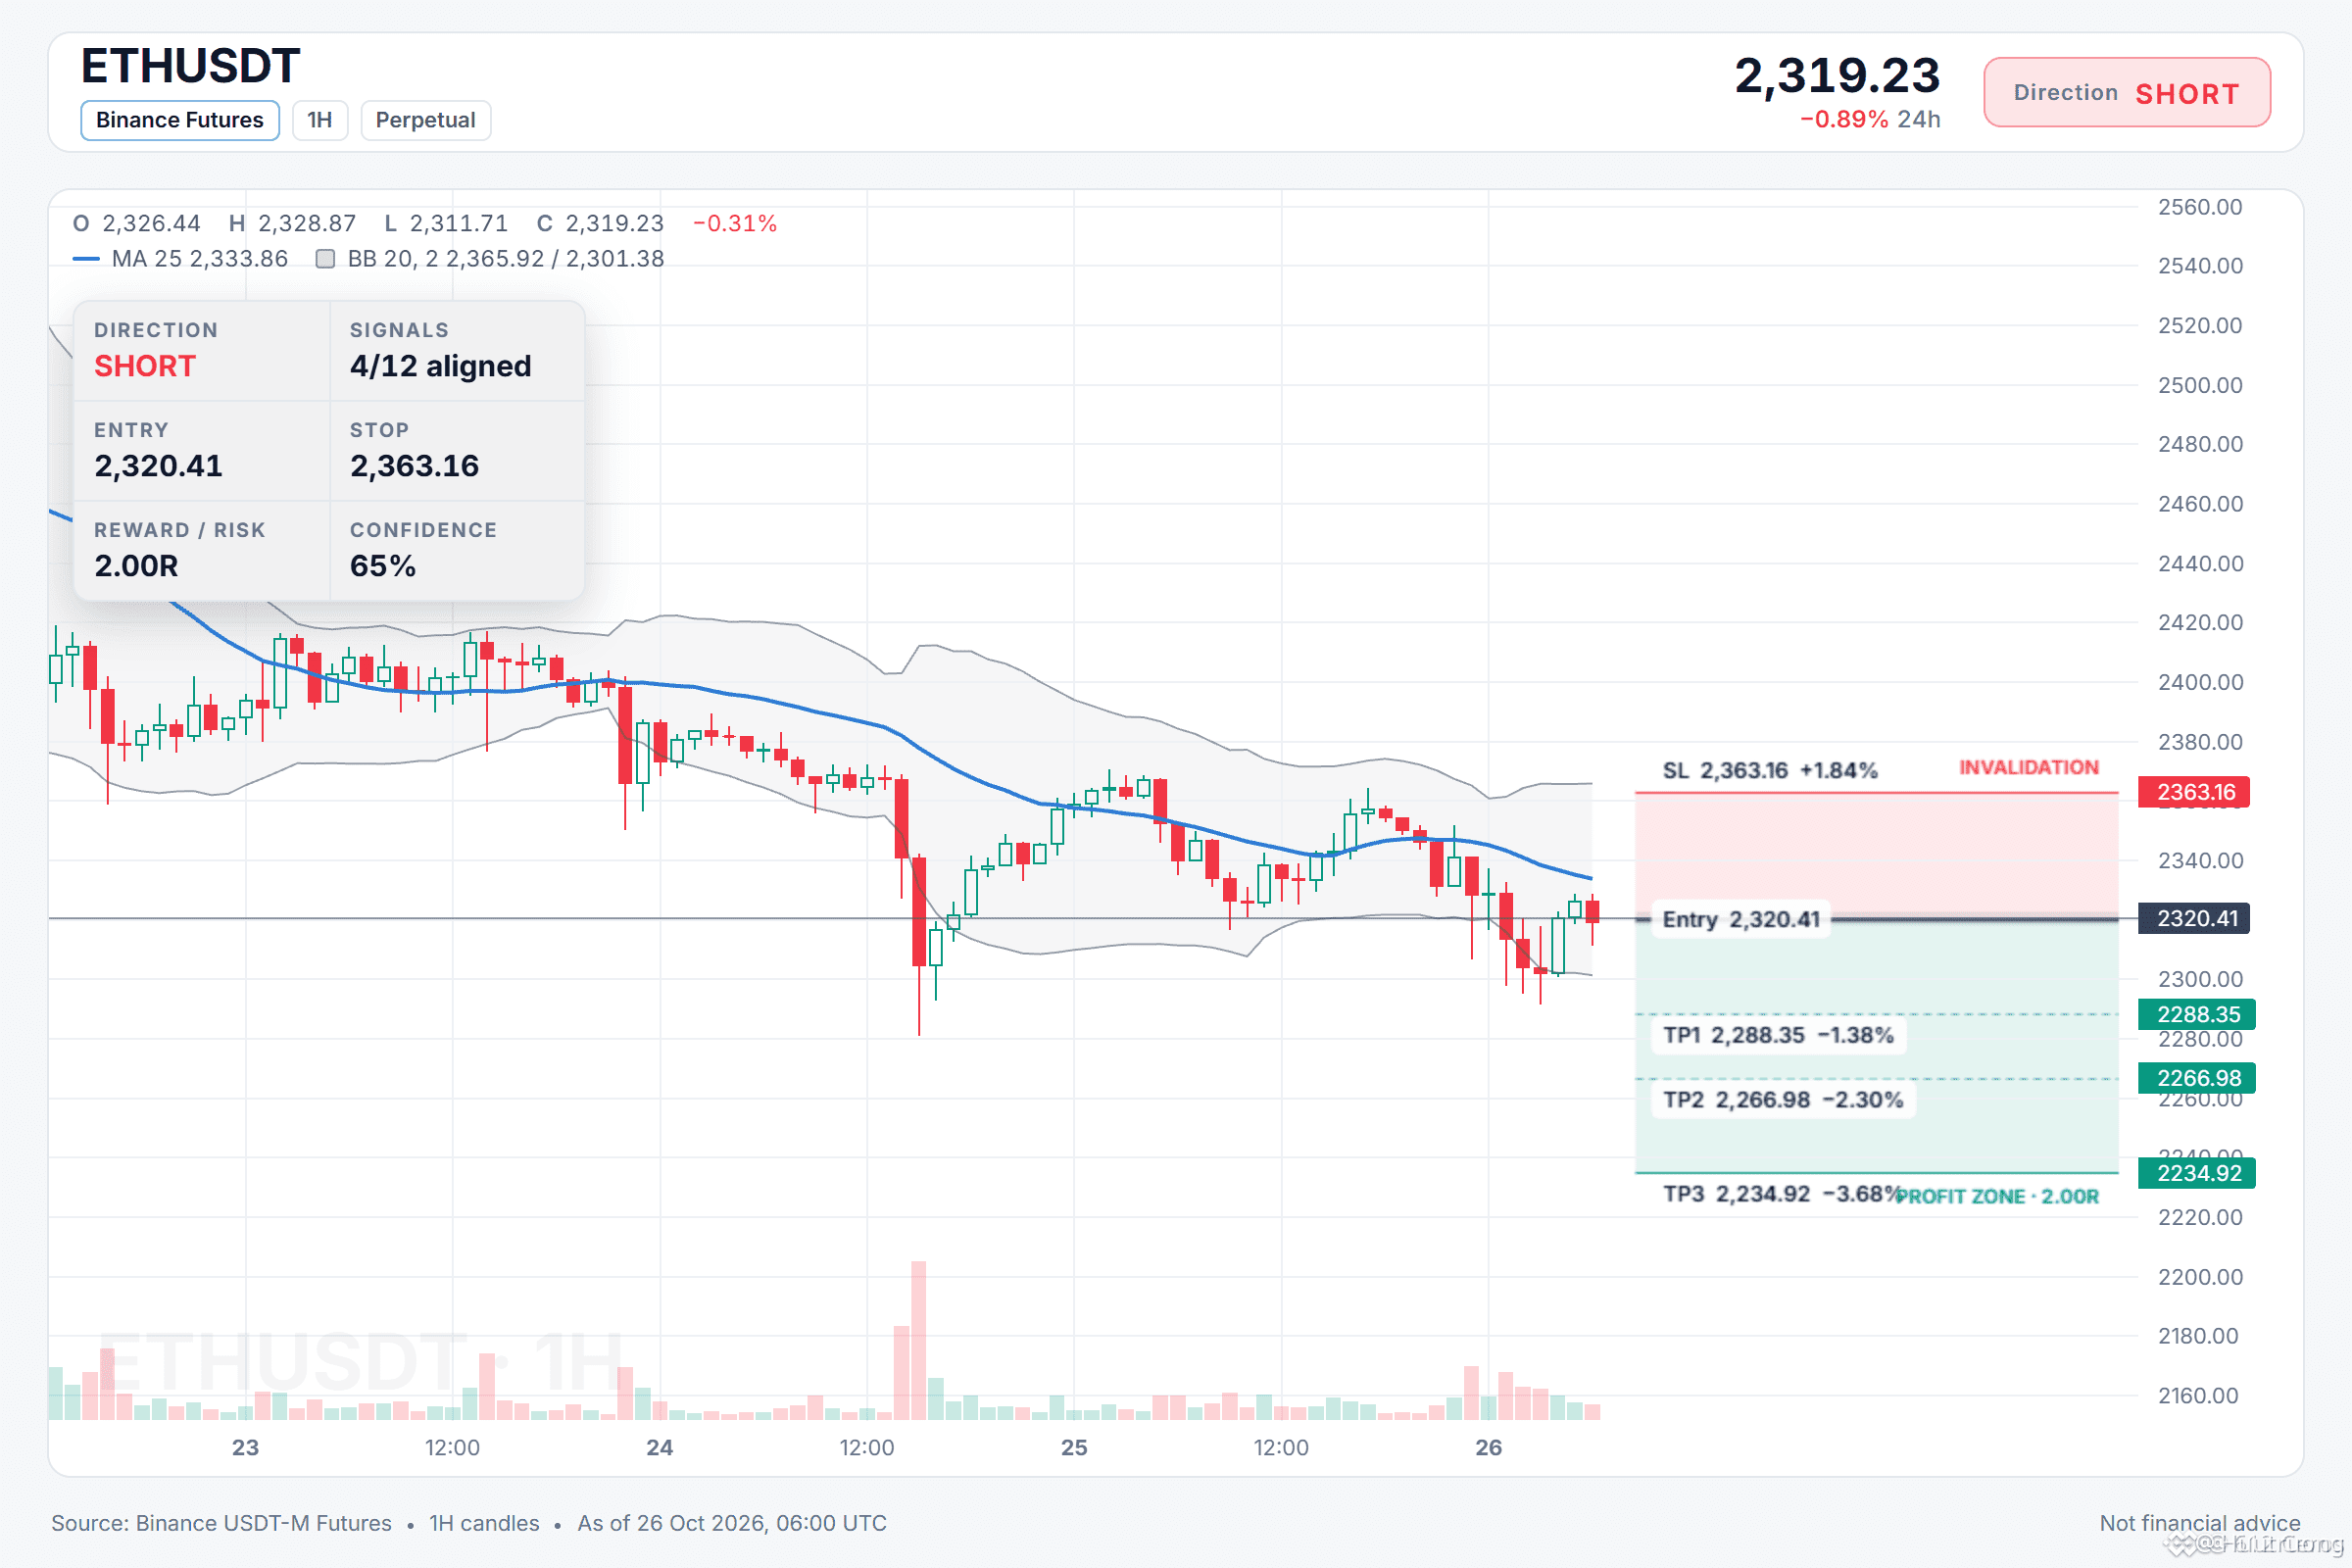
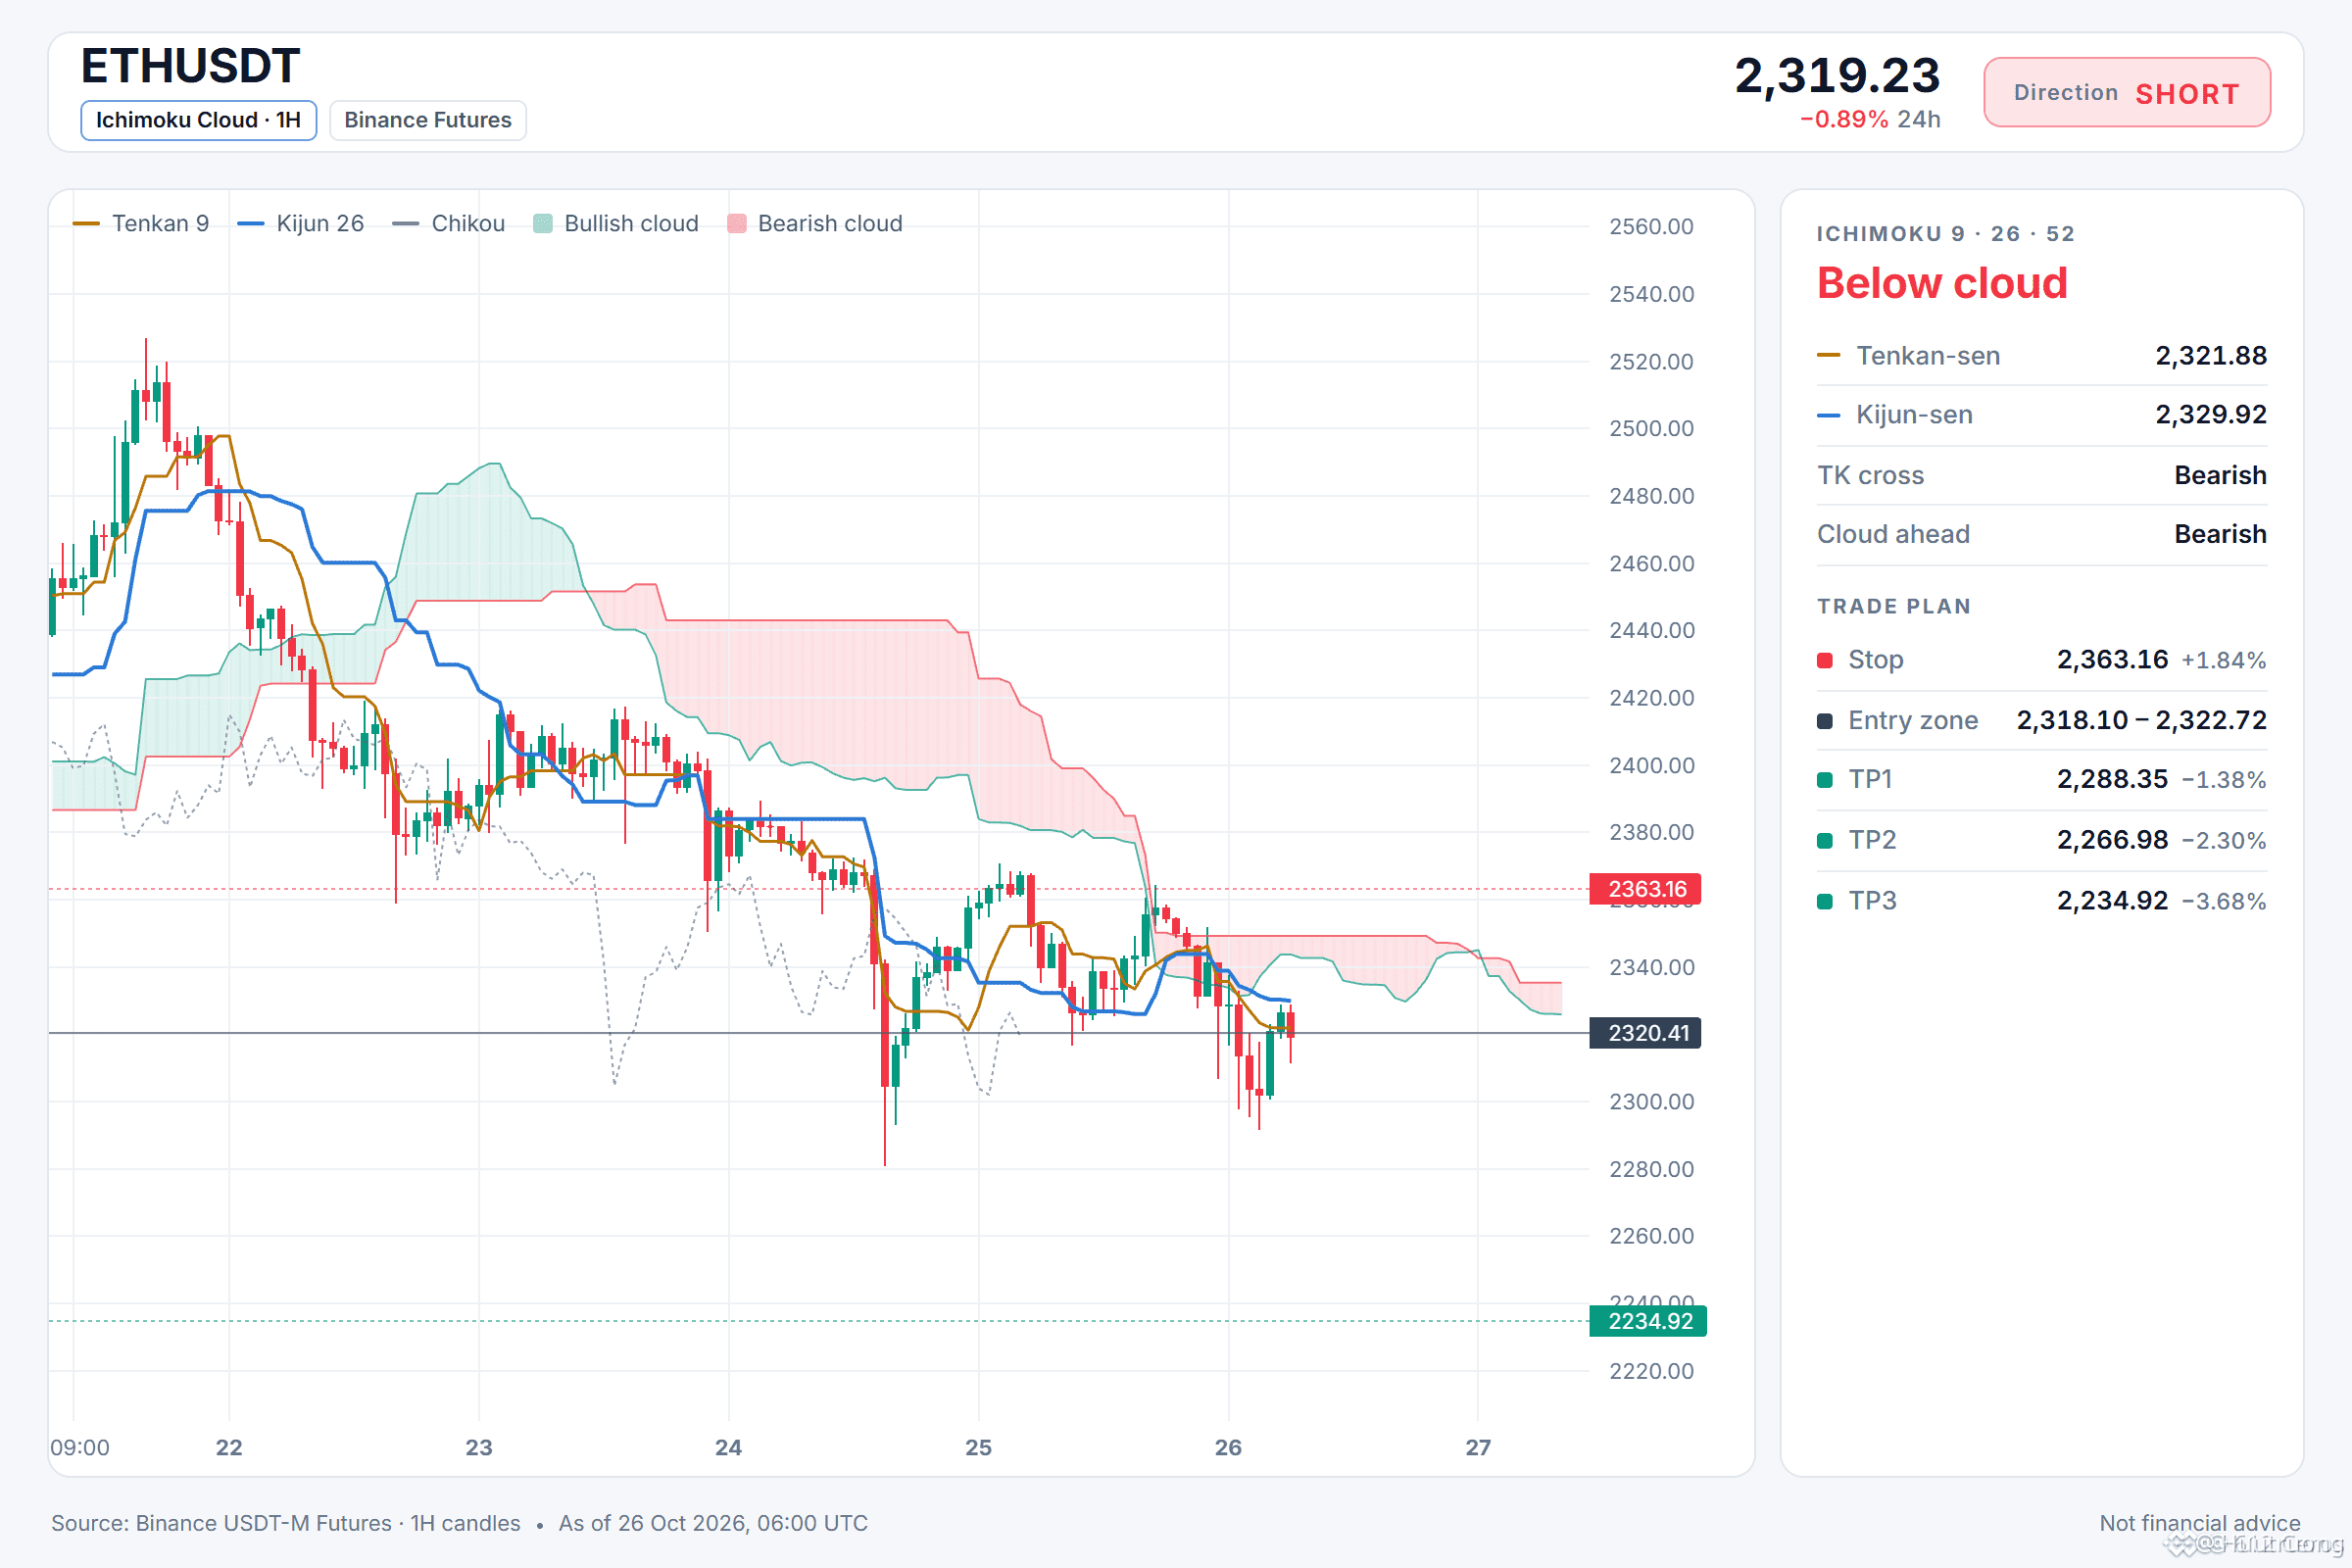
ETH rutscht in einer klaren bärischen Staffelung ab.
🔴 SHORT $ETH /USDT: Erwartung: Kurs geht nach UNTEN
Tendenz: SHORT · leicht
Einstieg: 2318.10 – 2322.72
TP1: 2288.35 (-1.4%)
TP2: 2266.98 (-2.3%)
TP3: 2234.92 (-3.7%)
SL: 2363.16 (+1.8%)
Plan: Nur innerhalb der Zone einsteigen, bei TP1 50 % schließen, bei TP2 25 %, bei TP3 25 % und den Stop nach TP1 auf den Einstiegskurs nachziehen.
Hinweis: Die Überzeugung ist nur mäßig – Position klein halten.
Warum SHORT? 4/12 Signale stimmen überein, 0 sprechen dagegen.
• 4h-Trend abwärts (unter EMA50 und EMA200)
• 1h-Trend abwärts (unter EMA50 und EMA200)
• Verkäufer haben das Momentum (4h-RSI 33.4)
Plan A:
Wenn der 4h-Trend den Kurs weiterhin unter beiden EMAs hält, könnte die bärische Staffelung im 1h-Chart ihn in Richtung der TP1-Zone drücken.
Plan B (Ungültigkeit):
Wenn der Kurs das Einstiegsniveau zurückerobert und darüber bleibt, würde ich den Short schließen und abwarten.
Wo setzt du dein ETH-Niveau?
21
·
--
Bärisch
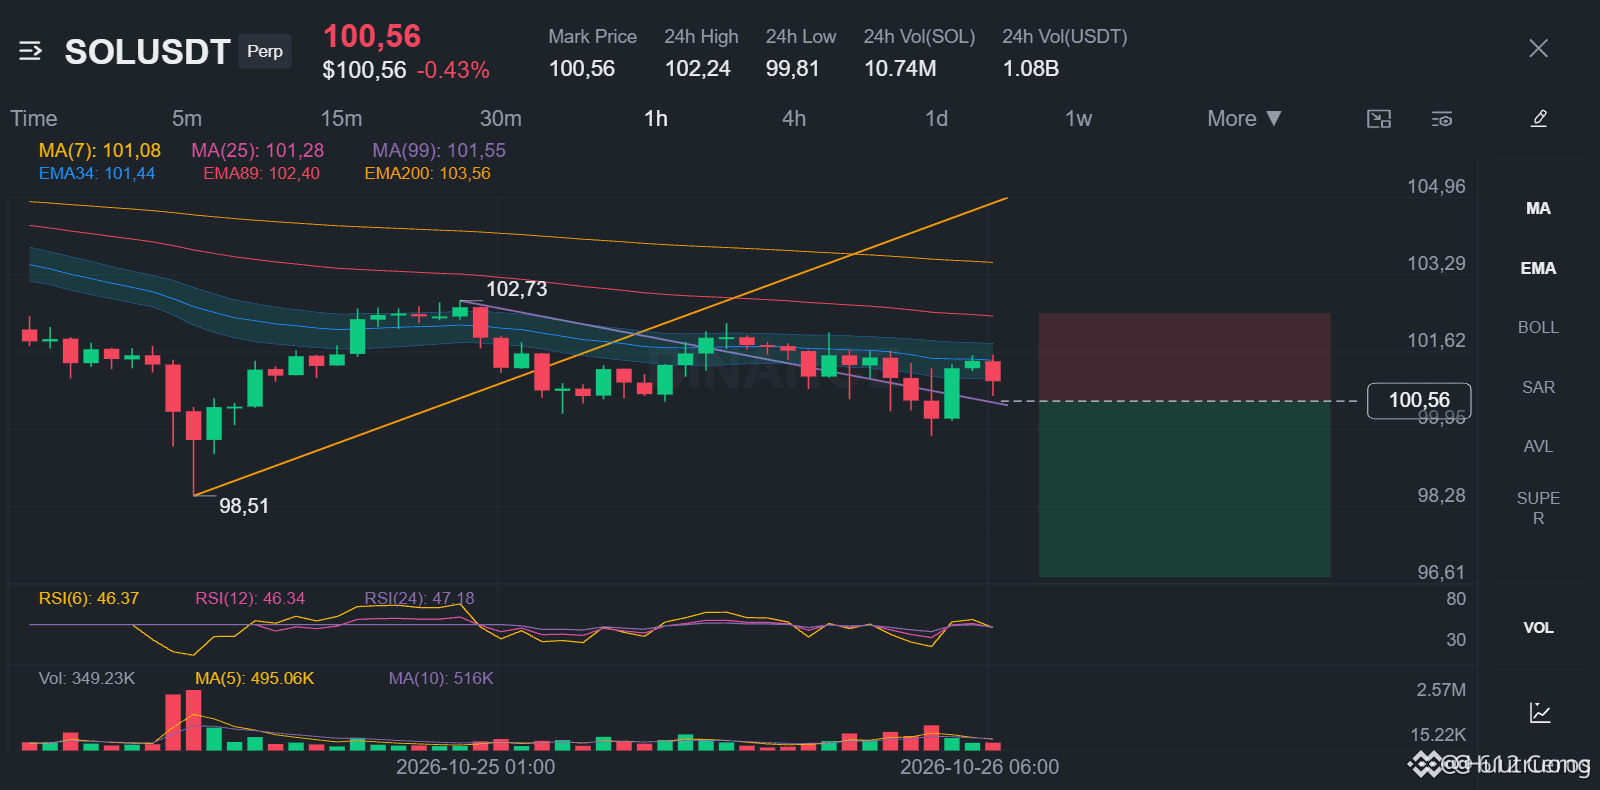
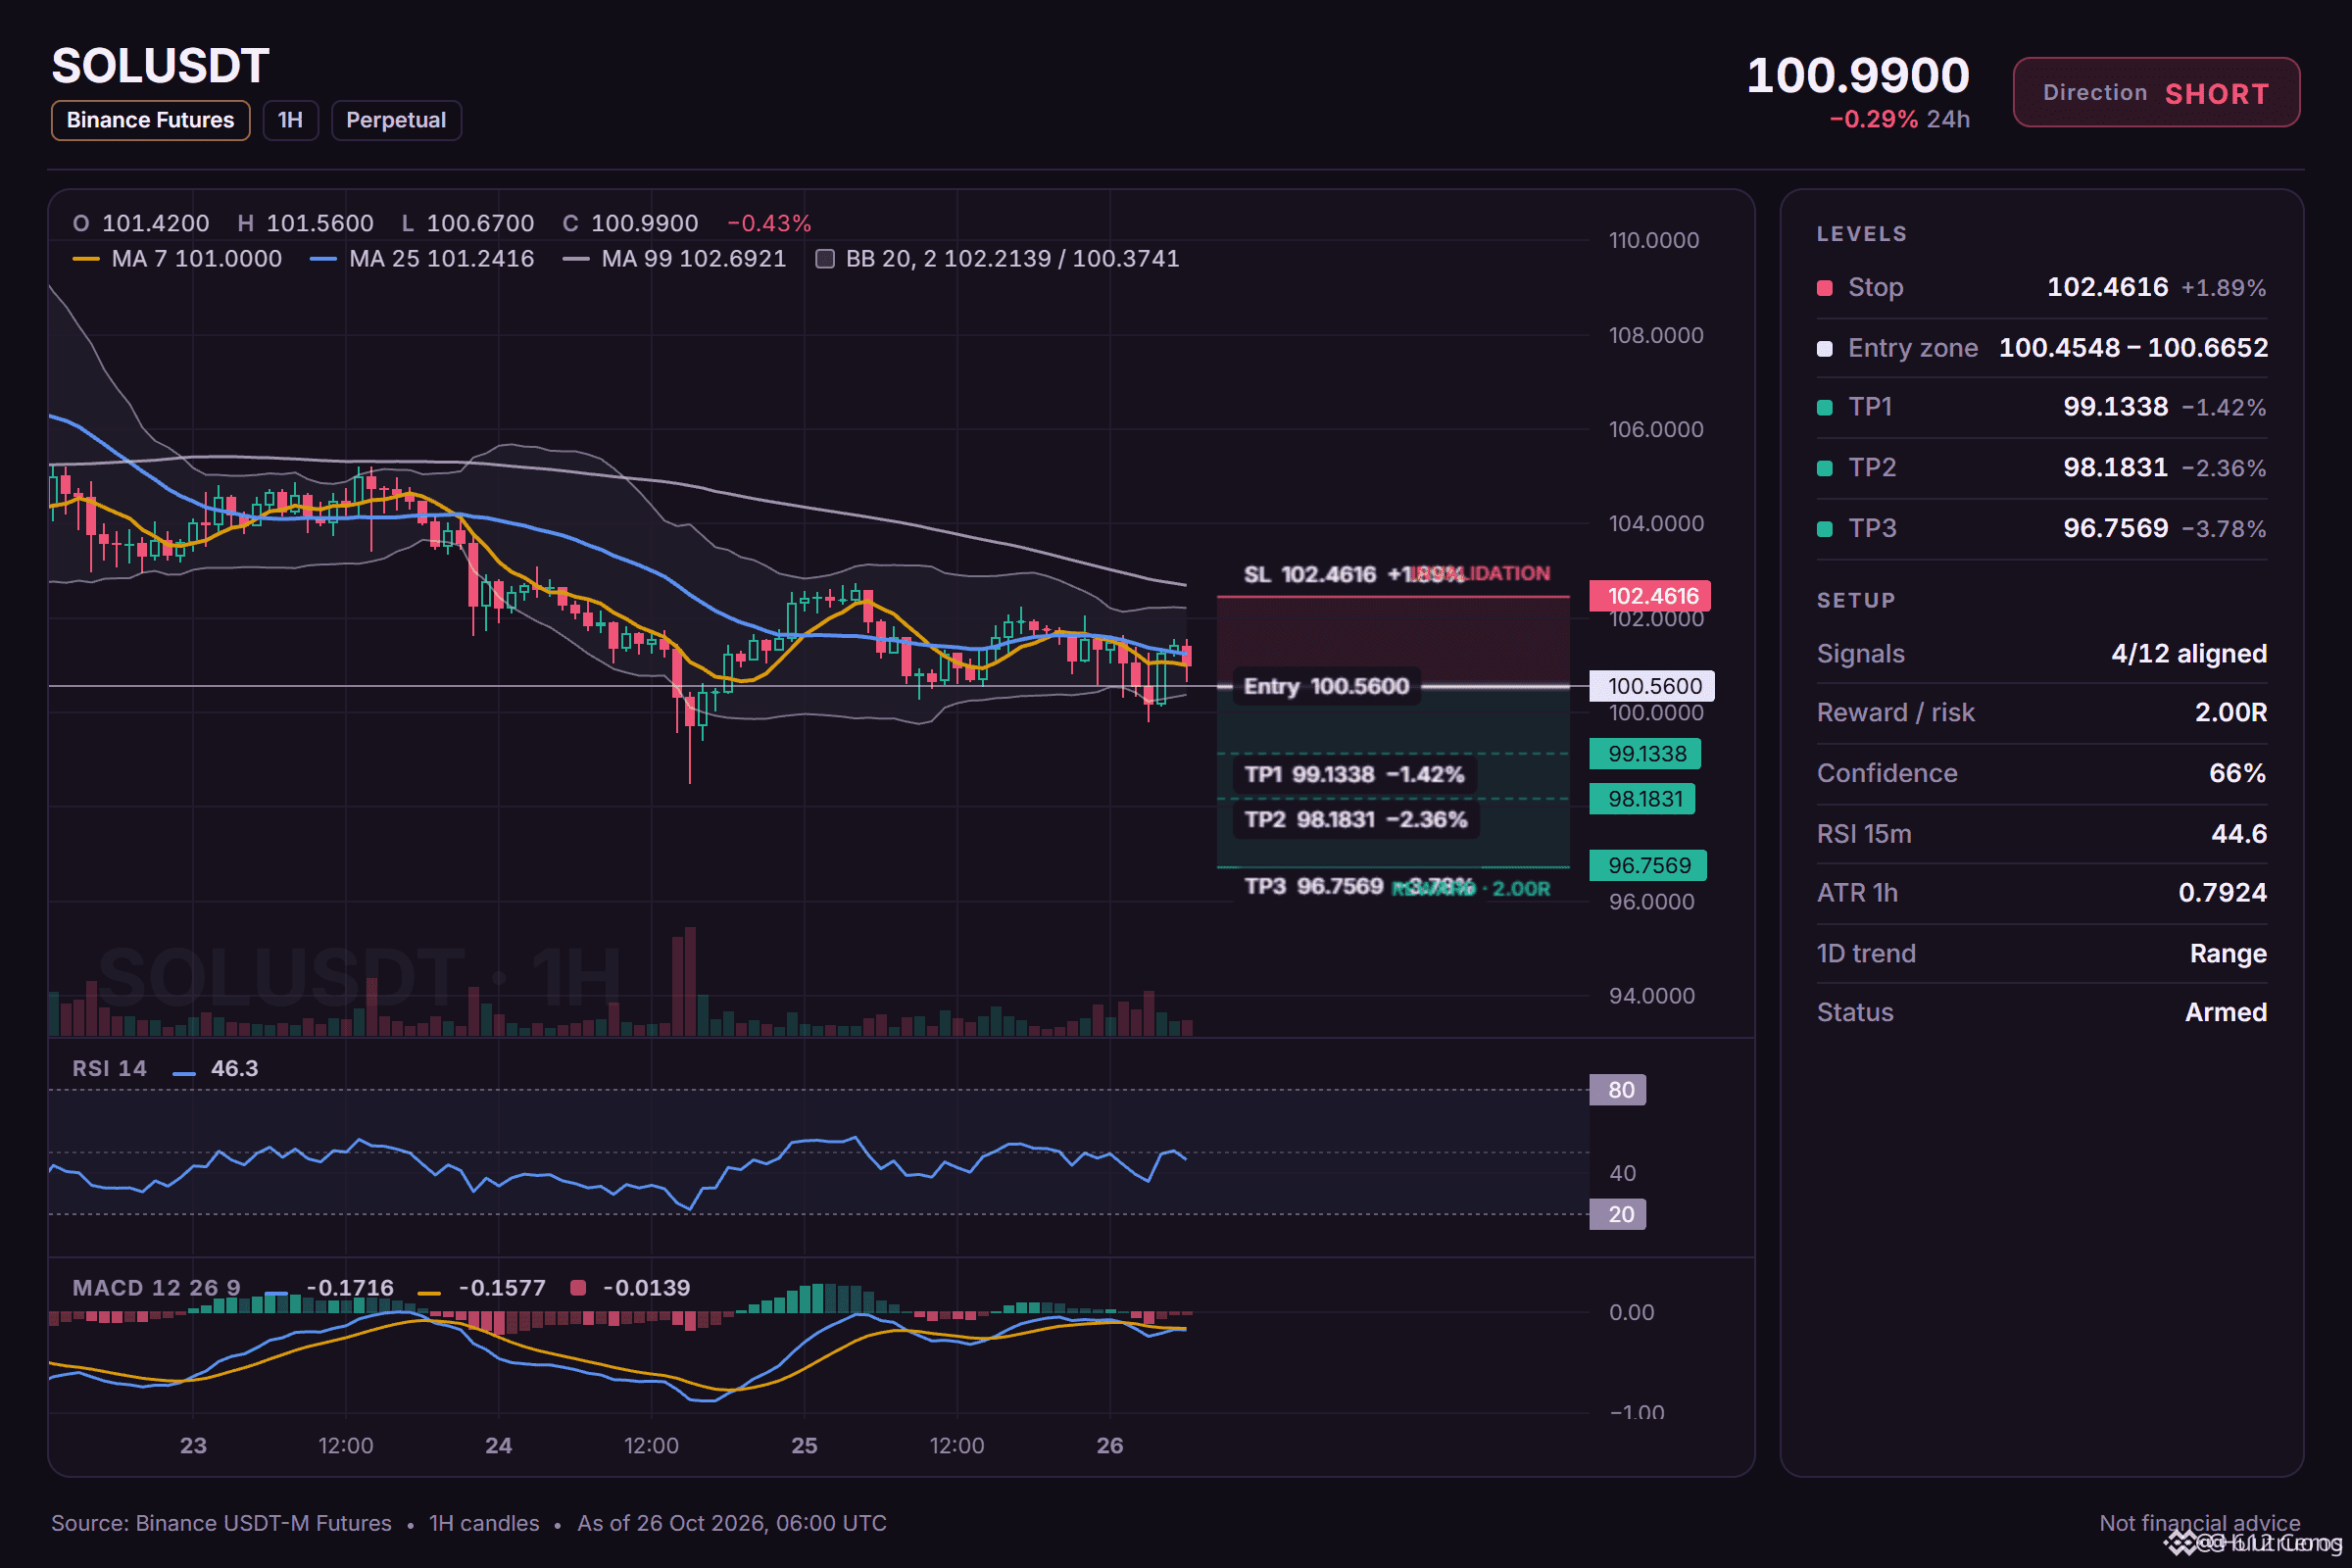
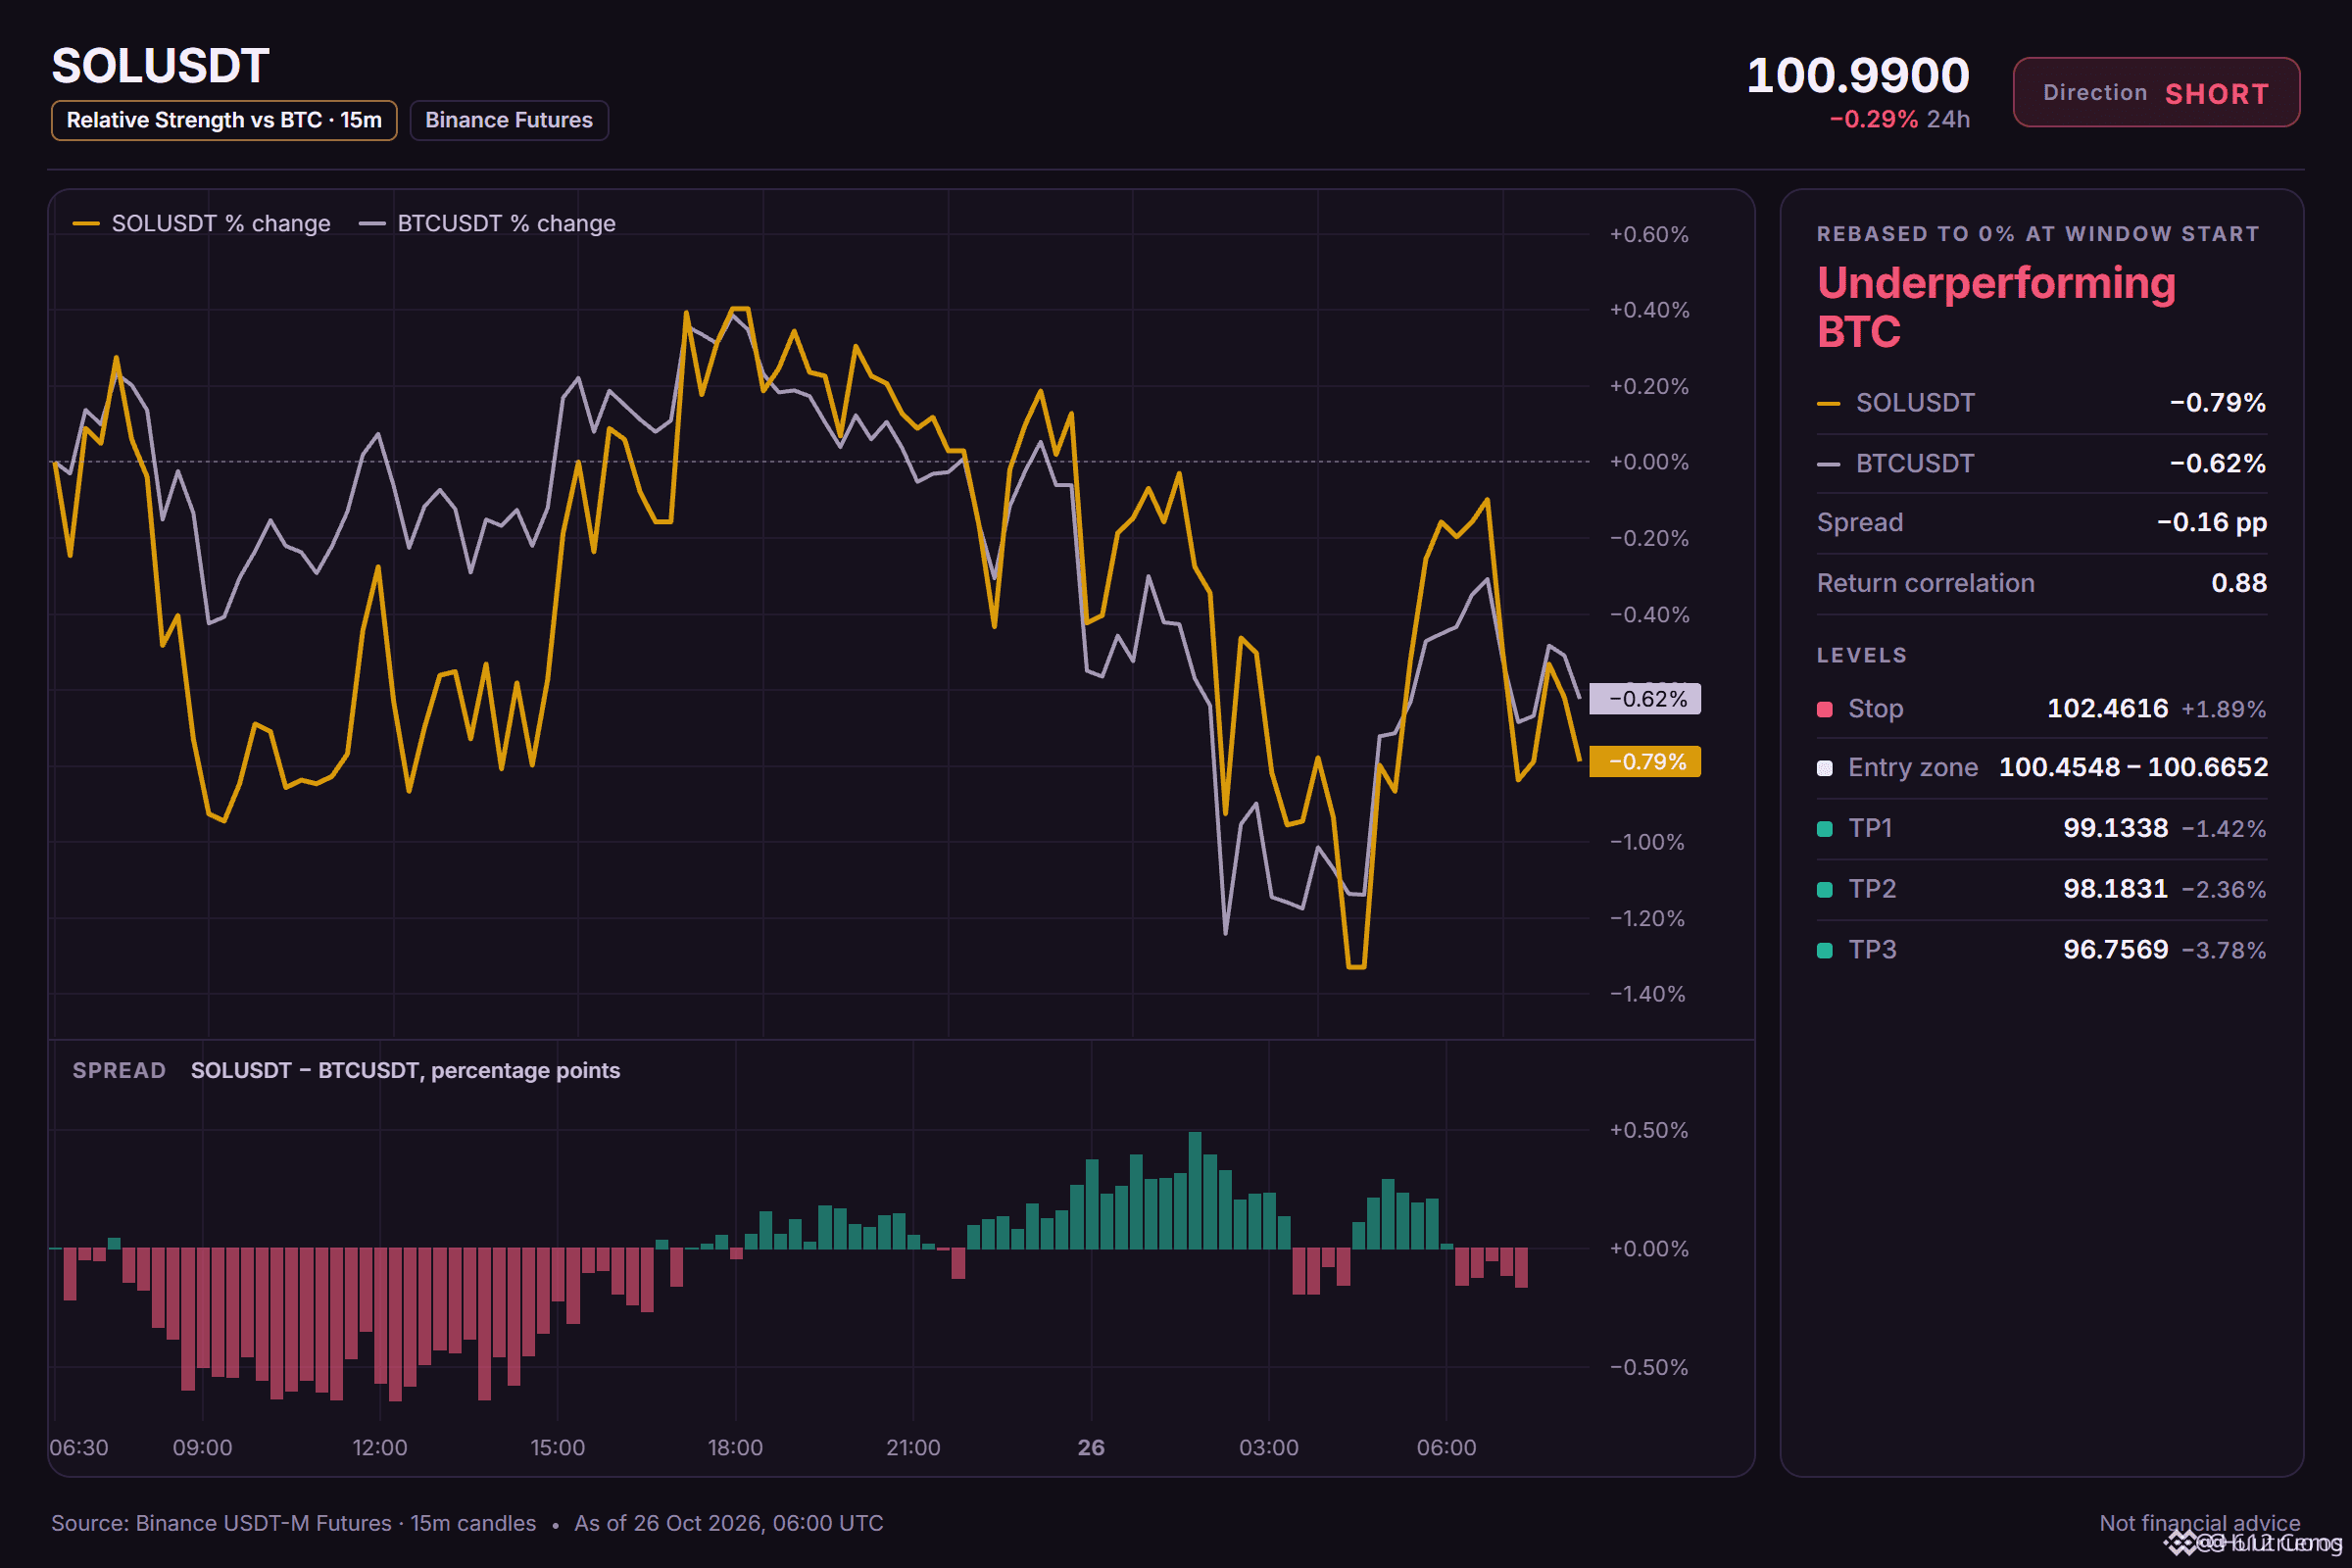
SOL befindet sich in einem klaren 4h-Abwärtstrend
🔴 SHORT $SOL /USDT: Es wird erwartet, dass der Preis fällt
Tendenz: SHORT · eher SHORT
Einstieg: 100.4548 – 100.6652
TP1: 99.1338 (-1.4%)
TP2: 98.1831 (-2.4%)
TP3: 96.7569 (-3.8%)
SL: 102.4616 (+1.9%)
Plan: Nur innerhalb der Zone einsteigen, bei TP1 50 % schließen, bei TP2 25 %, bei TP3 25 % und den Stop nach TP1 auf den Einstieg setzen.
Hinweis: Die Überzeugung ist nur mäßig; die Positionsgröße sollte gering bleiben.
Warum SHORT? 4/12 Signale stimmen überein, 0 sprechen dagegen.
• 4h-Trend abwärts (unter EMA50 und EMA200)
• 1h-Trend abwärts (unter EMA50 und EMA200)
• fällt, und diese Coin folgt dem Trend (Korrelation 0.89)
Warum jetzt?
wird unterhalb der EMA-Bereiche sowohl im 1h- als auch im 4h-Zeitrahmen gehandelt und bestätigt damit, dass der kurzfristige Trend abwärts gerichtet ist. Der 1h-Preis liegt bei 100.5600, und der RSI von 44.62 zeigt, dass die Verkäufer die Dynamik bestimmen. Dies ist ein SHORT mit einer gewissen Tendenz, aber kein starkes Signal.
Wo liegt dein Invalidierungsniveau für diesen Trade?
10
·
--
Bullisch
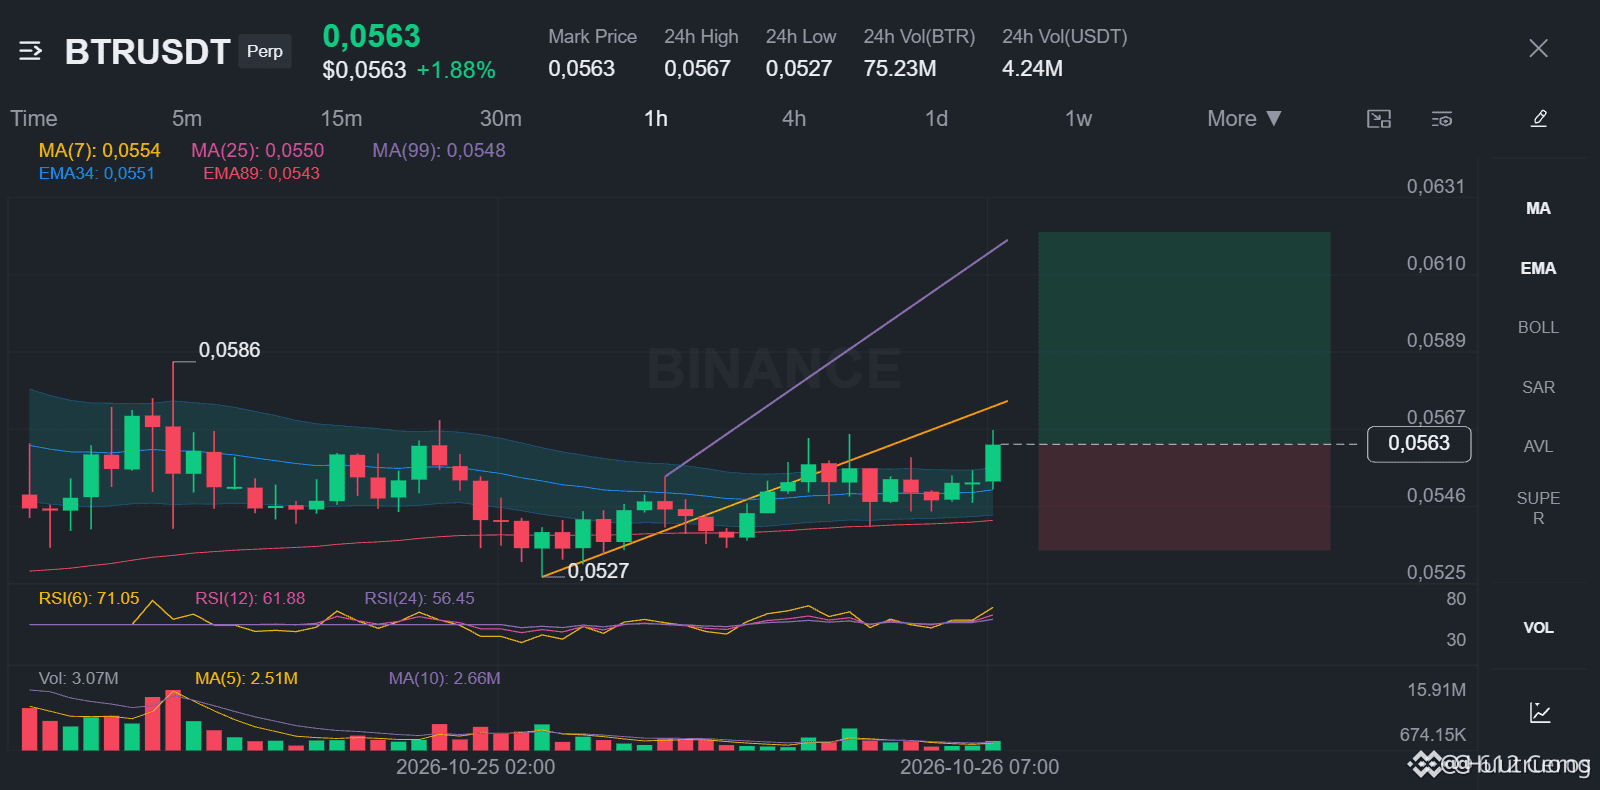
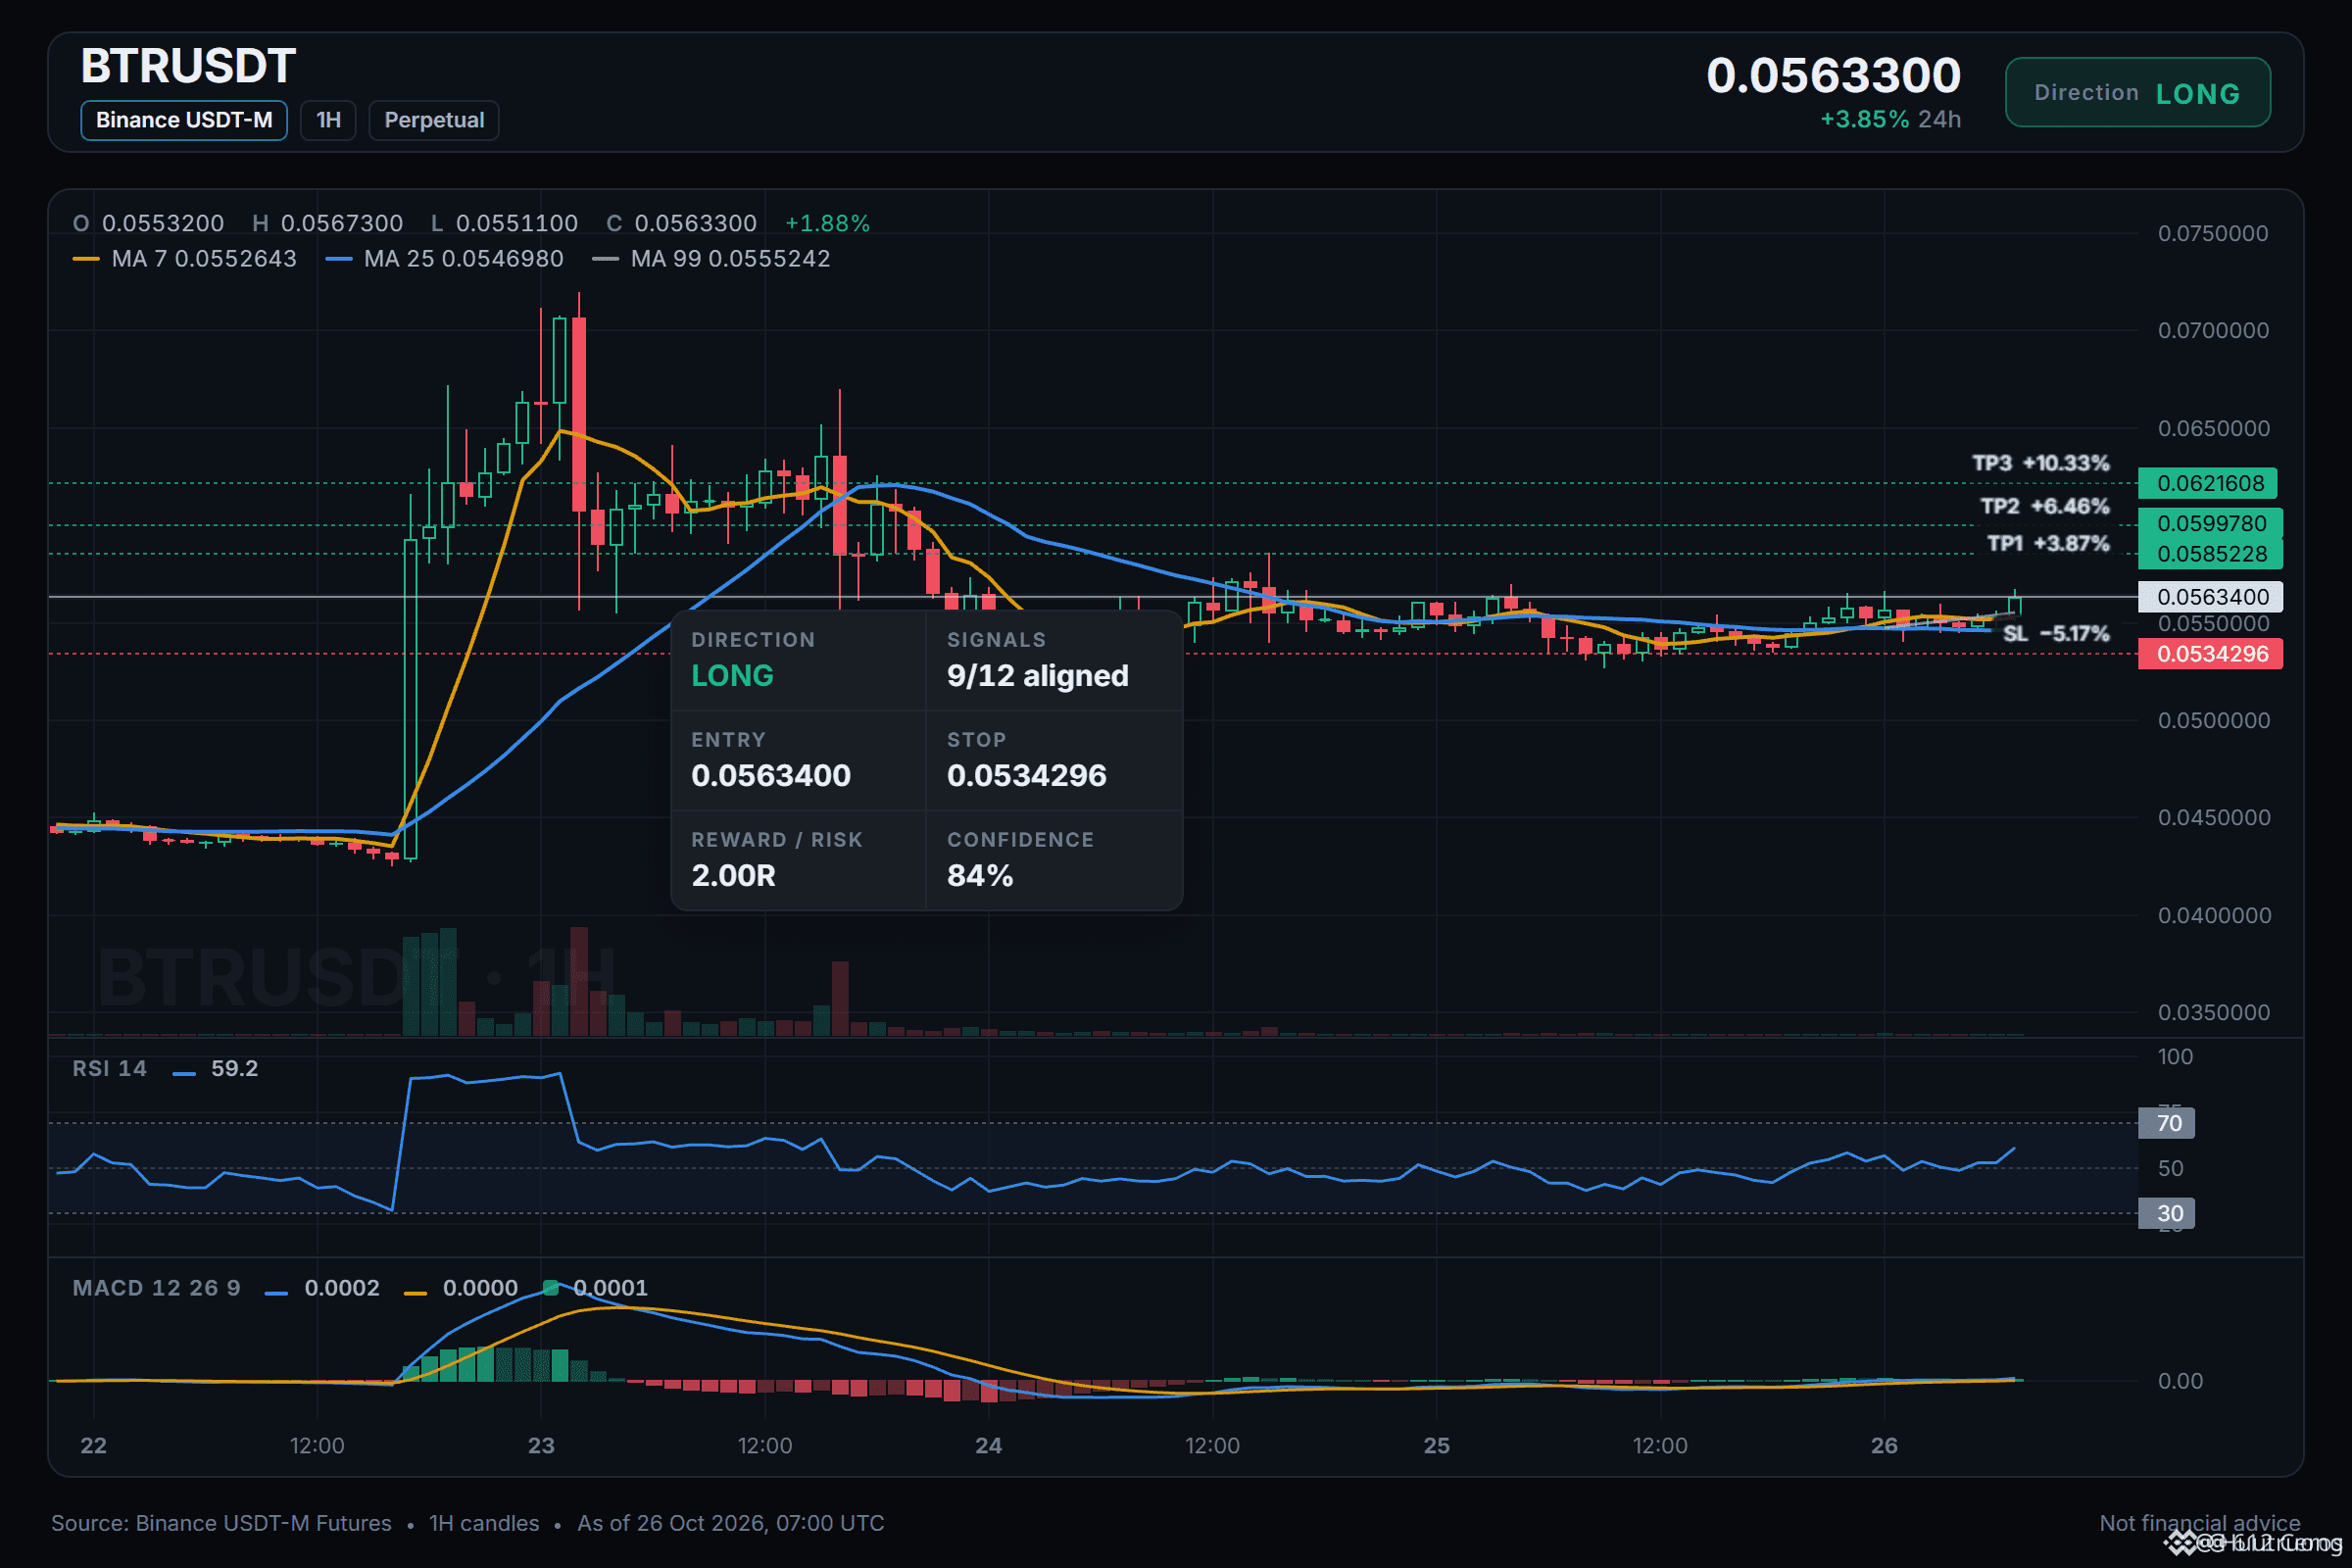
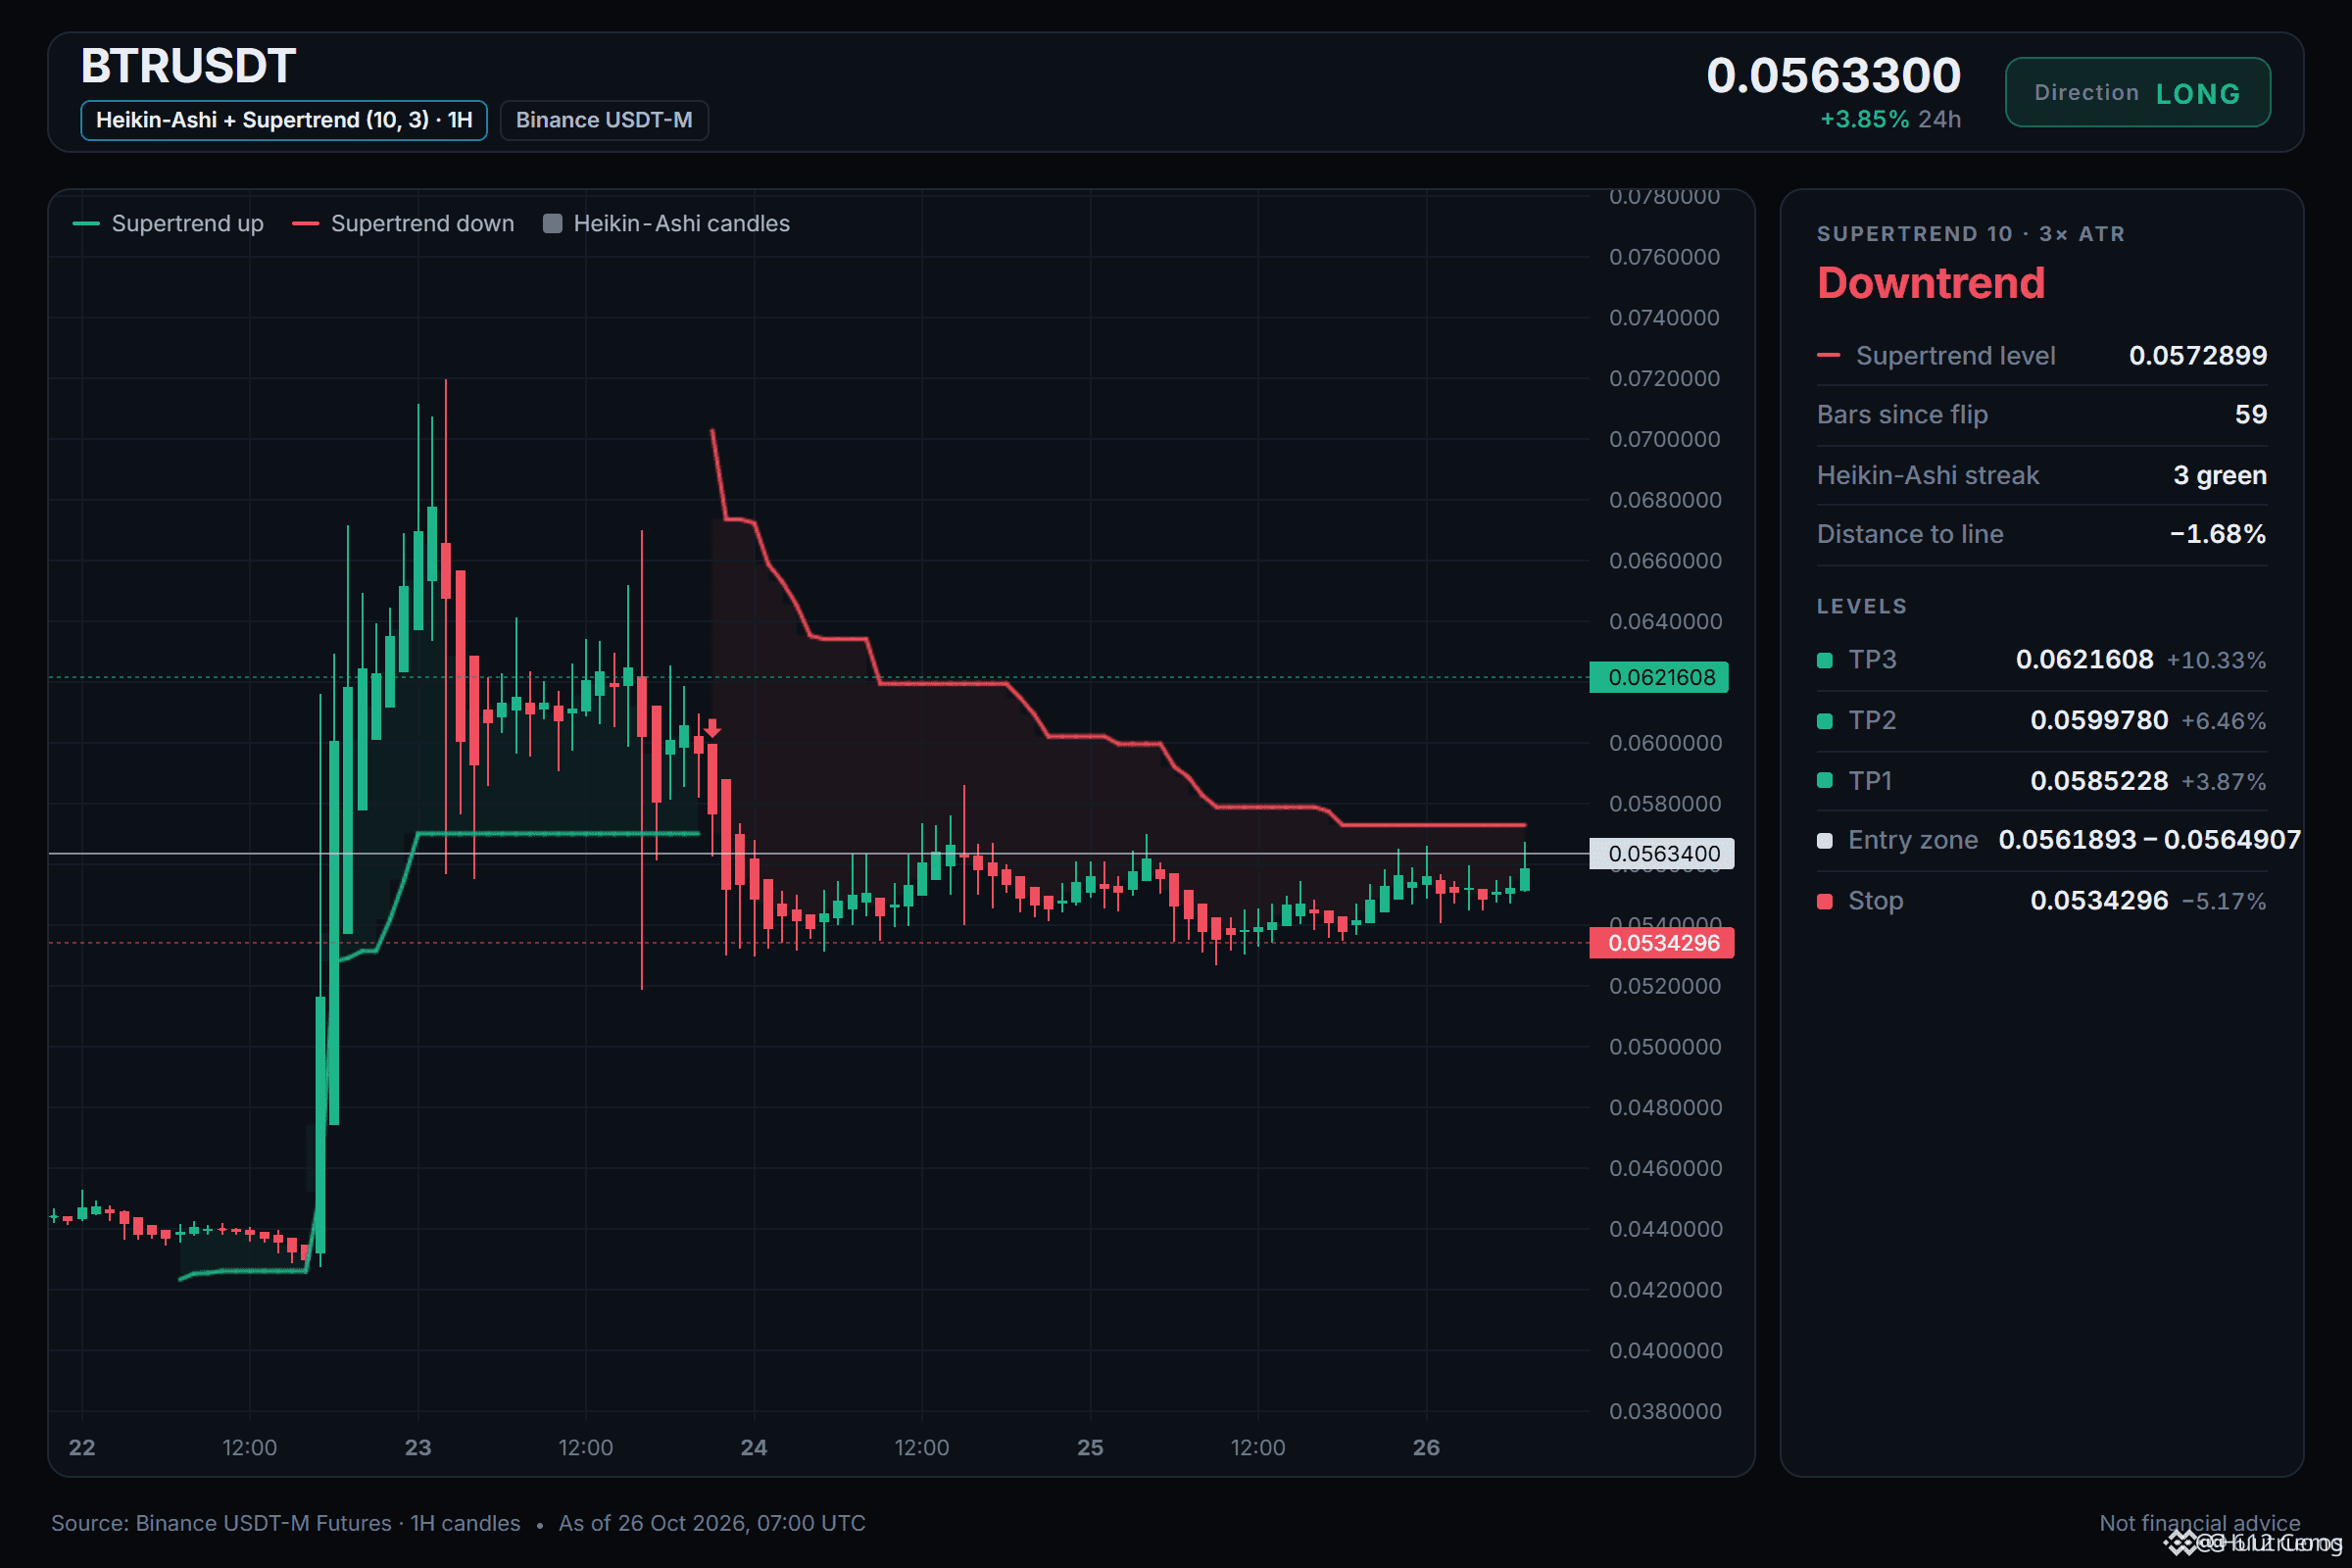
Steigt BTR tatsächlich oder ist das nur Rauschen?
🟢 LONG $BTR /USDT: Kursanstieg erwartet
Bias: LONG · Stark
Einstieg: 0.0561893 – 0.0564907
TP1: 0.0585228 (+3.9%)
TP2: 0.0599780 (+6.5%)
TP3: 0.0621608 (+10.3%)
SL: 0.0534296 (-5.2%)
Plan: Nur innerhalb der Zone einsteigen, bei TP1 50 % schließen, bei TP2 25 %, bei TP3 25 % und den Stop nach TP1 auf den Einstiegskurs setzen.
Warum LONG? 9/12 Signale stimmen überein, 0 sprechen dagegen.
• Tagestrend aufwärts (über EMA50 und EMA200)
• 4-Stunden-Trend aufwärts (über EMA50 und EMA200)
• 1-Stunden-Trend aufwärts (über EMA50 und EMA200)
F: Warum long gehen, wenn der RSI bereits bei 64.4 liegt?
A: Der 1-Stunden-RSI liegt bei 64.4. Das bedeutet, dass die Käufer noch Spielraum haben, den Kurs weiter nach oben zu treiben.
F: Was, wenn sich der Tagestrend umkehrt und Long-Positionen in die Falle lockt?
A: Der Tagestrend ist bullisch, der Kurs liegt über EMA50 und EMA200.
Wo liegt dein Invalidation-Level für BTR?
23
Anmelden und weiter Inhalte entdecken
Krypto-Nutzer weltweit auf Binance Square kennenlernen
⚡️ Bleib in Sachen Krypto stets am Puls.
💬 Die weltgrößte Kryptobörse vertraut darauf.
👍 Erhalte verlässliche Einblicke von verifizierten Creators.
E-Mail-Adresse/Telefonnummer
Trendthemen
BinancePick
2.8M Aufrufe
146,374 Kommentare
Mach bei #Gewinnsaison mit: Prognostiziere Unternehmensergebnisse auf Binance Pick und teile deine Meinung auf Binance Square!
Binance Square Official
·403 Likes
·340.3k Aufrufe
EarningsSeason
5.1M Aufrufe
25,027 Kommentare
AnthropicTTMRevenueGrewAbout1200%
93 Aufrufe
32 Kommentare