$RENDER: How Transparent Methodology Turns Readers Into Better Analysts
Why does $RENDER move down while staying inside its recorded range and showing volume above baseline? This tension invites a closer look at what the chart actually tells us versus what we assume.
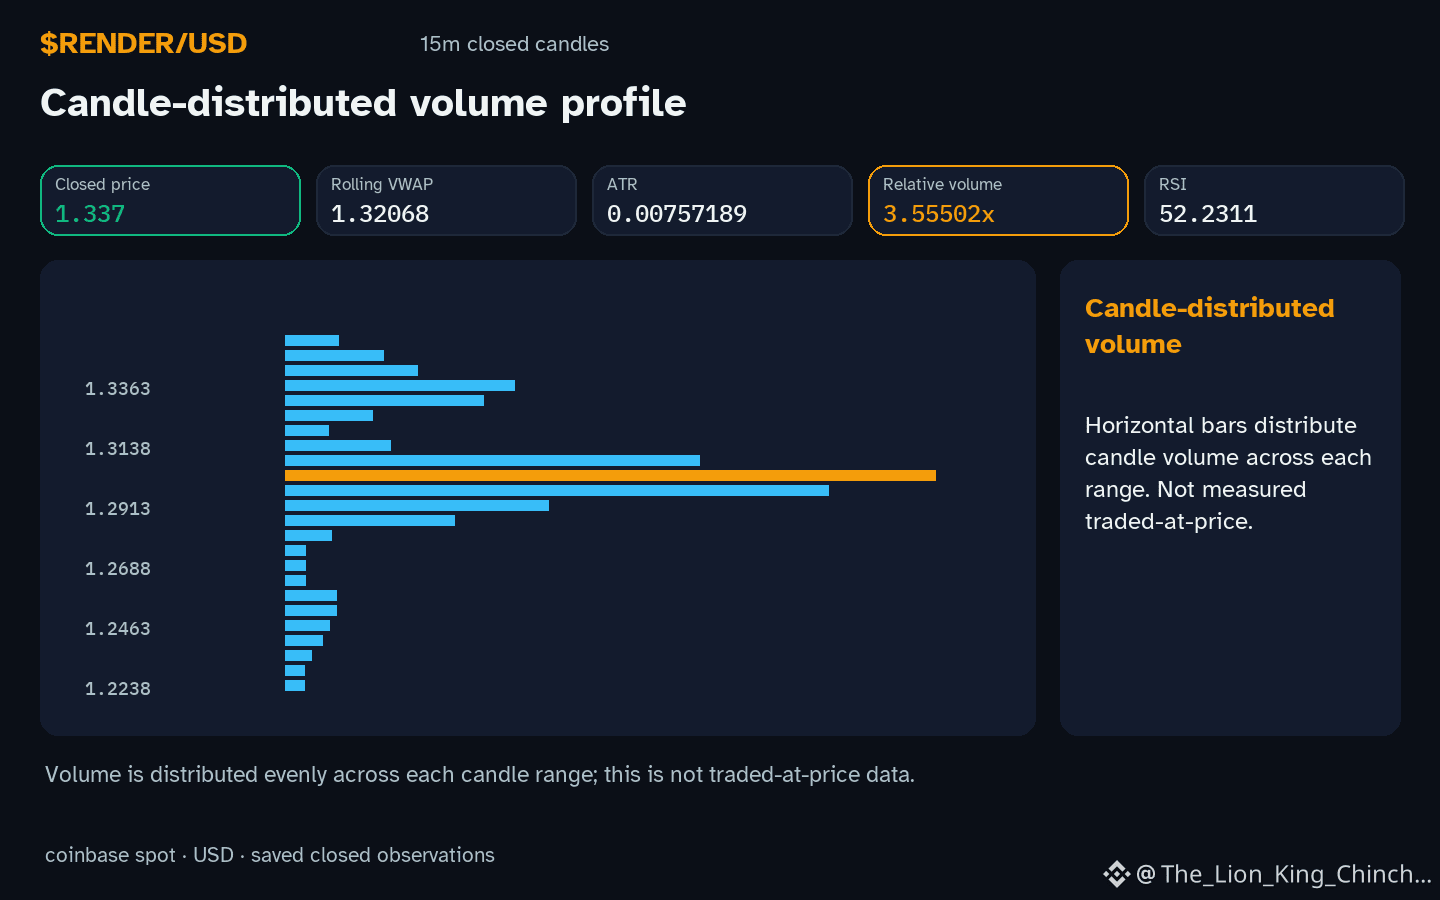
The observation notes a downward hourly direction, a range that remains bounded by local support 1.3246 and resistance 1.3574, and a relative volume of 3.56x baseline. One possible interpretation is that the price is testing lower bounds without decisive selling pressure, because volume, although higher than average, does not guarantee a breakout. A competing view suggests the elevated volume could represent short‑term buying interest that temporarily lifts the price before a deeper pullback.
To separate evidence from persuasion, consider a simple self‑check: if the next closed hourly candle shows a price that breaches the recorded support and the relative volume drops back toward baseline, the “testing” hypothesis loses credibility. Conversely, if the candle stays above support and volume remains elevated, the argument for a short‑term bounce gains weight.
This framework does not promise any profit, nor does it rely on social proof or Write‑to‑Earn incentives. It simply asks readers to match each claim with a concrete, observable condition and to revise their view when new data arrive. 🤔
Probabilistic market research, not a recommendation or guaranteed return.
#RENDER #CryptoCommunity #CryptoLearning
Why does $RENDER move down while staying inside its recorded range and showing volume above baseline? This tension invites a closer look at what the chart actually tells us versus what we assume.
The observation notes a downward hourly direction, a range that remains bounded by local support 1.3246 and resistance 1.3574, and a relative volume of 3.56x baseline. One possible interpretation is that the price is testing lower bounds without decisive selling pressure, because volume, although higher than average, does not guarantee a breakout. A competing view suggests the elevated volume could represent short‑term buying interest that temporarily lifts the price before a deeper pullback.
To separate evidence from persuasion, consider a simple self‑check: if the next closed hourly candle shows a price that breaches the recorded support and the relative volume drops back toward baseline, the “testing” hypothesis loses credibility. Conversely, if the candle stays above support and volume remains elevated, the argument for a short‑term bounce gains weight.
This framework does not promise any profit, nor does it rely on social proof or Write‑to‑Earn incentives. It simply asks readers to match each claim with a concrete, observable condition and to revise their view when new data arrive. 🤔
Probabilistic market research, not a recommendation or guaranteed return.
#RENDER #CryptoCommunity #CryptoLearning