$BULLA
/USDT — BUYERS ARE BACK! A BIG RECOVERY IN PROGRESS?
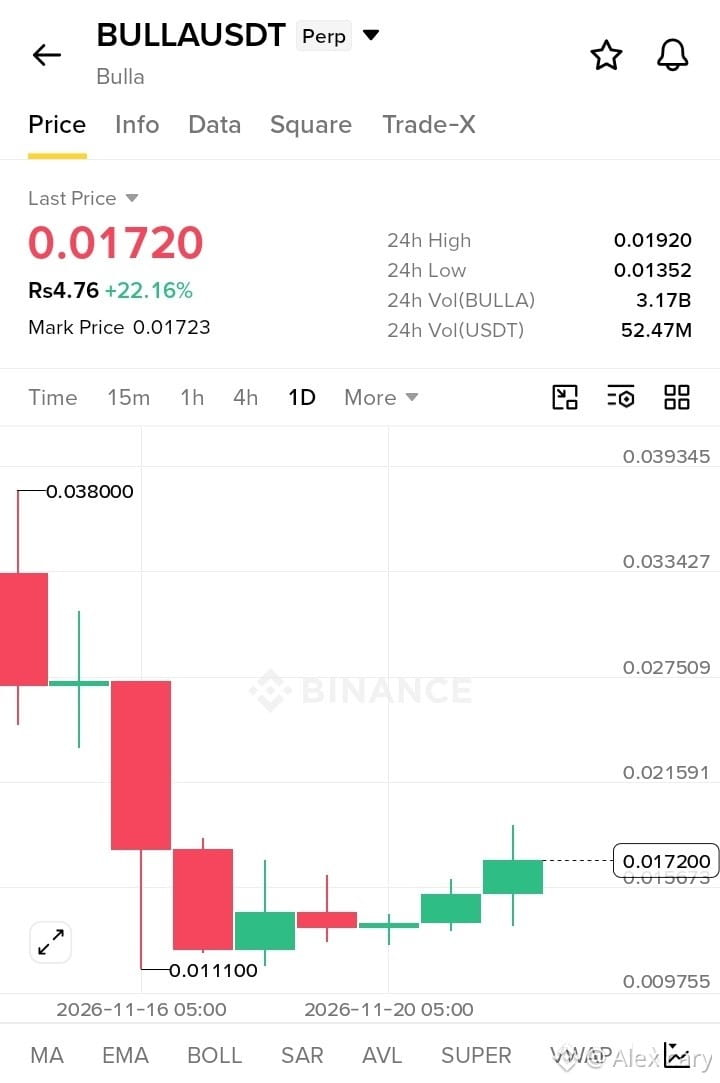
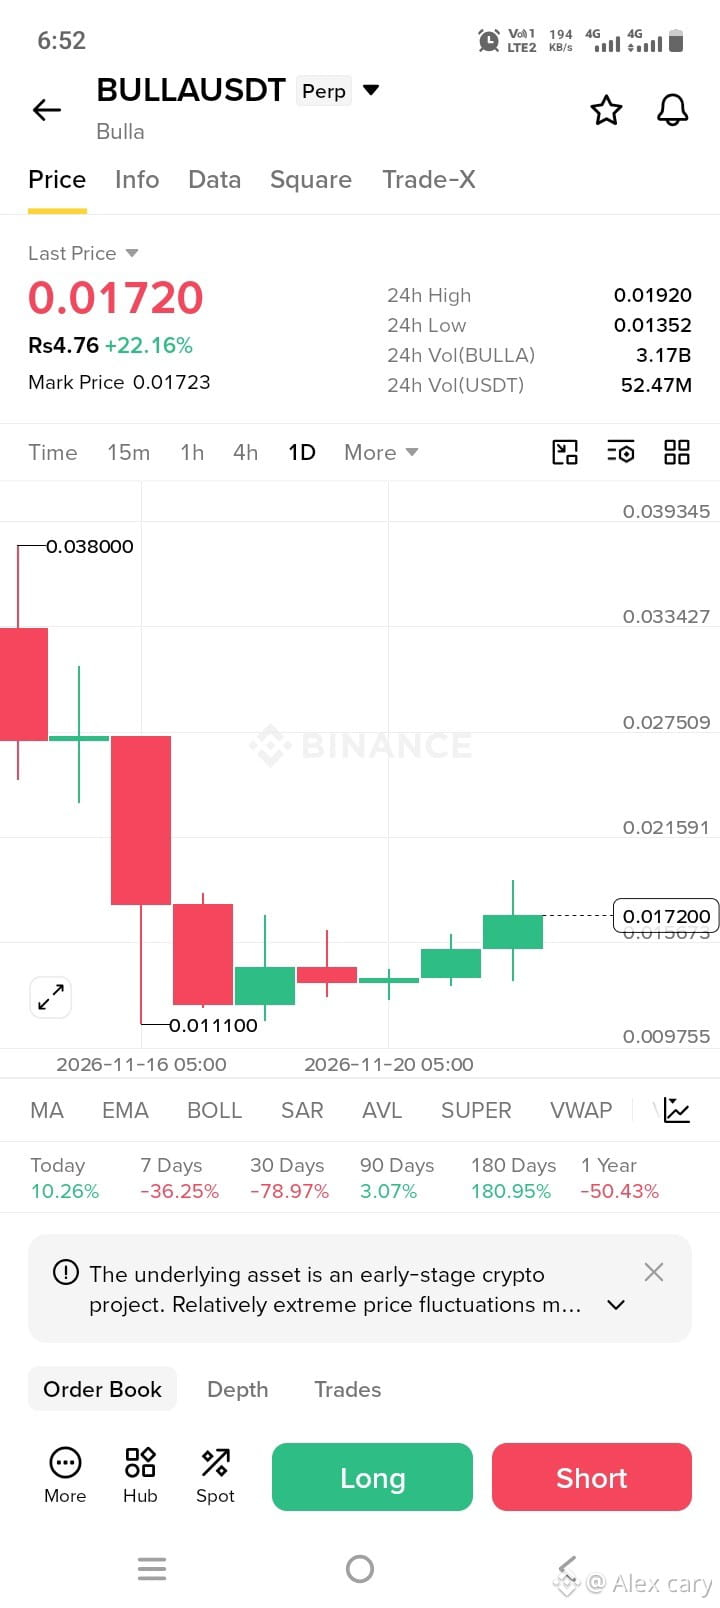
BULLA is showing a strong recovery on the 1D chart after dropping to the 0.01110 support zone. Bulls have stepped in, pushing the price toward 0.01720, with a remarkable +22.16% 24H gain.
The increasing green candles suggest improving buying momentum, but the next resistance zone will be crucial.
📊 MARKET OVERVIEW
- Current Price: 0.01720
- 24H Change: +22.16%
- 24H High: 0.01920
- 24H Low: 0.01352
- 24H Volume: 52.47M USDT
🎯 KEY TECHNICAL LEVELS
Resistance Zones:
- R1: 0.01920
- R2: 0.02159
- R3: 0.02750
Support Zones:
- S1: 0.01507
- S2: 0.01352
- Major Support: 0.01110
🚀 UPSIDE SCENARIO
A strong daily close above 0.01920 could open the door toward 0.02159. If bullish momentum continues, 0.02750 becomes a larger resistance area to watch.
⚠️ RISK & INVALIDATION
A drop below 0.01507 could weaken the recovery structure. A break below 0.01352 would signal additional downside risk.
Illustrative risk reference: 0.01340, not a recommended futures stop-loss.
🔥 FINAL VERDICT
BULLA is showing promising recovery momentum, but confirmation above 0.01920 is the key factor. Watch volume and daily candle closes before drawing conclusions.
Can BULLA challenge 0.02159 next, or will sellers defend 0.01920?
/USDT — BUYERS ARE BACK! A BIG RECOVERY IN PROGRESS?
BULLA is showing a strong recovery on the 1D chart after dropping to the 0.01110 support zone. Bulls have stepped in, pushing the price toward 0.01720, with a remarkable +22.16% 24H gain.
The increasing green candles suggest improving buying momentum, but the next resistance zone will be crucial.
📊 MARKET OVERVIEW
- Current Price: 0.01720
- 24H Change: +22.16%
- 24H High: 0.01920
- 24H Low: 0.01352
- 24H Volume: 52.47M USDT
🎯 KEY TECHNICAL LEVELS
Resistance Zones:
- R1: 0.01920
- R2: 0.02159
- R3: 0.02750
Support Zones:
- S1: 0.01507
- S2: 0.01352
- Major Support: 0.01110
🚀 UPSIDE SCENARIO
A strong daily close above 0.01920 could open the door toward 0.02159. If bullish momentum continues, 0.02750 becomes a larger resistance area to watch.
⚠️ RISK & INVALIDATION
A drop below 0.01507 could weaken the recovery structure. A break below 0.01352 would signal additional downside risk.
Illustrative risk reference: 0.01340, not a recommended futures stop-loss.
🔥 FINAL VERDICT
BULLA is showing promising recovery momentum, but confirmation above 0.01920 is the key factor. Watch volume and daily candle closes before drawing conclusions.
Can BULLA challenge 0.02159 next, or will sellers defend 0.01920?