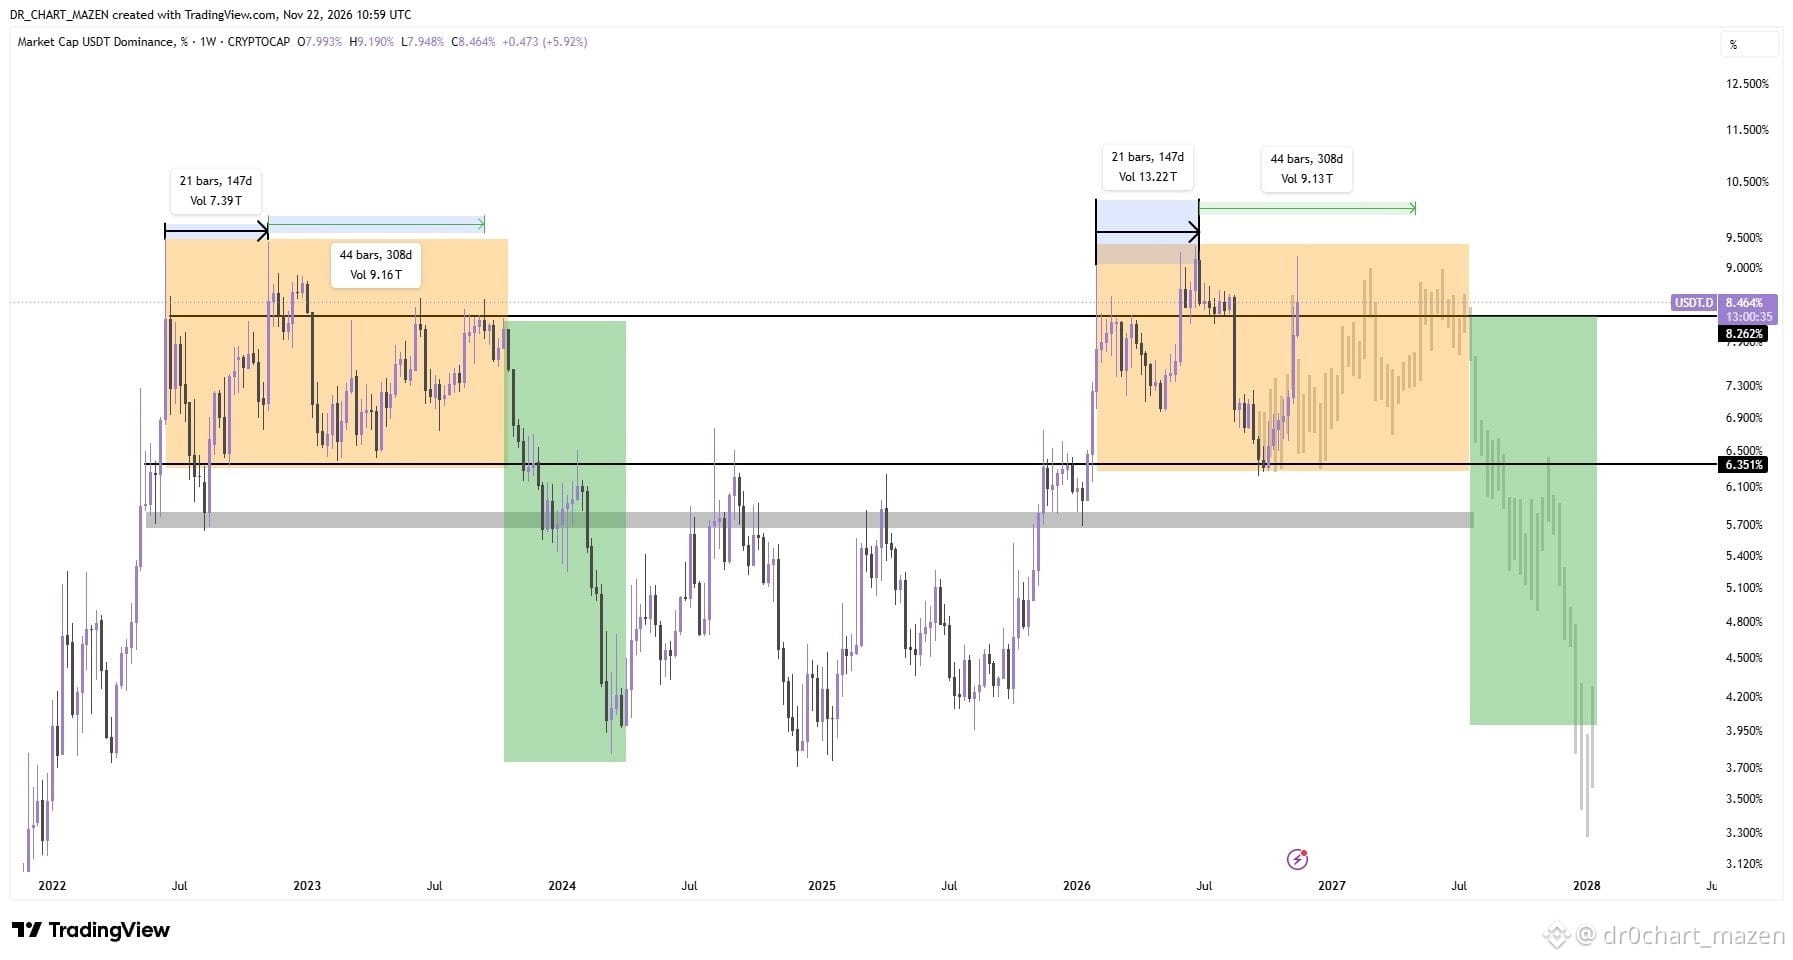
The US Dollar Dominance chart (USDT.D) is currently the best chart to follow when monitoring the cryptocurrency market, particularly Bitcoin.
Dominance has broken through the previous important zone at 8.262% and has now reached a very important zone at the 9.2% level. Despite this, the situation remains normal for following Bitcoin, and it is still better to read this chart as the primary indicator for market movements.
This pattern repeated in both 2022 and 2023, and the same situation is unfolding now. The key point is to monitor the reaction at the 9.2% zone without a two-week close above this level
يُعدّ شارت استحواذ الدولار (USDT.D) أفضل شارت حاليًا لمتابعة سوق العملات الرقمية، وتحديدًا البيتكوين.
اخترق شارت الاستحواذ منطقة 8.262% ووصل إلى منطقة مهمة جدًا عند مستوى 9.2%. رغم ذلك، يبقى الوضع طبيعيًا لمتابعة البيتكوين، والأفضل الاستمرار في قراءة هذا الشارت كمؤشر رئيسي لحركة السوق.
تكرر هذا السيناريو في عامي 2022 و2023، وهو يحدث حاليًا بنفس الطريقة. الأهم متابعة رد فعل الاستحواذ عند منطقة 9.2% دون إغلاق أسبوعي لمدّة أسبوعين فوقه.
Dominance has broken through the previous important zone at 8.262% and has now reached a very important zone at the 9.2% level. Despite this, the situation remains normal for following Bitcoin, and it is still better to read this chart as the primary indicator for market movements.
This pattern repeated in both 2022 and 2023, and the same situation is unfolding now. The key point is to monitor the reaction at the 9.2% zone without a two-week close above this level
يُعدّ شارت استحواذ الدولار (USDT.D) أفضل شارت حاليًا لمتابعة سوق العملات الرقمية، وتحديدًا البيتكوين.
اخترق شارت الاستحواذ منطقة 8.262% ووصل إلى منطقة مهمة جدًا عند مستوى 9.2%. رغم ذلك، يبقى الوضع طبيعيًا لمتابعة البيتكوين، والأفضل الاستمرار في قراءة هذا الشارت كمؤشر رئيسي لحركة السوق.
تكرر هذا السيناريو في عامي 2022 و2023، وهو يحدث حاليًا بنفس الطريقة. الأهم متابعة رد فعل الاستحواذ عند منطقة 9.2% دون إغلاق أسبوعي لمدّة أسبوعين فوقه.