$QQQB : Evaluating Short-Term Volume Clusters
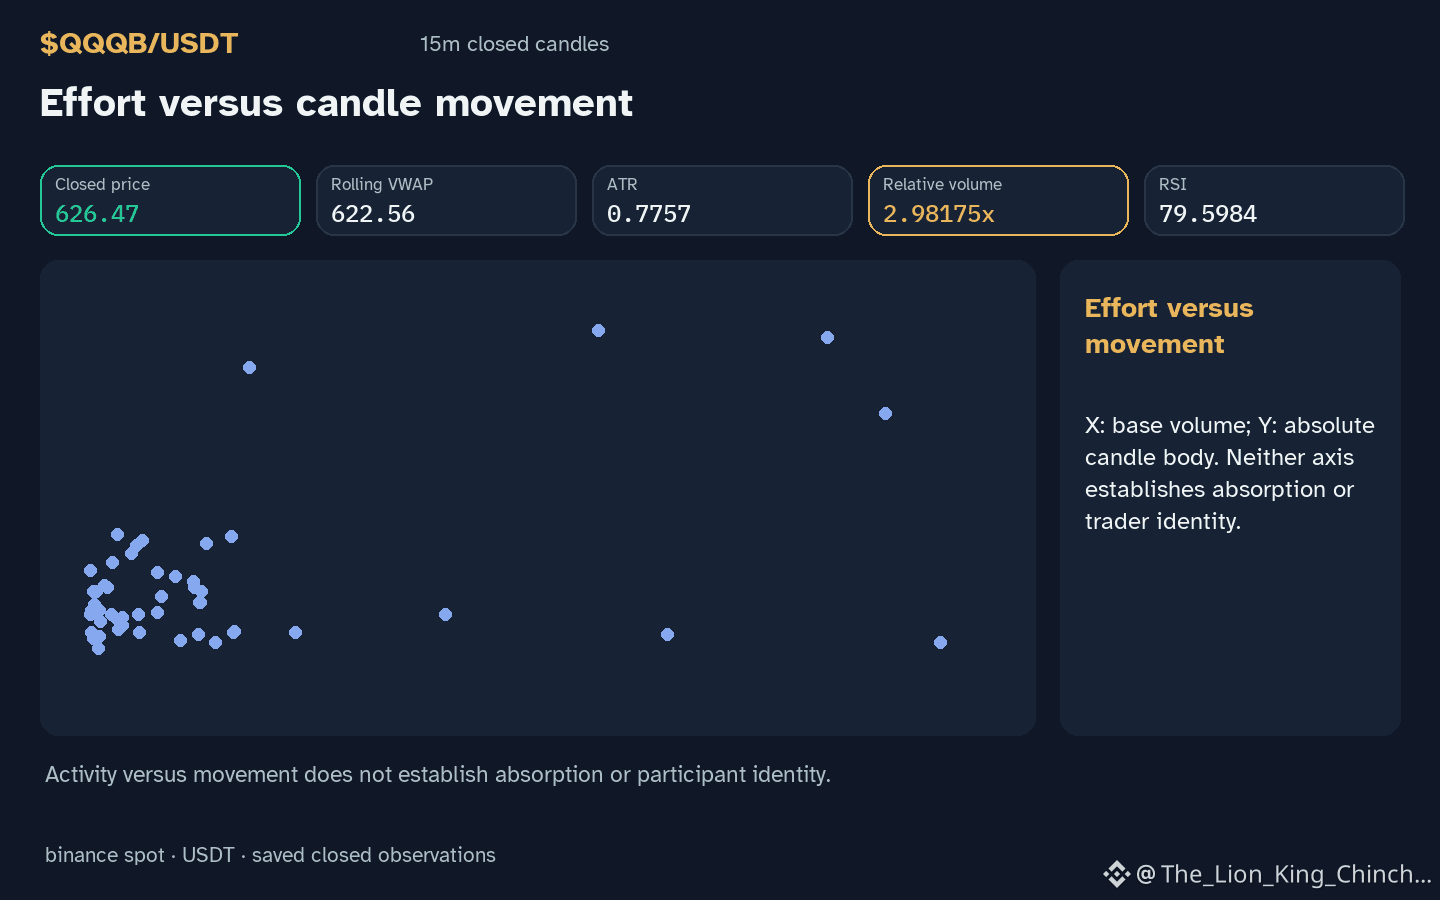
$QQQB : Does the distribution of volume across a recent sequence of candles clarify a move, or does it merely reflect noise? Currently, $QQQB is trading above resistance while the hourly direction is up.
### A Hypothetical Decision
Consider a thought experiment where an observer tracks activity across a rolling window of bars. If candles moving with the trend show relative volume 2.98x the baseline, while counter-trend candles see volume drop, one interpretation suggests a specific direction is attracting more activity. This is a hypothetical mechanism where the concentration of activity, rather than just the current price, serves as the primary clue. With RSI at 79.6, the price has moved upward alongside volume that sits above the baseline.
### Where the Analogy Helps
In this scenario, heavy volume on up-candles followed by light volume on down-candles might imply that the upward move is more significant than the retracement. This helps distinguish a steady trend from erratic volatility. For example, if the hourly change 0.515034% occurred on much higher participation than the preceding small dips, the trend might appear more robust under this specific reading.
### Where the Analogy Fails
This interpretation is limited because it cannot confirm why the activity occurred. A counterexample would be a sudden spike on a single candle that distorts the average, making the entire window look active when it was actually one moment of imbalance. If a future closed candle shows a daily change 1.53155% on declining volume while price stays above support 619.66, it would weaken the idea that volume is sustaining the current direction. One way to reassess this is to check if price continues to hold the local level without the accompanying volume spikes. ⌛
Probabilistic market research, not a recommendation or guaranteed return.
#QQQB
$QQQB : Does the distribution of volume across a recent sequence of candles clarify a move, or does it merely reflect noise? Currently, $QQQB is trading above resistance while the hourly direction is up.
### A Hypothetical Decision
Consider a thought experiment where an observer tracks activity across a rolling window of bars. If candles moving with the trend show relative volume 2.98x the baseline, while counter-trend candles see volume drop, one interpretation suggests a specific direction is attracting more activity. This is a hypothetical mechanism where the concentration of activity, rather than just the current price, serves as the primary clue. With RSI at 79.6, the price has moved upward alongside volume that sits above the baseline.
### Where the Analogy Helps
In this scenario, heavy volume on up-candles followed by light volume on down-candles might imply that the upward move is more significant than the retracement. This helps distinguish a steady trend from erratic volatility. For example, if the hourly change 0.515034% occurred on much higher participation than the preceding small dips, the trend might appear more robust under this specific reading.
### Where the Analogy Fails
This interpretation is limited because it cannot confirm why the activity occurred. A counterexample would be a sudden spike on a single candle that distorts the average, making the entire window look active when it was actually one moment of imbalance. If a future closed candle shows a daily change 1.53155% on declining volume while price stays above support 619.66, it would weaken the idea that volume is sustaining the current direction. One way to reassess this is to check if price continues to hold the local level without the accompanying volume spikes. ⌛
Probabilistic market research, not a recommendation or guaranteed return.
#QQQB