
BITCOIN IS STILL BEARISH ON THE 4H CHART! IS $54,670 THE NEXT TARGET? 📉👀
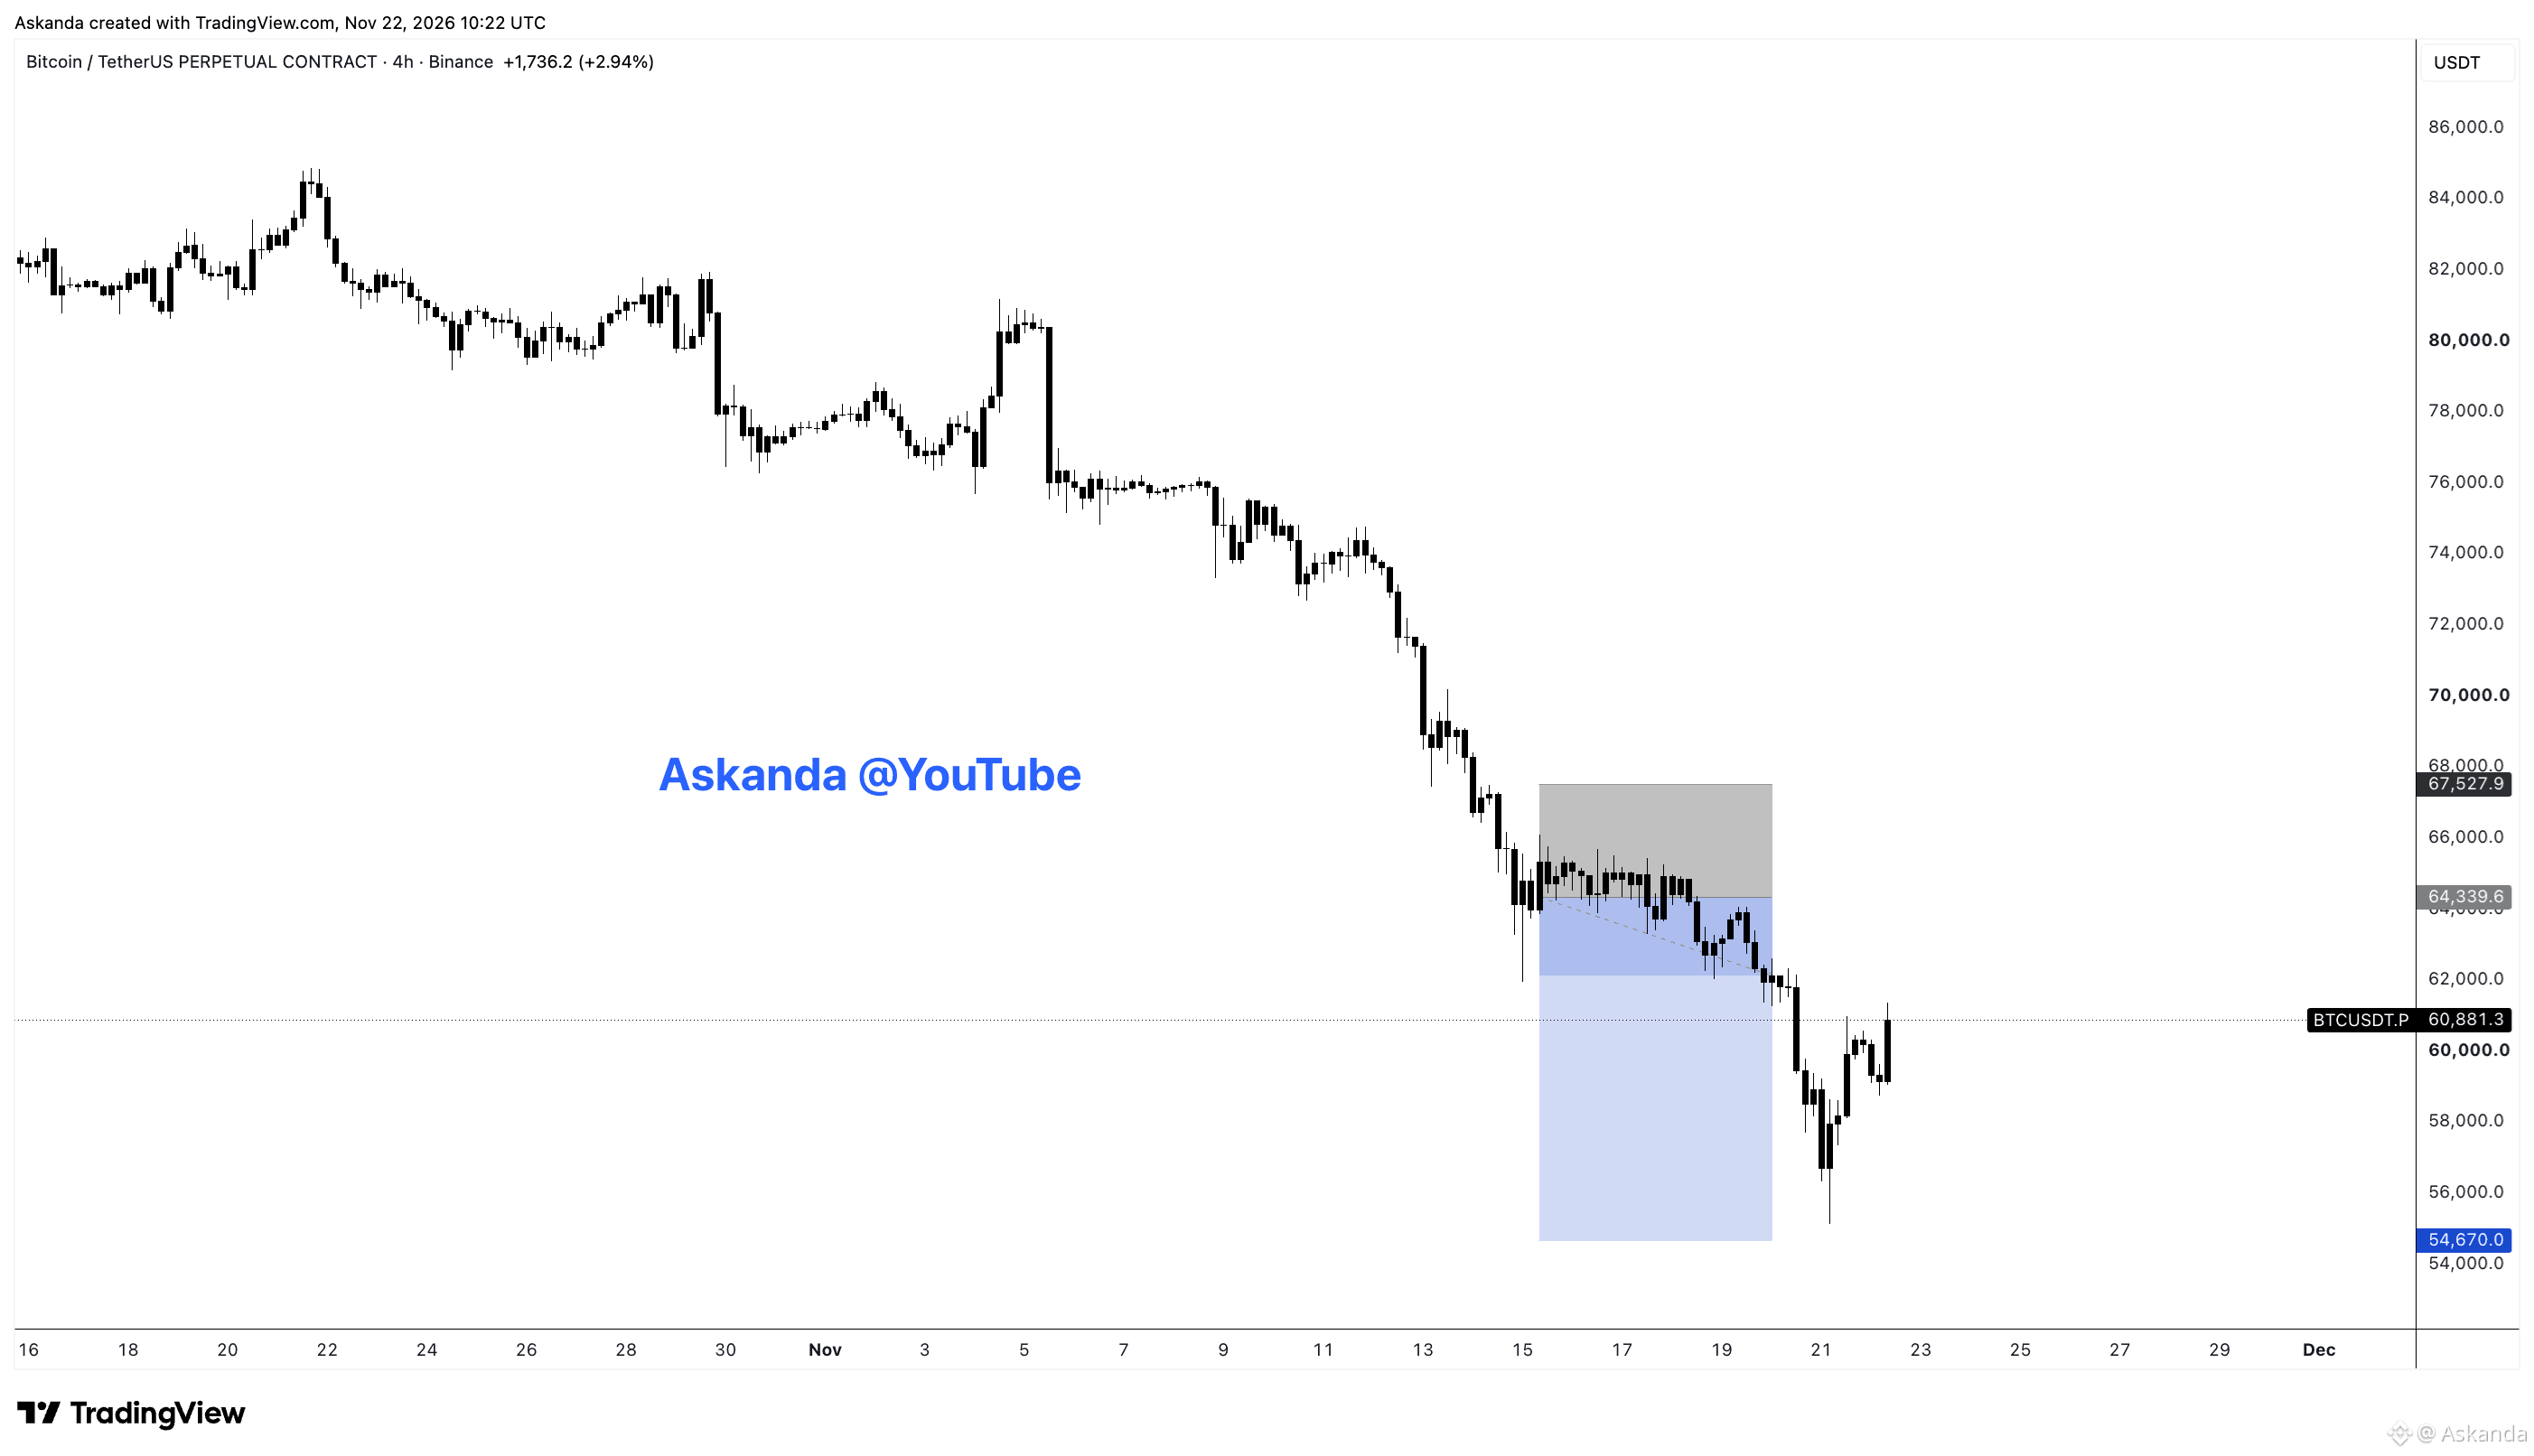
Bitcoin has experienced significant selling pressure, falling from the $84,000 region toward $56,000. Looking at my 4-hour TradingView chart, the market continues to print lower highs and lower lows, confirming a bearish structure.
📊 My key levels:
🔴 Major Resistance: $67,528
🔴 Key Resistance: $64,340
🟡 Current Chart Price: $60,881
🟢 Support: $56,000–$57,000
🎯 Downside Target: $54,670
My previous short setup was based on a rejection around $64,340, with invalidation near $67,528 and a target of $54,670, offering approximately 1:3 risk-to-reward.
What am I watching now?
If Bitcoin rejects the $62,000–$64,340 resistance region and forms another lower high, the bearish trend could continue.
However, a confirmed break and hold above $64,340 could signal improving bullish momentum.
My trading rule: Never chase a move. Wait for market structure confirmation, define your stop-loss and protect your capital.
HERE IS MY QUESTION:
Will $BTC
Bitcoin recover above $64,000, or are we heading toward $54,000 first?
Let me know your prediction! 👇
$BTC #Bitcoin #BTC #BinanceFutures #TechnicalAnalysis #CryptoTrading #Askanda
Bitcoin has experienced significant selling pressure, falling from the $84,000 region toward $56,000. Looking at my 4-hour TradingView chart, the market continues to print lower highs and lower lows, confirming a bearish structure.
📊 My key levels:
🔴 Major Resistance: $67,528
🔴 Key Resistance: $64,340
🟡 Current Chart Price: $60,881
🟢 Support: $56,000–$57,000
🎯 Downside Target: $54,670
My previous short setup was based on a rejection around $64,340, with invalidation near $67,528 and a target of $54,670, offering approximately 1:3 risk-to-reward.
What am I watching now?
If Bitcoin rejects the $62,000–$64,340 resistance region and forms another lower high, the bearish trend could continue.
However, a confirmed break and hold above $64,340 could signal improving bullish momentum.
My trading rule: Never chase a move. Wait for market structure confirmation, define your stop-loss and protect your capital.
HERE IS MY QUESTION:
Will $BTC
Bitcoin recover above $64,000, or are we heading toward $54,000 first?
Let me know your prediction! 👇
$BTC #Bitcoin #BTC #BinanceFutures #TechnicalAnalysis #CryptoTrading #Askanda