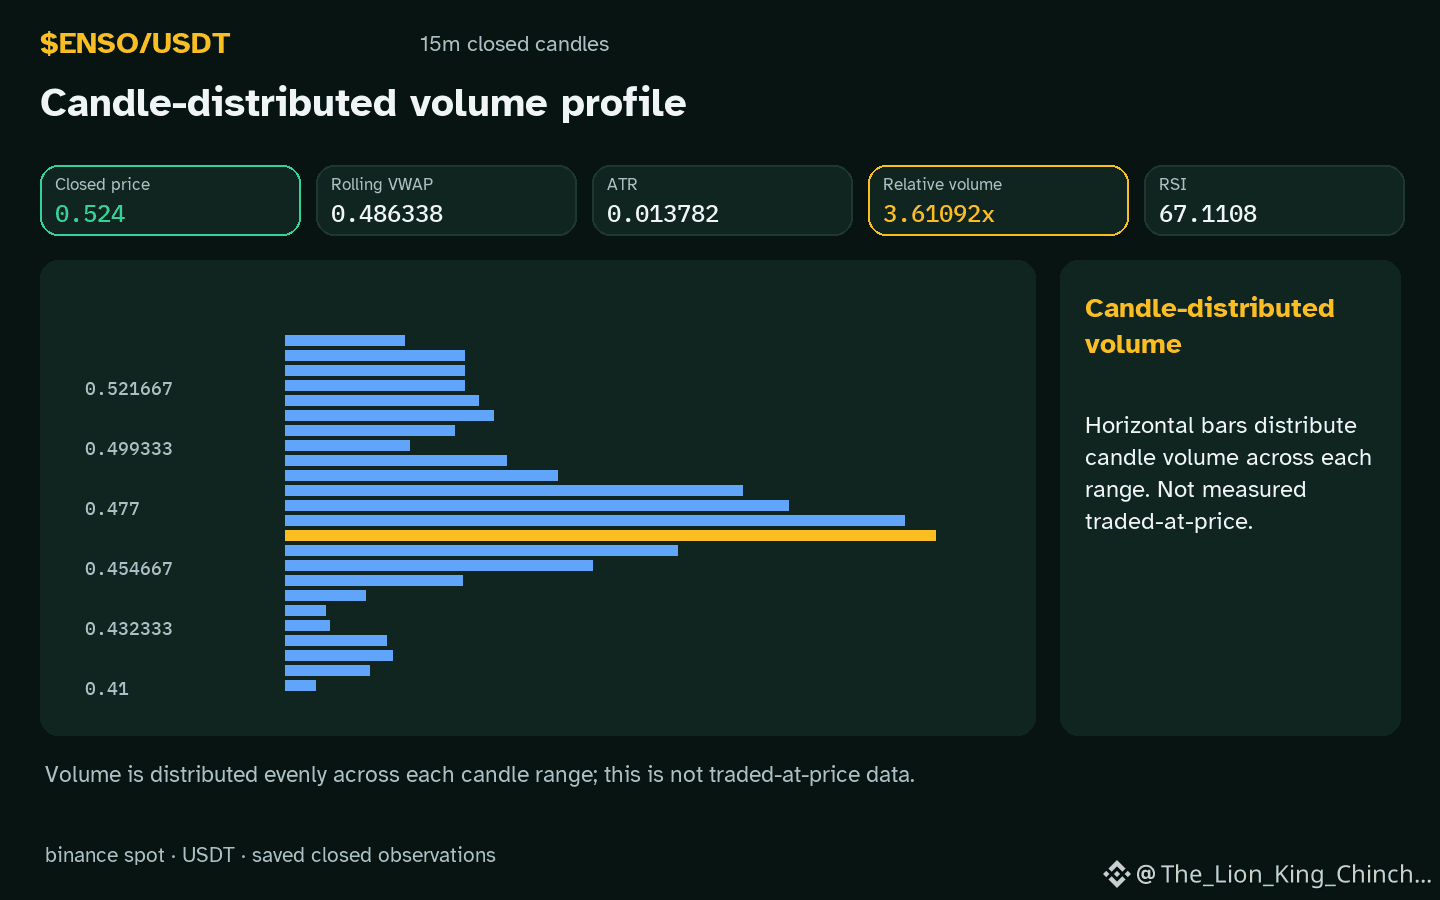
$ENSO – When High Volume Feels Like a Breakout or a Capitulation
$ENSO is moving upward on the hourly chart while volume sits above the baseline, and the price remains inside the recorded range. Does this pattern indicate a genuine continuation or merely a temporary capitulation flare?
**Myth:** Traders often assume that any spike in volume above baseline automatically confirms a breakout. The belief is that high volume equals strong conviction, so the move must continue.
**Reality:** Volume alone does not reveal intent. A surge can arise from panic selling that quickly reverses, producing a short‑lived price lift that mimics a breakout. In our observation, the asset trades inside local support and resistance, meaning price pressure is constrained. The upward hourly direction could simply be the market filling orders after a brief capitulation bout rather than a sustained trend.
**Mechanism:** When sellers exhaust at a low‑volume pocket, a flurry of stop orders may trigger, generating a volume spike. The price may tick higher as the order book clears, yet the lack of new buyers keeps the candle within the prior range. The result is a volume climax that looks like a breakout but lacks follow‑through.
**Counterexample:** If the next closed hourly candle shows volume returning to baseline while price stays flat or slips, the continuation hypothesis weakens.
**Self‑check:** Track 3.61x baseline for the next two hours; a rapid decline toward baseline combined with a flat or falling 67.1 suggests the spike was a capitulation echo rather than a durable push.
**Reassessment condition:** Should the subsequent hourly candle close below the current low with volume still above baseline, the hypothesis of continuation should be abandoned in favor of a short‑term correction scenario.
Probabilistic market research, not a recommendation or guaranteed return.
#ENSO #CryptoLearning
$ENSO is moving upward on the hourly chart while volume sits above the baseline, and the price remains inside the recorded range. Does this pattern indicate a genuine continuation or merely a temporary capitulation flare?
**Myth:** Traders often assume that any spike in volume above baseline automatically confirms a breakout. The belief is that high volume equals strong conviction, so the move must continue.
**Reality:** Volume alone does not reveal intent. A surge can arise from panic selling that quickly reverses, producing a short‑lived price lift that mimics a breakout. In our observation, the asset trades inside local support and resistance, meaning price pressure is constrained. The upward hourly direction could simply be the market filling orders after a brief capitulation bout rather than a sustained trend.
**Mechanism:** When sellers exhaust at a low‑volume pocket, a flurry of stop orders may trigger, generating a volume spike. The price may tick higher as the order book clears, yet the lack of new buyers keeps the candle within the prior range. The result is a volume climax that looks like a breakout but lacks follow‑through.
**Counterexample:** If the next closed hourly candle shows volume returning to baseline while price stays flat or slips, the continuation hypothesis weakens.
**Self‑check:** Track 3.61x baseline for the next two hours; a rapid decline toward baseline combined with a flat or falling 67.1 suggests the spike was a capitulation echo rather than a durable push.
**Reassessment condition:** Should the subsequent hourly candle close below the current low with volume still above baseline, the hypothesis of continuation should be abandoned in favor of a short‑term correction scenario.
Probabilistic market research, not a recommendation or guaranteed return.
#ENSO #CryptoLearning