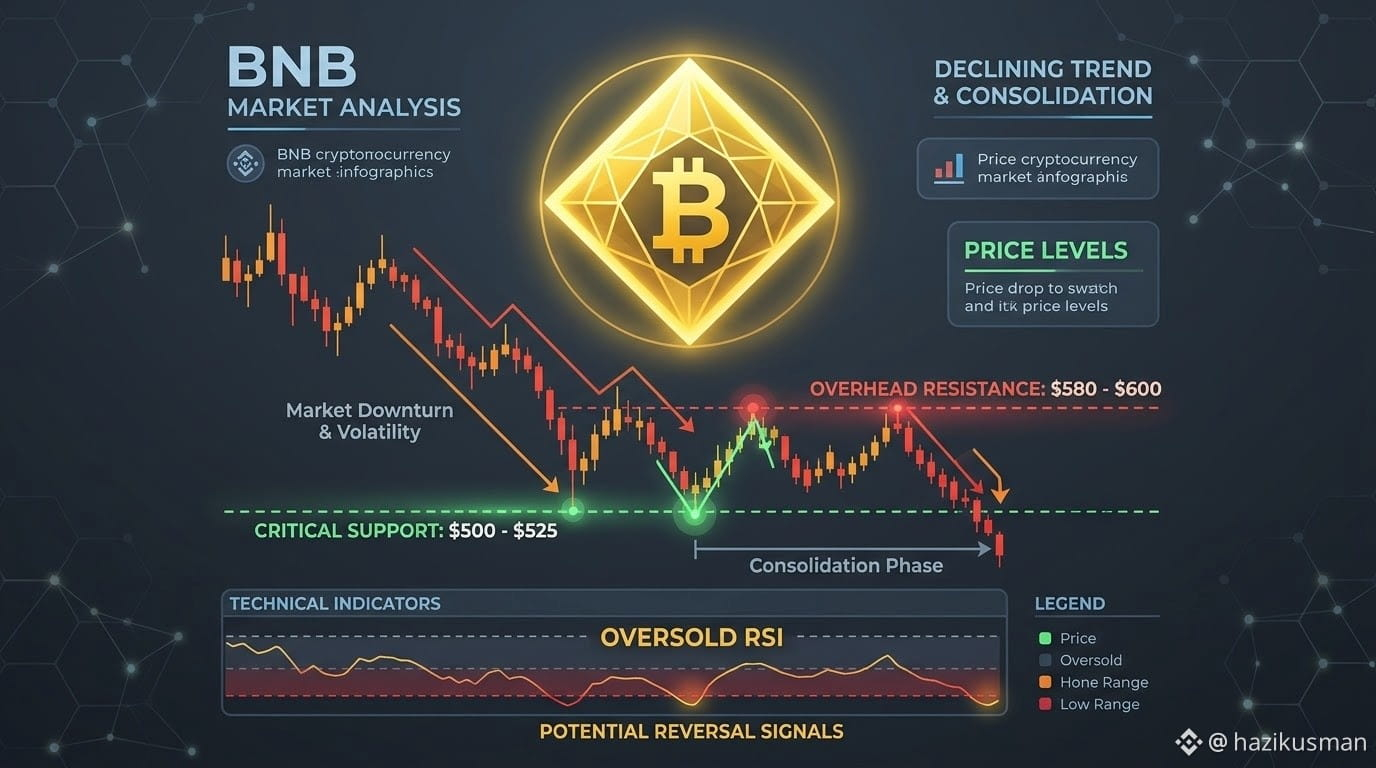
$BNB is currently trading in the $525 – $568 range (roughly PKR 151,350), facing heavy downward pressure and high volatility following a sharp November pullback of nearly 19%.
Market Snapshot & Technical Picture
Price Action & Sentiment: Sentiment is firmly bearish, with the broader Crypto Fear & Greed Index sitting in Extreme Fear (12). BNB has fallen roughly 30% from its October peak, trading well below its 50-day (~$705) and 200-day (~$657) Simple Moving Averages.
Key Levels to Watch:
Immediate Support: $523 – $540 (lower Bollinger Band and June structural lows), followed by the critical psychological floor at $500.
Key Resistance: $565 – $580 as the nearest overhead barrier, followed by the major psychological ceiling at $600.
Momentum Indicators: While MACD signals ongoing bearish momentum, the 14-day Relative Strength Index (RSI) has dropped deep into oversold territory (~19–25). This extreme reading suggests selling pressure may be nearing exhaustion and raises the potential for a short-term technical relief bounce.
Fundamental Drivers
Security Aftermath & Macro Headwinds: Ongoing investor caution following the late-October Binance security incident—combined with broader crypto liquidity drains ahead of December's Federal Reserve rate decision—continues to weigh on near-term buyer confidence.
Ecosystem Resilience: Despite short-term price weakness, BNB Chain utility, regular token burns, and long-term regulatory progress keep its underlying ecosystem active.
Short-Term Outlook
Bullish Scenario: Defending the $500–$525 demand zone and reclaiming $580 could spark an oversold relief rally toward $600–$615 by year-end.
Bearish Scenario: A sustained breakdown below $500 on high volume would confirm bearish continuation and expose BNB to deeper corrective losses.
Market Snapshot & Technical Picture
Price Action & Sentiment: Sentiment is firmly bearish, with the broader Crypto Fear & Greed Index sitting in Extreme Fear (12). BNB has fallen roughly 30% from its October peak, trading well below its 50-day (~$705) and 200-day (~$657) Simple Moving Averages.
Key Levels to Watch:
Immediate Support: $523 – $540 (lower Bollinger Band and June structural lows), followed by the critical psychological floor at $500.
Key Resistance: $565 – $580 as the nearest overhead barrier, followed by the major psychological ceiling at $600.
Momentum Indicators: While MACD signals ongoing bearish momentum, the 14-day Relative Strength Index (RSI) has dropped deep into oversold territory (~19–25). This extreme reading suggests selling pressure may be nearing exhaustion and raises the potential for a short-term technical relief bounce.
Fundamental Drivers
Security Aftermath & Macro Headwinds: Ongoing investor caution following the late-October Binance security incident—combined with broader crypto liquidity drains ahead of December's Federal Reserve rate decision—continues to weigh on near-term buyer confidence.
Ecosystem Resilience: Despite short-term price weakness, BNB Chain utility, regular token burns, and long-term regulatory progress keep its underlying ecosystem active.
Short-Term Outlook
Bullish Scenario: Defending the $500–$525 demand zone and reclaiming $580 could spark an oversold relief rally toward $600–$615 by year-end.
Bearish Scenario: A sustained breakdown below $500 on high volume would confirm bearish continuation and expose BNB to deeper corrective losses.