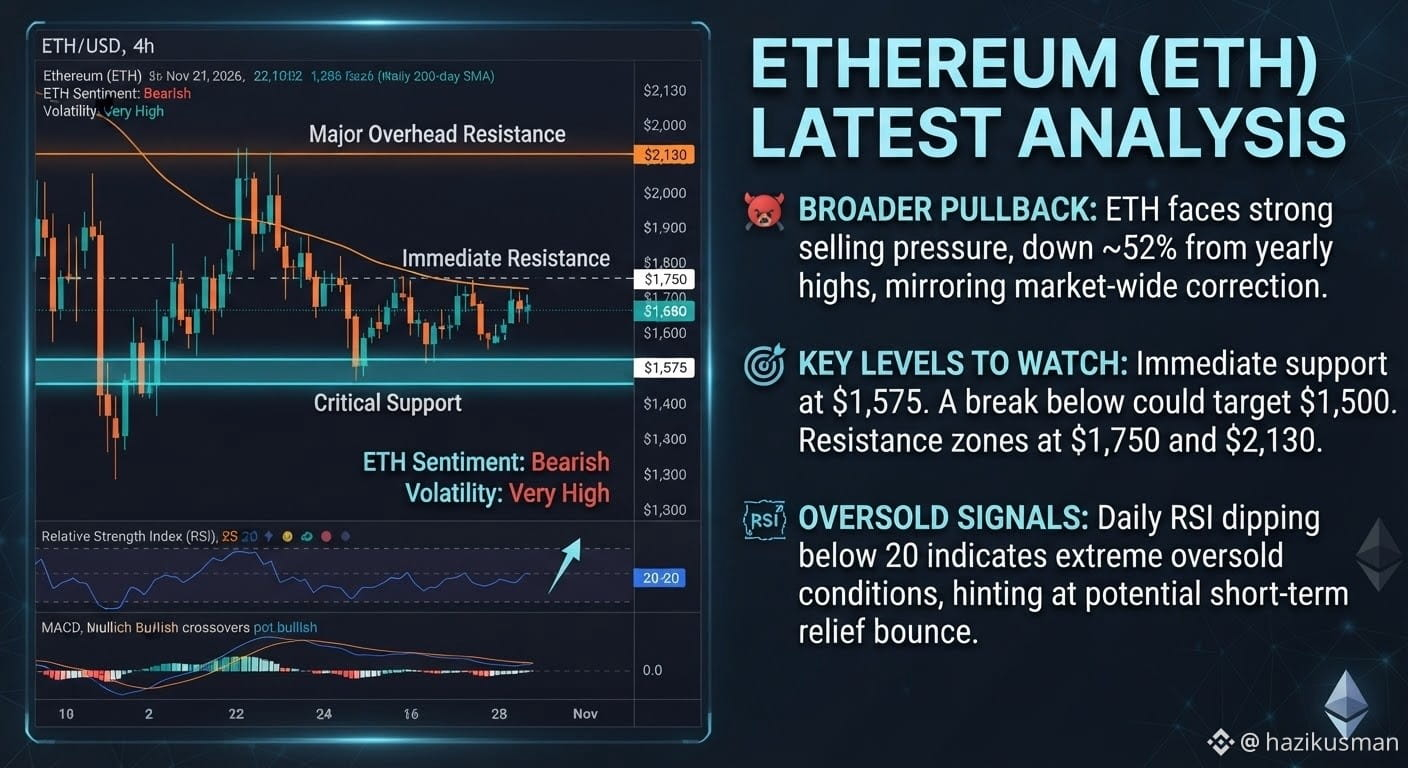
$ETH is currently trading around $1,600 – $1,680 (roughly PKR 464,000), undergoing a sharp broader pullback and high volatility alongside the wider crypto market.
Market Snapshot & Technical Picture
Price Action & Sentiment: ETH has faced heavy selling pressure, sliding roughly 23% since the start of November amid sticky inflation fears, risk-off sentiment, and persistent spot ETF outflows. The overall trend remains firmly bearish as ETH trades well below its 50-day (~$2,189) and 200-day (~$2,271–$2,293) Exponential Moving Averages.
Key Levels to Watch:
Immediate Support: $1,550 – $1,580 — A critical near-term demand zone. A sustained breakdown below this area could expose ETH to deeper losses toward $1,500.
Key Resistance: $1,700 – $1,750 as the first recovery hurdle, followed by a heavy supply zone at $1,835 (10-day EMA/SMA) and $2,189+ (50-day EMA).
Momentum Indicators: While the MACD remains negative, the daily Relative Strength Index (RSI) has plunged deep into oversold territory (~23). Combined with rising futures open interest from retail traders, this suggests selling may be overextended and hints at a potential short-term relief bounce.
Fundamental Drivers
Institutional Outflows vs. Retail Dip-Buying: Persistent net outflows from US spot Ethereum ETFs have outweighed returning retail derivatives activity.
Network Upgrades & On-Chain Base: Despite price weakness, Ethereum continues to anchor over $46 billion in DeFi deposits and $13+ billion in tokenized real-world assets, while developers work through testnet compatibility ahead of the upcoming Glamsterdam network upgrade.
Short-Term Outlook
Bullish Scenario: Defending $1,550–$1,580 and reclaiming $1,750 could trigger an oversold relief rally toward $1,835–$1,975.
Bearish Scenario: A clean break below $1,550 on high volume would confirm trend continuation and open the door to the $1,400–$1,500 range.
Market Snapshot & Technical Picture
Price Action & Sentiment: ETH has faced heavy selling pressure, sliding roughly 23% since the start of November amid sticky inflation fears, risk-off sentiment, and persistent spot ETF outflows. The overall trend remains firmly bearish as ETH trades well below its 50-day (~$2,189) and 200-day (~$2,271–$2,293) Exponential Moving Averages.
Key Levels to Watch:
Immediate Support: $1,550 – $1,580 — A critical near-term demand zone. A sustained breakdown below this area could expose ETH to deeper losses toward $1,500.
Key Resistance: $1,700 – $1,750 as the first recovery hurdle, followed by a heavy supply zone at $1,835 (10-day EMA/SMA) and $2,189+ (50-day EMA).
Momentum Indicators: While the MACD remains negative, the daily Relative Strength Index (RSI) has plunged deep into oversold territory (~23). Combined with rising futures open interest from retail traders, this suggests selling may be overextended and hints at a potential short-term relief bounce.
Fundamental Drivers
Institutional Outflows vs. Retail Dip-Buying: Persistent net outflows from US spot Ethereum ETFs have outweighed returning retail derivatives activity.
Network Upgrades & On-Chain Base: Despite price weakness, Ethereum continues to anchor over $46 billion in DeFi deposits and $13+ billion in tokenized real-world assets, while developers work through testnet compatibility ahead of the upcoming Glamsterdam network upgrade.
Short-Term Outlook
Bullish Scenario: Defending $1,550–$1,580 and reclaiming $1,750 could trigger an oversold relief rally toward $1,835–$1,975.
Bearish Scenario: A clean break below $1,550 on high volume would confirm trend continuation and open the door to the $1,400–$1,500 range.