📉 Bitcoin Bear Market Indicator Turns Negative Again
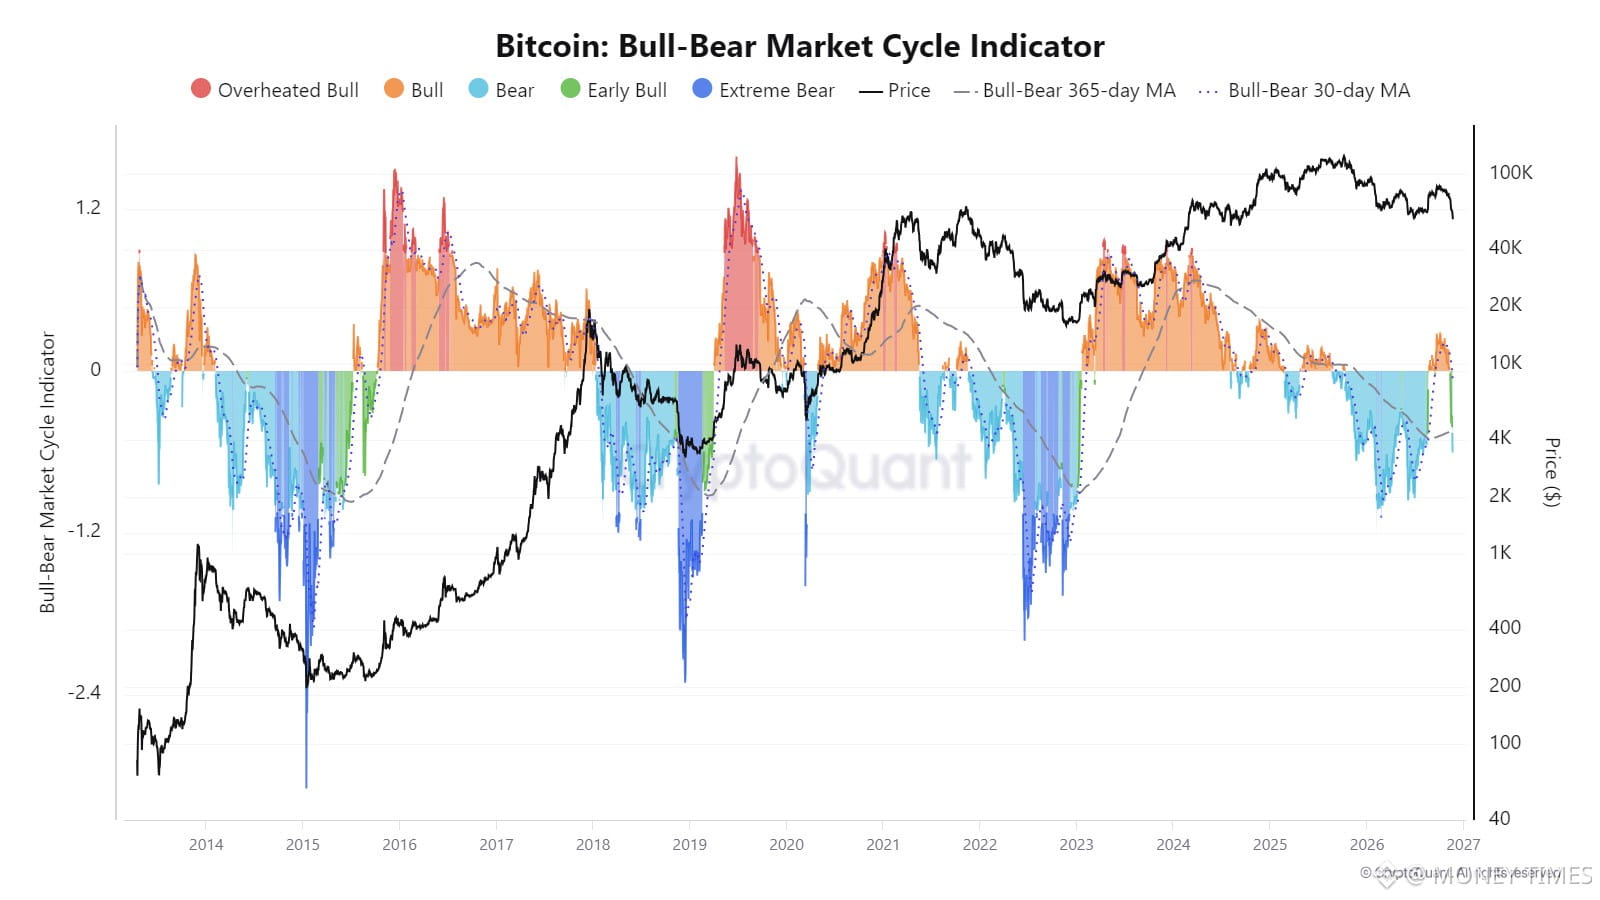
Bitcoin’s market cycle outlook is showing renewed weakness as CryptoQuant’s Bull-Bear Market Cycle Indicator falls back below zero, with its latest reading near -0.5 while BTC trades around $60K.
📊 How Does It Compare With Previous Cycles?
Historically, the indicator reached deeper negative levels during major market downturns:
- 2015: Around -2.4
- 2018–2019: Around -1.8
- 2022: Around -2.0
- First half of 2026: Around -1.2
- Current reading: Around -0.5
This suggests that the current bearish phase remains less extreme than previous major market bottoms.
🔍 What Does This Mean for Investors?
The indicator measures market conditions rather than predicting an exact bottom. Its current position suggests that Bitcoin may still be experiencing a gradual bearish phase rather than a complete market capitulation.
Other factors, including ETF outflows, declining stablecoin supply, and extreme market fear, also point toward continued pressure on the crypto market.
⚠️ What Should We Watch Next?
A further decline toward -1 or below could indicate deeper market stress. On the other hand, stabilization in the indicator could be an early sign of improving market conditions.
Key Takeaway: The current data suggests that Bitcoin's bearish phase may not have reached the same extreme levels seen in previous cycles. However, a market recovery is not confirmed yet.
$BTC
#Bitcoin #CryptoMarket
Bitcoin’s market cycle outlook is showing renewed weakness as CryptoQuant’s Bull-Bear Market Cycle Indicator falls back below zero, with its latest reading near -0.5 while BTC trades around $60K.
📊 How Does It Compare With Previous Cycles?
Historically, the indicator reached deeper negative levels during major market downturns:
- 2015: Around -2.4
- 2018–2019: Around -1.8
- 2022: Around -2.0
- First half of 2026: Around -1.2
- Current reading: Around -0.5
This suggests that the current bearish phase remains less extreme than previous major market bottoms.
🔍 What Does This Mean for Investors?
The indicator measures market conditions rather than predicting an exact bottom. Its current position suggests that Bitcoin may still be experiencing a gradual bearish phase rather than a complete market capitulation.
Other factors, including ETF outflows, declining stablecoin supply, and extreme market fear, also point toward continued pressure on the crypto market.
⚠️ What Should We Watch Next?
A further decline toward -1 or below could indicate deeper market stress. On the other hand, stabilization in the indicator could be an early sign of improving market conditions.
Key Takeaway: The current data suggests that Bitcoin's bearish phase may not have reached the same extreme levels seen in previous cycles. However, a market recovery is not confirmed yet.
$BTC
#Bitcoin #CryptoMarket