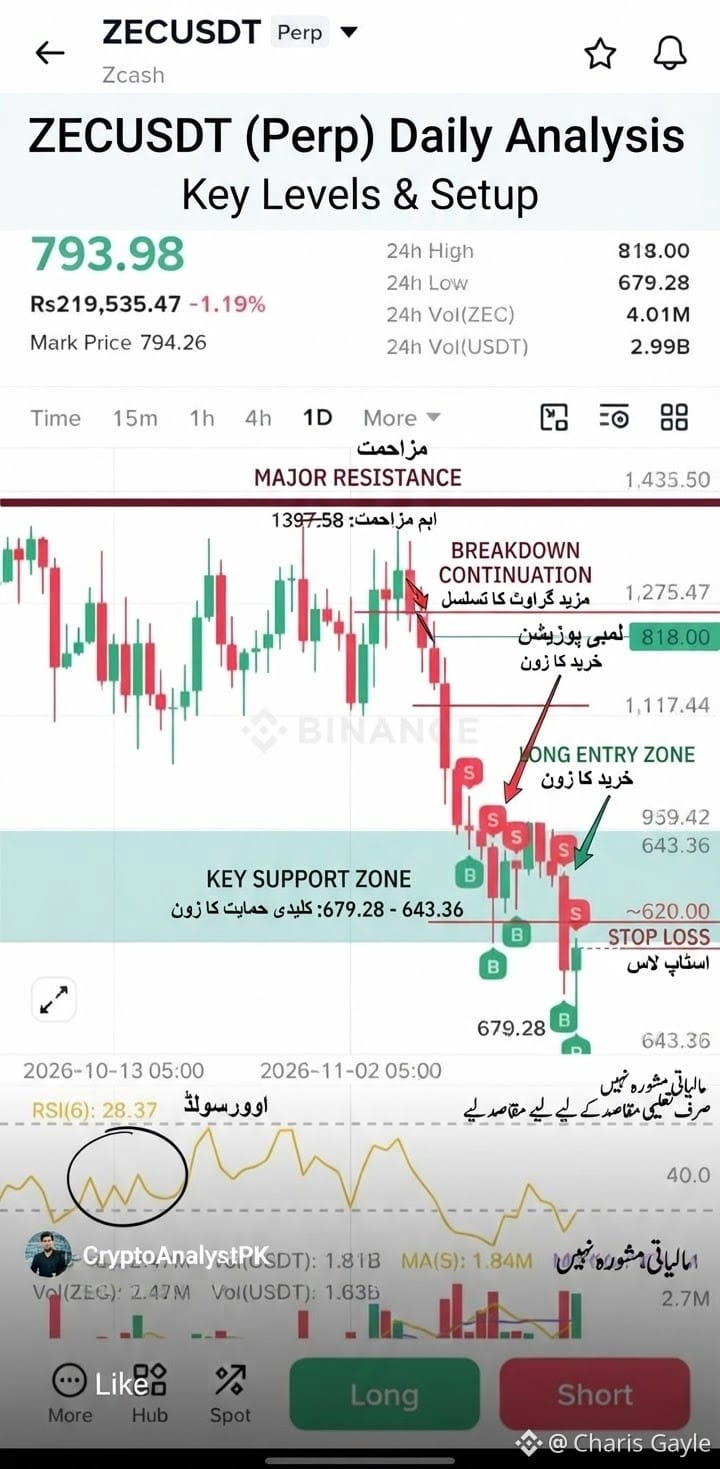
$ZEC USDT (Perp) — Daily Market Update & Key Levels
Current Price: ~793.98 USDT (-1.19%)
24h Range: 679.28 – 818.00 USDT
RSI(6): ~28.37 (Oversold territory on the daily timeframe)
📉 Chart Structure & Levels to Watch
Major Swing High / Resistance Zone: 1,397.58 USDT (prior major rejection)
Overhead Resistance Levels: ~959.42 USDT → ~1,117.44 USDT → ~1,275.47 USDT
Immediate / Local Support: ~679.28 USDT (24h / recent swing low)
Lower Support Zone: ~643.36 USDT
🎯 Trade Scenarios (Educational Levels)
Bounce / Relief Long Idea: Look for confirmation and bullish reaction near the 679.28 – 643.36 demand/support zone, especially while RSI(6) is stretched near oversold levels.
Potential Upside Targets: 818.00 → 959.42 USDT
Invalidation: Clean daily breakdown below 643.36 USDT
Trend / Breakdown Continuation: Since the higher-timeframe move shows heavy downward pressure from the 1,397.58 peak, any weak bounce into resistance zones without volume confirmation can face selling pressure.
⚠️ Risk Disclaimer: This is market analysis and level tracking for educational purposes only—not financial advice. Always manage position size, use a stop-loss, and do your own research (DYOR) before placing any trade.
💡 Tips to Help Binance Square Algorithm Push Your Post
1. Attach the chart image (IMG_20261121_194317.png) directly with clear visible levels.
2. Engage in the first 15–30 minutes after posting by replying to comments and asking a quick question (e.g., "Are you watching for a bounce from 679 or more downside?").
3. Use 3–5 relevant tags like #ZECUSDT #ZECUSDT #CryptoTradingInsights #TechnicalAnalysiss
Current Price: ~793.98 USDT (-1.19%)
24h Range: 679.28 – 818.00 USDT
RSI(6): ~28.37 (Oversold territory on the daily timeframe)
📉 Chart Structure & Levels to Watch
Major Swing High / Resistance Zone: 1,397.58 USDT (prior major rejection)
Overhead Resistance Levels: ~959.42 USDT → ~1,117.44 USDT → ~1,275.47 USDT
Immediate / Local Support: ~679.28 USDT (24h / recent swing low)
Lower Support Zone: ~643.36 USDT
🎯 Trade Scenarios (Educational Levels)
Bounce / Relief Long Idea: Look for confirmation and bullish reaction near the 679.28 – 643.36 demand/support zone, especially while RSI(6) is stretched near oversold levels.
Potential Upside Targets: 818.00 → 959.42 USDT
Invalidation: Clean daily breakdown below 643.36 USDT
Trend / Breakdown Continuation: Since the higher-timeframe move shows heavy downward pressure from the 1,397.58 peak, any weak bounce into resistance zones without volume confirmation can face selling pressure.
⚠️ Risk Disclaimer: This is market analysis and level tracking for educational purposes only—not financial advice. Always manage position size, use a stop-loss, and do your own research (DYOR) before placing any trade.
💡 Tips to Help Binance Square Algorithm Push Your Post
1. Attach the chart image (IMG_20261121_194317.png) directly with clear visible levels.
2. Engage in the first 15–30 minutes after posting by replying to comments and asking a quick question (e.g., "Are you watching for a bounce from 679 or more downside?").
3. Use 3–5 relevant tags like #ZECUSDT #ZECUSDT #CryptoTradingInsights #TechnicalAnalysiss