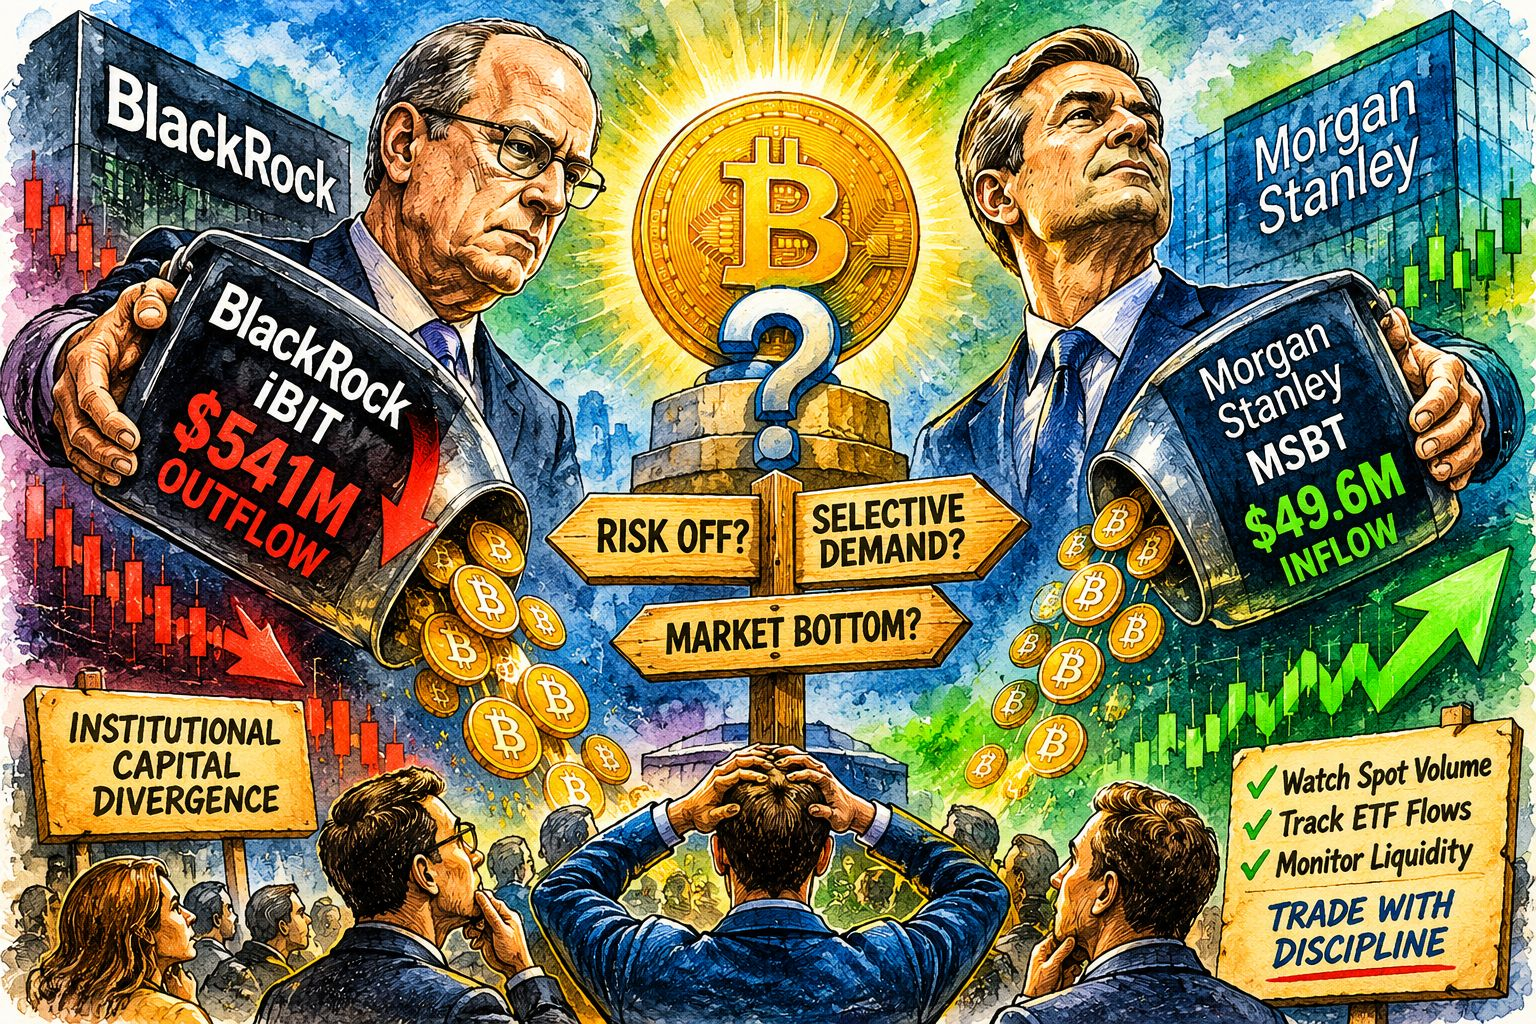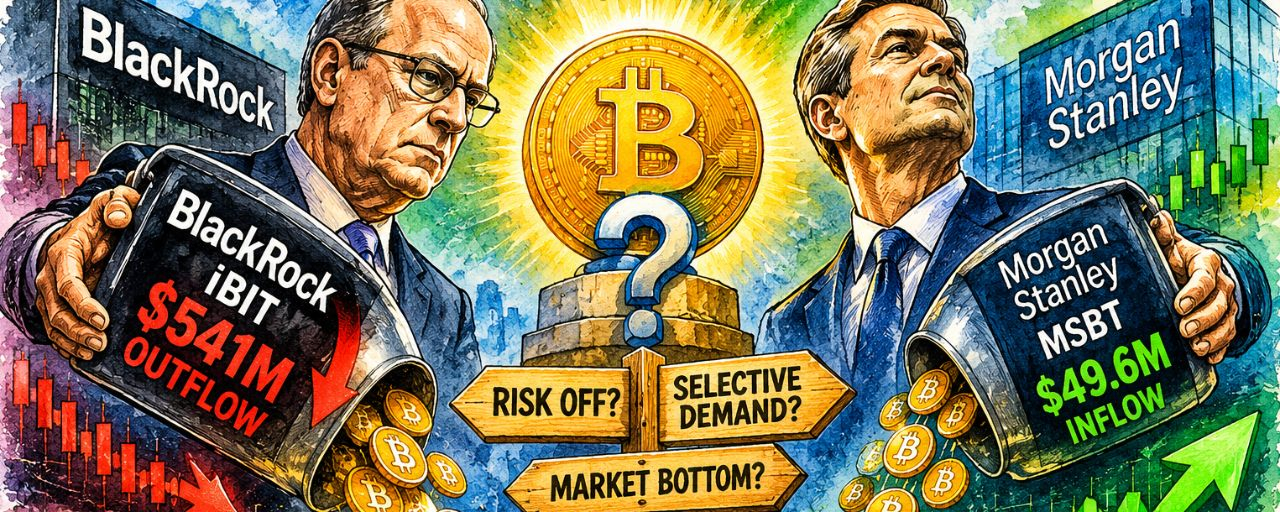

#BlackRockIBITPostsRecord$541MSingleDayOutflow
🚨INSTITUTIONAL CAPITAL DIVERGENCE: IS SMART MONEY EXITING BITCOIN OR BECOMING MORE SELECTIVE?🏦₿
November 19 delivered one of the most interesting institutional-flow developments in the Bitcoin market.
🔴 BlackRock's IBIT recorded a record single-day net outflow of $541.1 MILLION.
🟢 Morgan Stanley's MSBT attracted $49.6 MILLION in fresh capital on the same day.
But the bigger story becomes clearer when we connect ETF redemptions with Bitcoin's price structure, spot selling, derivatives positioning and liquidation liquidity.
Let's examine what the actual data is telling us. 👇
🔴 1. INSTITUTIONAL CAPITAL — WHAT DO THE ETF FLOWS REVEAL?
According to the November 19 ETF flow
💸 IBIT single-day outflow: -$541.1M.
🟢 MSBT single-day inflow: +$49.6M.
📉 Total US spot Bitcoin ETF net outflows: approximately -$582.2M.
⚠️ IBIT represented approximately 93% of total net withdrawals that session.
Looking at the broader flow trend:
🔴 IBIT past-month net flows: approximately -$3.1 BILLION.
🟢 MSBT past-month net flows: approximately +$119.4 MILLION.
💰 IBIT cumulative net inflows since launch: approximately +$63.4 BILLION.
💰 MSBT cumulative net inflows: approximately +$919.1 MILLION.
What does this tell us?
IBIT is experiencing substantial redemption pressure, while MSBT continues attracting selective demand.
However, MSBT's inflows are much smaller than IBIT's withdrawals.
This does NOT establish a direct transfer of capital from BlackRock to Morgan Stanley.
It demonstrates different investor-flow behaviour across Bitcoin investment products.
🧠 2. WHY IS MORGAN STANLEY ATTRACTING CAPITAL?
There are several structural reasons worth examining.
💰 Lower management fees
MSBT charges a 0.14% annual sponsor fee compared with IBIT's 0.25%.
This creates a potential cost advantage for investors evaluating long-term Bitcoin ETF exposure.
🏦 Wealth-management distribution
Morgan Stanley has an established financial-advisor network and traditional investment infrastructure.
Its ability to introduce Bitcoin exposure through familiar wealth-management channels may attract investors who prefer traditional financial institutions.
🌱 New product adoption
MSBT launched in April 2026.
Its inflows may partly reflect new product adoption and initial allocations rather than a sudden institutional rejection of IBIT.
⚖️ Different investment strategies
Some investors may be reducing overall exposure, while others are selectively allocating through products that better suit their investment preferences.
The important distinction:
Positive MSBT flows do not prove that IBIT investors are migrating into MSBT.
🌎 3. MACROECONOMIC PRESSURE — WHY IS BITCOIN FACING DIFFICULT CONDITIONS?
Bitcoin's weakness is occurring alongside broader financial-market uncertainty.
Three macroeconomic channels deserve attention:
🇺🇸 Rising borrowing costs and Treasury yields can increase the opportunity cost of holding non-yielding assets.
💵 Dollar strength can create additional pressure on risk-sensitive assets.
📉 Concerns surrounding elevated technology-stock valuations and AI-related investments have contributed to wider equity-market weakness.
These conditions can encourage institutional portfolio managers to reduce overall risk exposure.
However, they should be treated as contributing market pressures, not proven direct causes of the IBIT redemption.
📉 4. BITCOIN PRICE STRUCTURE — SELLING PRESSURE IS VISIBLE
Now let's connect institutional flows with actual market behaviour.
November 20's Binance BTCUSDT daily candle closed near $58,951.5 after falling approximately 4.9%.
On November 21, the market recorded an intraday low around $55,130 in the available daily data.
This is important because ETF withdrawals are occurring alongside significant price weakness.
The price structure deserves more attention than the headline alone.
Key short-term technical reference levels:
🔴 Resistance zone: $59,050–$59,800.
🟡 Intermediate reference: $58,950.
🟢 Nearby liquidity/bid reference: $56,600.
⚠️ November 21 intraday low: approximately $55,130.
A sustained recovery above resistance, supported by spot demand, would improve the short-term structure.
A confirmed daily close below the recent low would indicate further technical deterioration.
These are reference levels, not guaranteed support or resistance.
🐋 5. BINANCE SPOT VS FUTURES — WHO IS ACTUALLY SELLING?
This is where the market becomes more interesting.
November 21 order-flow snapshots show:
🔴 One-day Binance-related spot taker flow: approximately -$452.19M.
🔴 One-day futures taker flow: approximately -$935.15M.
Both spot and futures displayed aggressive net selling in the available one-day readings.
But there is an important intraday divergence:
🟢 One-hour futures flow was approximately +$8.03M.
🔴 One-hour spot flow remained approximately -$14.33M.
The four-hour snapshot also showed positive futures flow while spot flow remained negative.
Interpretation:
Short-term futures buying is not automatically genuine spot accumulation.
If derivatives buying increases while spot sellers remain aggressive, a recovery may lack strong underlying spot-market confirmation.
We need sustained spot buying before treating a futures-led bounce as a stronger reversal signal.
🔥 6. OPEN INTEREST & LIQUIDATION HEATMAP — WHERE IS THE LEVERAGE RISK?
The November 21 liquidation snapshot provides another important clue.
Estimated liquidation activity over the preceding 24 hours:
🔴 Long liquidations: approximately $255.0M.
🟢 Short liquidations: approximately $15.3M.
📉 Open interest change: approximately -1.1% in contracts over 24 hours, according to the heatmap provider.
This combination suggests substantial long-side liquidation alongside some reduction in outstanding leverage.
It is more consistent with a deleveraging event than a straightforward conclusion that new shorts are dominating the entire market.
Estimated liquidation concentrations:
🔥 Around $57,029: nearby long-liquidation cluster.
🟢 Around $56,603: notable visible bid wall.
🔴 Around $59,058: overhead sell-order concentration.
🔴 Around $59,800: another significant ask wall.
The heatmap also estimated approximately $552M in potential long liquidations within 3% below the reference price, versus approximately $6.7M in short liquidations within 3% above it.
These are model-based estimates, not guaranteed executions or confirmed future price targets.
⚖️ 7. THREE MARKET SCENARIOS — WHAT HAPPENS NEXT?
🔴 BEARISH CONTINUATION
If ETF outflows persist, spot selling remains aggressive and BTC breaks below the recent $55,130 low, downside risk could increase.
Further long liquidations may amplify selling pressure.
🟢 BULLISH RECOVERY
If ETF withdrawals slow, spot CVD turns positive, buyers absorb supply and BTC reclaims the $59,050–$59,800 area, market structure could begin improving.
A reduction in open interest alongside price recovery may indicate that excessive leverage is being cleared.
🟡 CONSOLIDATION
If ETF flows remain mixed, spot demand stabilizes and price holds above the recent lows without reclaiming resistance, Bitcoin may enter a period of consolidation.
In this situation, patience and confirmation matter more than predicting the next move.
🎯 FINAL VERDICT — FOLLOW THE EVIDENCE, NOT THE EMOTION!
The $541.1M IBIT outflow is significant, but the complete market picture is more complicated.
🔴 BlackRock is experiencing substantial redemptions.
🟢 Morgan Stanley is attracting selective capital.
📉 Bitcoin's price structure is weak.
🔥 Long-side liquidations are dominating the available liquidation snapshot.
⚠️ Spot and futures order flow both show selling pressure over the broader one-day window.
The strongest conclusion is that Bitcoin is experiencing institutional-flow divergence alongside a significant market deleveraging event.
But we still need subsequent ETF flows, renewed spot demand and price confirmation to determine whether this weakness is temporary or part of a more persistent decline.
THE BIG QUESTION FOR THE MARKET:
Are institutions abandoning Bitcoin, or are investors simply becoming more selective about their exposure while leveraged traders are being forced out?
One record outflow does not confirm a breakdown.
One positive ETF inflow does not confirm accumulation.
And one liquidation event does not establish a market bottom.
📊 Follow the capital flows.
🐋 Track the liquidity.
🧠 Understand institutional psychology.
⚖️ Let price action confirm the narrative.
Trade the evidence, not the fear.
DYOR | Risk Management | Market Discipline.