
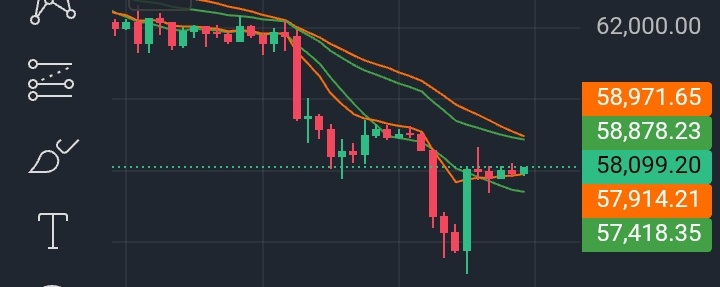


Bitcoin has lost the $60,000 psychological threshold for the first time since June, sliding into a broader macro-driven selloff rather than an isolated crypto liquidation event. On the 1-hour Binance chart, BTC/USDT is stabilizing near $58,099.20 following a sharp intraday sweep down to $55,130.00, while moving averages continue to slope downward overhead. Because Open Interest, funding rates, and liquidation breakdowns are not provided in the current data, this move must be evaluated primarily through spot outflows, macro correlations, and key technical levels.
Market & Price Context
Current Spot Price: $58,099.20 on Binance -5.99% over 24 hours, stabilizing slightly after a sharp breakdown from the $62,000 area. The accompanying CoinMarketCap report captured BTC slightly earlier at $58,503, noting losses of roughly 6% over 24 hours, 15% over 7 days, and 31% over 30 days).
24-Hour Range & Drawdown: Binance spot traded between a 24h high of $62,179.45 and a 24h low of $55,130.00. The CoinMarketCap report notes that an earlier session drop to $57,950 came within roughly $200 of its prior 2026 low $57,748 on July 1 and puts BTC in a 54% drawdown from its October 2025 alltime high of $126,198.
Spot Volume & Market Cap: Binance 24h spot volume stands at 60,769.74 BTC $3.54B USDT Total crypto market capitalization shed roughly 6% to $2.01 trillion, down about one-third over the past 30 days.
Technical & Order Book Structure: On the 1h chart, price remains trapped below key short-term moving averages (EMA/MA 9 and 26), with immediate dynamic resistance clustered at $58,878.23 and $58,971.65. Lower support lines appear near $57,914.21 and $57,418.35, while the visible order book ratio tilts heavily toward sellers at 71.61% ask vs. 28.39% bid.
Derivatives & Positioning
Specific derivatives metrics—including Open Interest (OI) changes, futures-to-spot volume ratios, funding rates, and long/short liquidation figures—are not provided in the supplied screenshot or text. Without those figures, it is not possible to confirm whether the wick to $55,130.00 cleared excess leverage or if crowded positioning remains in the market.
Supply & Tokenomics
Circulating supply, maximum supply, and issuance metrics are not detailed in the provided data. However, on-chain context cited in the report indicates Bitcoin's realized price currently sits below $54,000, with an on-chain risk reading at 0.167 compared to sub-0.1 levels seen at prior cycle bottoms.
Fundamentals, Catalysts & Risks
Cross-Asset Macro Selling: Rather than crypto-specific news, the drop coincides with broad risk-off pressure across traditional markets. Gold fell roughly 4% to around $3,515/oz (down ~15% in a month), the Nasdaq Composite dropped 3.5% (down 10.6% over 21 sessions), and the S&P 500 fell 2.8% alongside a 19-month high in the US dollar.
AI Unwind & Rate Expectations: CoinShares head of research James Butterfill attributed Bitcoin's decline largely to an unwind in artificial intelligence stocks compounded by interest rate pressures. Polymarket traders are pricing a 93% probability of another Federal Reserve rate hike by the December 9 decision.
Spot ETF Outflows: Institutional spot demand has turned into net selling, with US spot Bitcoin ETFs recording $582.2 million in outflows on November 19—led by $541 million exiting BlackRock's IBIT—bringing three-day cumulative outflows to $1.13 billion following $306.4 million and $239.9 million in prior sessions
BTC/USDT Price : $58,099.20 -5.99% 24h
24h High / Low: $62,179.45 / $55,130.00
24h Spot Volume: 60,769.74 BTC / $3.54B USDT
1h Chart Levels: Resistance at $58,878.23 & $58,971.65; Support at $57,914.21 & $57,418.35
Order Book Split: 28.39% Buy / 71.61% Sell
Multi-Timeframe Performance: -15% 7d -31% 30d-54% from $126,198 ATH Oct. 2025
US Spot BTC ETF Flows: -$582.2M Nov. 19; -$1.13B over 3 sessions
Total Crypto Market Cap: $2.01 trillion -6% 24h
On-Chain Reference: Realized price under $54,000; risk metric at 0.167
Conditional Scenarios
Bullish Confirmation: Bulls would need to defend the $57,418–$57,914 support band on the 1h timeframe, reclaim the 9 and 26 moving averages at $58,878–$58,971, and re-establish acceptance above the $60,000 psychological level. A durable recovery would also require US spot ETF outflows to subside and broader equity/AI selling to stabilize before retesting the $62,179.45 24h high.
Bearish Confirmation: Failure to hold $57,418.35 on a closing basis especially if accompanied by continued heavy ask-side order book pressure and persistent ETF outflows—would expose the $55,130.00 intraday wick low. A clean break below $55,130.00 would put the sub-$54,000 realized price zone directly in focus.
My View : bounce off $55,130.00 to $58,099.20 looks like an initial technical pause after an aggressive breakdown rather than a confirmed trend reversal. With traditional hedges like gold selling off alongside tech equities, a strong dollar, 93% odds priced for a December Fed hike, and over $1.13 billion in three-day spot ETF outflows, macro headwinds remain firmly in control. Until BTC reclaims $60,000 and moving average resistance overhead while institutional outflows cool, upside bounces remain vulnerable to renewed selling pressure🤔