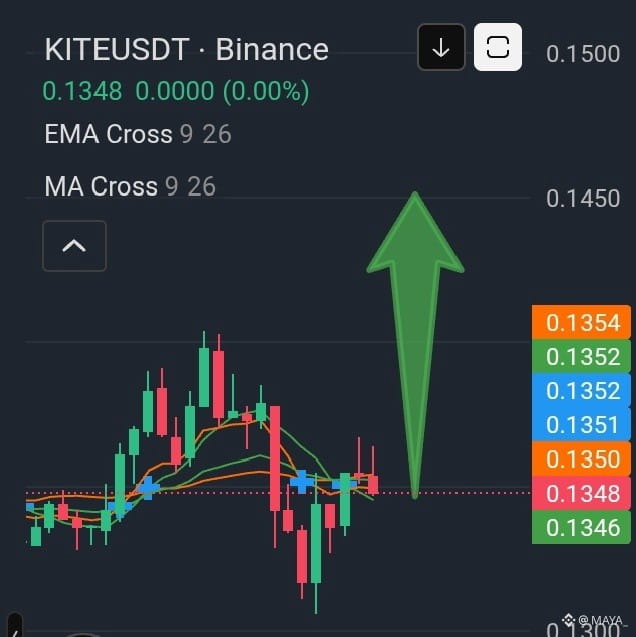

$KITE pushed up to a visible swing high just above 0.1400 matching the 24h high of 0.1404 before sellers stepped in and dragged it down to a swing low just above 0.1300, right next to the 24h low of 0.1306. Right now price is hovering at 0.1348, up 0.75% on the day with 24h volume at 15.89M KITE or 2.15M USDT. After that drop toward 0.1306, we have seen a bounce back into the mid-range, so short-term momentum is trying to stabilize rather than trending cleanly in either direction yet.
on this chart, I see moving average crossover lines plotted under EMA Cross 9 26 and MA Cross 9 26, and price is currently weaving right around those short-term moving averages after dipping below them during the pullback. Below the chart, the order book shows 59.07% on the buy side versus 40.93% on the sell side. There is no RSI, MACD, volume histogram, or Fibonacci tool visible here, so I am reading straight off candle structure, those moving average lines, and the round levels around 0.1300, 0.1450, and 0.1500
My Entry Strategy: I am treating this as a planned setup, not an active position. If price holds above the 0.1346–0.1348 area and prints a clean bullish candle or rejection wick off the short moving averages, I will look for a long entry rather than chasing green candles.
My DCA Strategy: A secondary scale-in only makes sense to me near the 0.1306–0.1310 support zone if price dips back there and shows buyers stepping in again.
My Stop Loss: A break and close below the 0.1300–0.1306 swing low area invalidates the bounce idea.
My Risk Management: I keep position size modest and protect capital first, risking around 1% to 2% of acount equity on a planned trade not a claim of any live position and only taking setups where the upside room justifies the risk.
if momentum builds upward, possible upside areas to watch are....
TP1 around 0.1404 near the 24h high
TP2 around 0.1450 where the chart arrow points
TP3 near 0.1500.
I am not chasing the market and I will wait for confirmation. I am watching this level closely🤔
@KITE AI 中文
on this chart, I see moving average crossover lines plotted under EMA Cross 9 26 and MA Cross 9 26, and price is currently weaving right around those short-term moving averages after dipping below them during the pullback. Below the chart, the order book shows 59.07% on the buy side versus 40.93% on the sell side. There is no RSI, MACD, volume histogram, or Fibonacci tool visible here, so I am reading straight off candle structure, those moving average lines, and the round levels around 0.1300, 0.1450, and 0.1500
My Entry Strategy: I am treating this as a planned setup, not an active position. If price holds above the 0.1346–0.1348 area and prints a clean bullish candle or rejection wick off the short moving averages, I will look for a long entry rather than chasing green candles.
My DCA Strategy: A secondary scale-in only makes sense to me near the 0.1306–0.1310 support zone if price dips back there and shows buyers stepping in again.
My Stop Loss: A break and close below the 0.1300–0.1306 swing low area invalidates the bounce idea.
My Risk Management: I keep position size modest and protect capital first, risking around 1% to 2% of acount equity on a planned trade not a claim of any live position and only taking setups where the upside room justifies the risk.
if momentum builds upward, possible upside areas to watch are....
TP1 around 0.1404 near the 24h high
TP2 around 0.1450 where the chart arrow points
TP3 near 0.1500.
I am not chasing the market and I will wait for confirmation. I am watching this level closely🤔
@KITE AI 中文