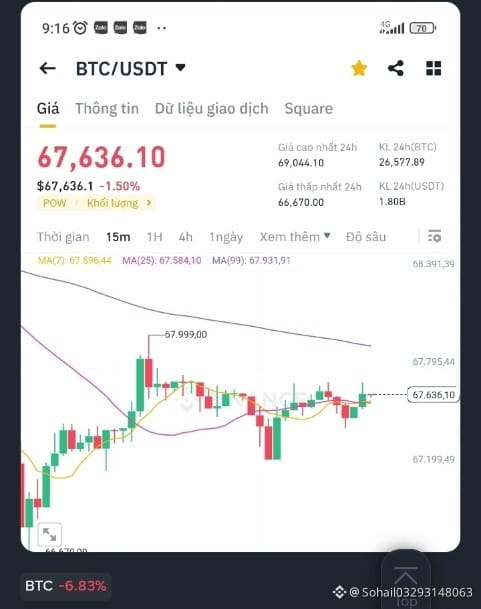
$BTC
Here is the current #BTCUSDT market analysis and trade outlook based on the latest price action near $58,100–$59,300:
$64,000 ── ── ── ── ── ── [Major Resistance / Invalidation]
$61,750 ── ── ── ── ── ── [20-EMA / First Upside Target]
$58,500 ── ── \ ── ── ── [Current Price Zone (~$58.1k–$59.3k)]
$56,000 ── ── ── \ ── ── [Immediate Downside Target 1]
$52,000 ── ── ── ── \ ── [Extended Bearish Target 2]
1. Trend & Momentum: BTC/USDT remains in a strong bearish downtrend across daily and intraday timeframes after breaking below key psychological support at $60,000.
2. Indicators: Technical indicators on Investing.com signal a "Strong Sell," with price trading well below its 20-period and 50-period moving averages alongside a daily death cross.
3. Oversold Conditions: The Relative Strength Index (RSI) is hovering in oversold territory (below 30), suggesting a brief relief bounce is possible before further downside.
4. Bearish Targets: As long as sellers defend resistance, downside targets sit at $56,000 followed by $52,000 if selling pressure from spot ETF outflows continues.
5. Bullish Targets: A recovery above $61,750 is required to trigger a short-term rebound toward $64,000, which acts as the key bearish invalidation zone.
#BNBDropsBelow540USDTWith8.46%DailyDecline #TwentyOneCapitalAdds172.25BTC
#CanBTCReboundAfterFallingBelow60K?
#AnthropicPlungesTowardIPOPriceonDay2
Here is the current #BTCUSDT market analysis and trade outlook based on the latest price action near $58,100–$59,300:
$64,000 ── ── ── ── ── ── [Major Resistance / Invalidation]
$61,750 ── ── ── ── ── ── [20-EMA / First Upside Target]
$58,500 ── ── \ ── ── ── [Current Price Zone (~$58.1k–$59.3k)]
$56,000 ── ── ── \ ── ── [Immediate Downside Target 1]
$52,000 ── ── ── ── \ ── [Extended Bearish Target 2]
1. Trend & Momentum: BTC/USDT remains in a strong bearish downtrend across daily and intraday timeframes after breaking below key psychological support at $60,000.
2. Indicators: Technical indicators on Investing.com signal a "Strong Sell," with price trading well below its 20-period and 50-period moving averages alongside a daily death cross.
3. Oversold Conditions: The Relative Strength Index (RSI) is hovering in oversold territory (below 30), suggesting a brief relief bounce is possible before further downside.
4. Bearish Targets: As long as sellers defend resistance, downside targets sit at $56,000 followed by $52,000 if selling pressure from spot ETF outflows continues.
5. Bullish Targets: A recovery above $61,750 is required to trigger a short-term rebound toward $64,000, which acts as the key bearish invalidation zone.
#BNBDropsBelow540USDTWith8.46%DailyDecline #TwentyOneCapitalAdds172.25BTC
#CanBTCReboundAfterFallingBelow60K?
#AnthropicPlungesTowardIPOPriceonDay2