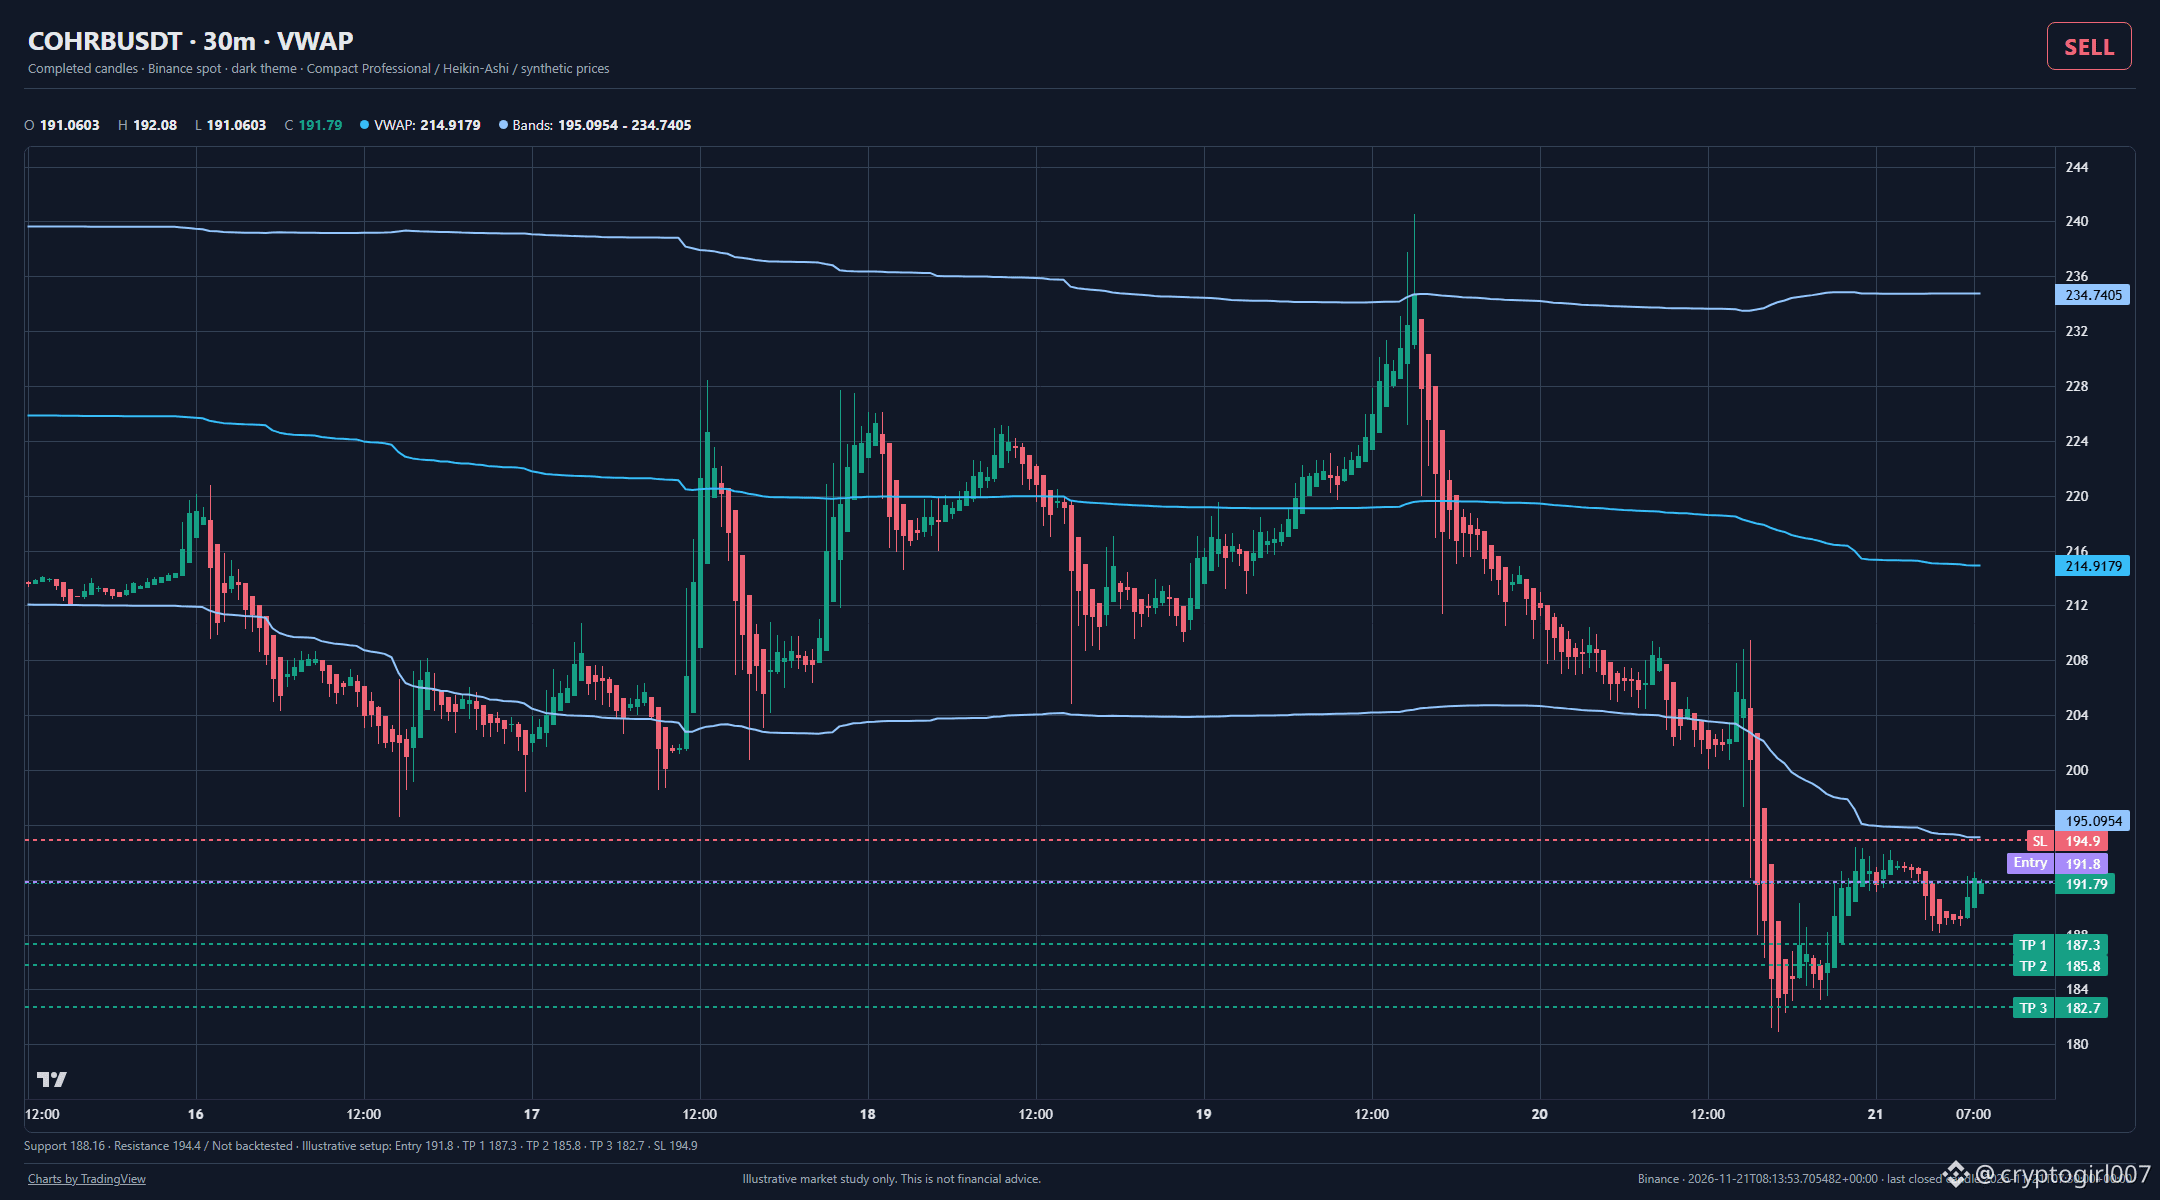
The VWAP supports the bearish reading on the thirty-minute chart, reinforcing the Sell signal for this illustrative market study.
$COHRB
is showing a bearish setup on the thirty-minute chart.
VWAP supports the bearish reading. This supports the Sell signal. The last closed candle was around 191.8 USDT. Support sits near 188.2, with resistance around 194.4.
SELL · illustrative short setup (USDT)
Entry ≈ 191.8
TP1 ≈ 187.3
TP2 ≈ 185.8
TP3 ≈ 182.7
SL ≈ 194.9
Closed-candle analysis, not a live quote or trade instruction; not backtested.
#MarketStructure #ChartAnalysis
Illustrative market study only. This is not financial advice.
$COHRB
is showing a bearish setup on the thirty-minute chart.
VWAP supports the bearish reading. This supports the Sell signal. The last closed candle was around 191.8 USDT. Support sits near 188.2, with resistance around 194.4.
SELL · illustrative short setup (USDT)
Entry ≈ 191.8
TP1 ≈ 187.3
TP2 ≈ 185.8
TP3 ≈ 182.7
SL ≈ 194.9
Closed-candle analysis, not a live quote or trade instruction; not backtested.
#MarketStructure #ChartAnalysis
Illustrative market study only. This is not financial advice.