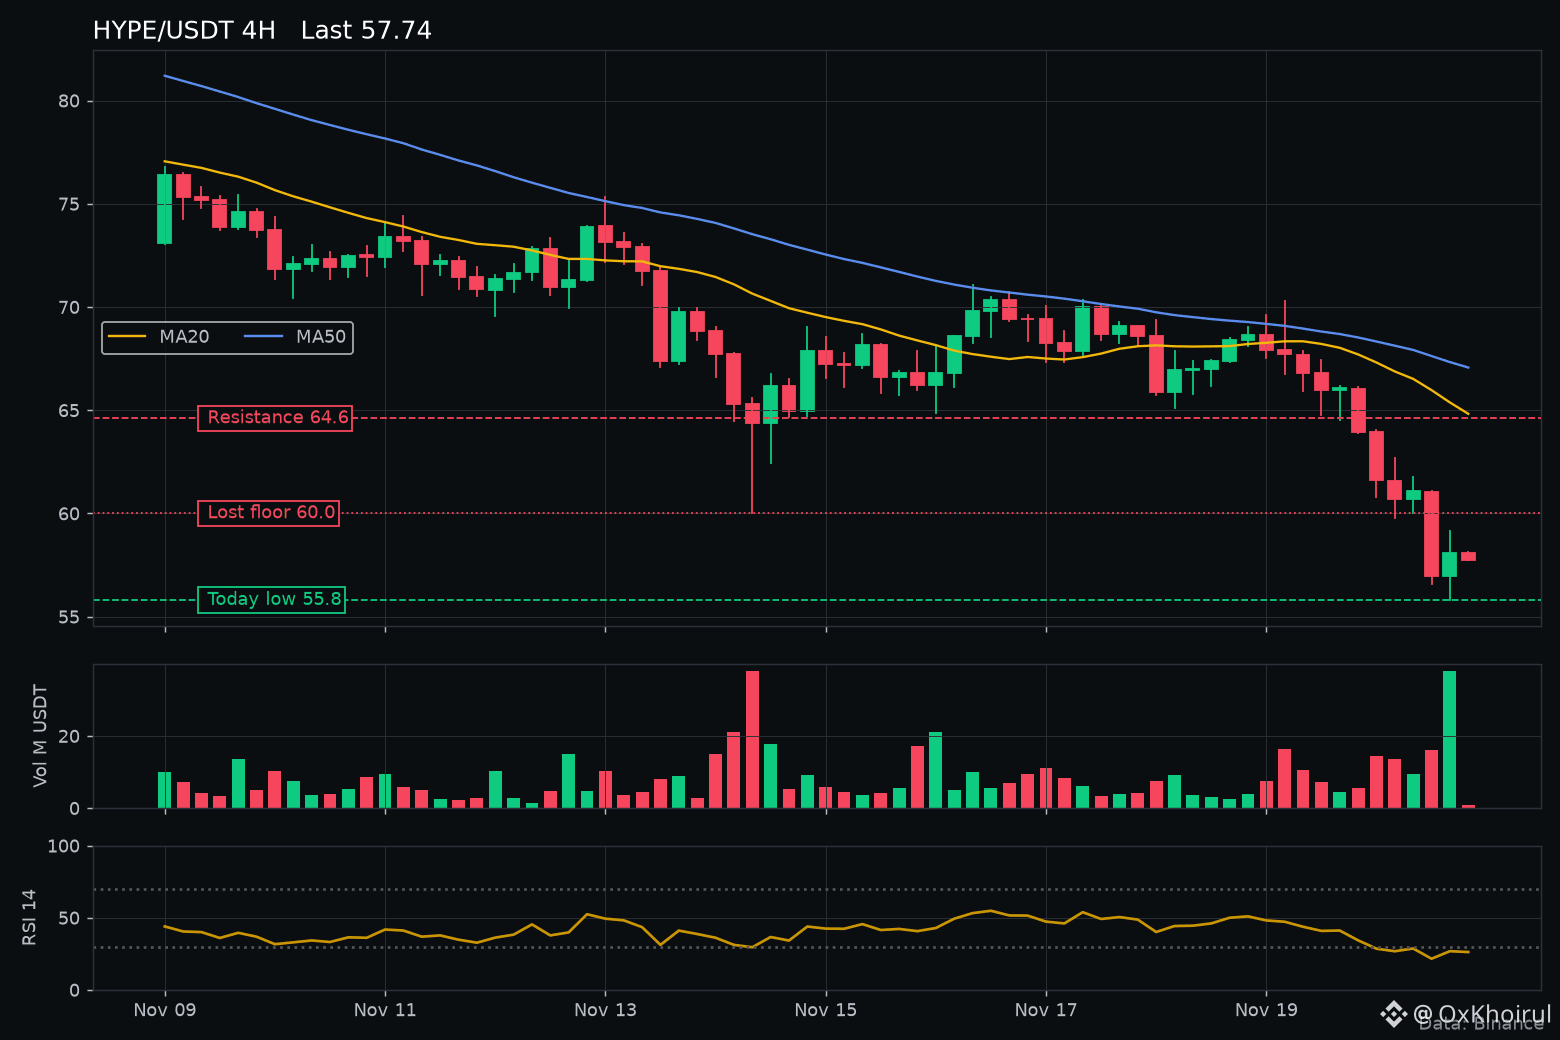
$HYPE just tagged 55.80 on Binance spot, the lowest print on my 4H chart for this whole stretch. Trading around 57.8 now, down about 12% in 24h while $BTC is off roughly 6.8% near 57.7K.
Why everyone's talking about it: Hong Kong's SFC added Hyperliquid to its suspicious platforms list on Nov 18 for operating without a license. That's a warning, not a ban, but it landed right as the whole market rolled over. On top of that, a big whale long on Hyperliquid was sitting near these levels, so the liquidation chatter on X got loud fast.
What the 4H chart shows:
Clean downtrend. Price is under both moving averages, MA20 around 64.8 and MA50 around 67.1, and both are still pointing down.
The 60 area held as a floor for days and also caught the Nov 14 wick. It broke this morning and the first bounce stalled under 59.
The 11:00 WIB candle did about 38M USDT in volume. Average for this window is closer to 8.5M, so that's roughly 4 to 5 times normal. It closed green with a long lower wick, which tells me someone was absorbing the selling at 55.8.
RSI 14 dipped to about 21 and is sitting near 26. Deep oversold, the lowest reading in this window.
Scenarios:
If 55.8 holds and price can get back above 60, that flips the old floor back into support and opens a relief move toward the 64.6 zone where MA20 is sitting.
If 55.8 breaks, there's no real structure on this chart below it, and oversold can stay oversold longer than people think, especially if BTC keeps sliding.
Not financial advice, DYOR.
Was that volume spike capitulation or just the first wave? How are you reading HYPE here?
#Hyperliquid #CryptoAnalysis #MarketPullback
Why everyone's talking about it: Hong Kong's SFC added Hyperliquid to its suspicious platforms list on Nov 18 for operating without a license. That's a warning, not a ban, but it landed right as the whole market rolled over. On top of that, a big whale long on Hyperliquid was sitting near these levels, so the liquidation chatter on X got loud fast.
What the 4H chart shows:
Clean downtrend. Price is under both moving averages, MA20 around 64.8 and MA50 around 67.1, and both are still pointing down.
The 60 area held as a floor for days and also caught the Nov 14 wick. It broke this morning and the first bounce stalled under 59.
The 11:00 WIB candle did about 38M USDT in volume. Average for this window is closer to 8.5M, so that's roughly 4 to 5 times normal. It closed green with a long lower wick, which tells me someone was absorbing the selling at 55.8.
RSI 14 dipped to about 21 and is sitting near 26. Deep oversold, the lowest reading in this window.
Scenarios:
If 55.8 holds and price can get back above 60, that flips the old floor back into support and opens a relief move toward the 64.6 zone where MA20 is sitting.
If 55.8 breaks, there's no real structure on this chart below it, and oversold can stay oversold longer than people think, especially if BTC keeps sliding.
Not financial advice, DYOR.
Was that volume spike capitulation or just the first wave? How are you reading HYPE here?
#Hyperliquid #CryptoAnalysis #MarketPullback