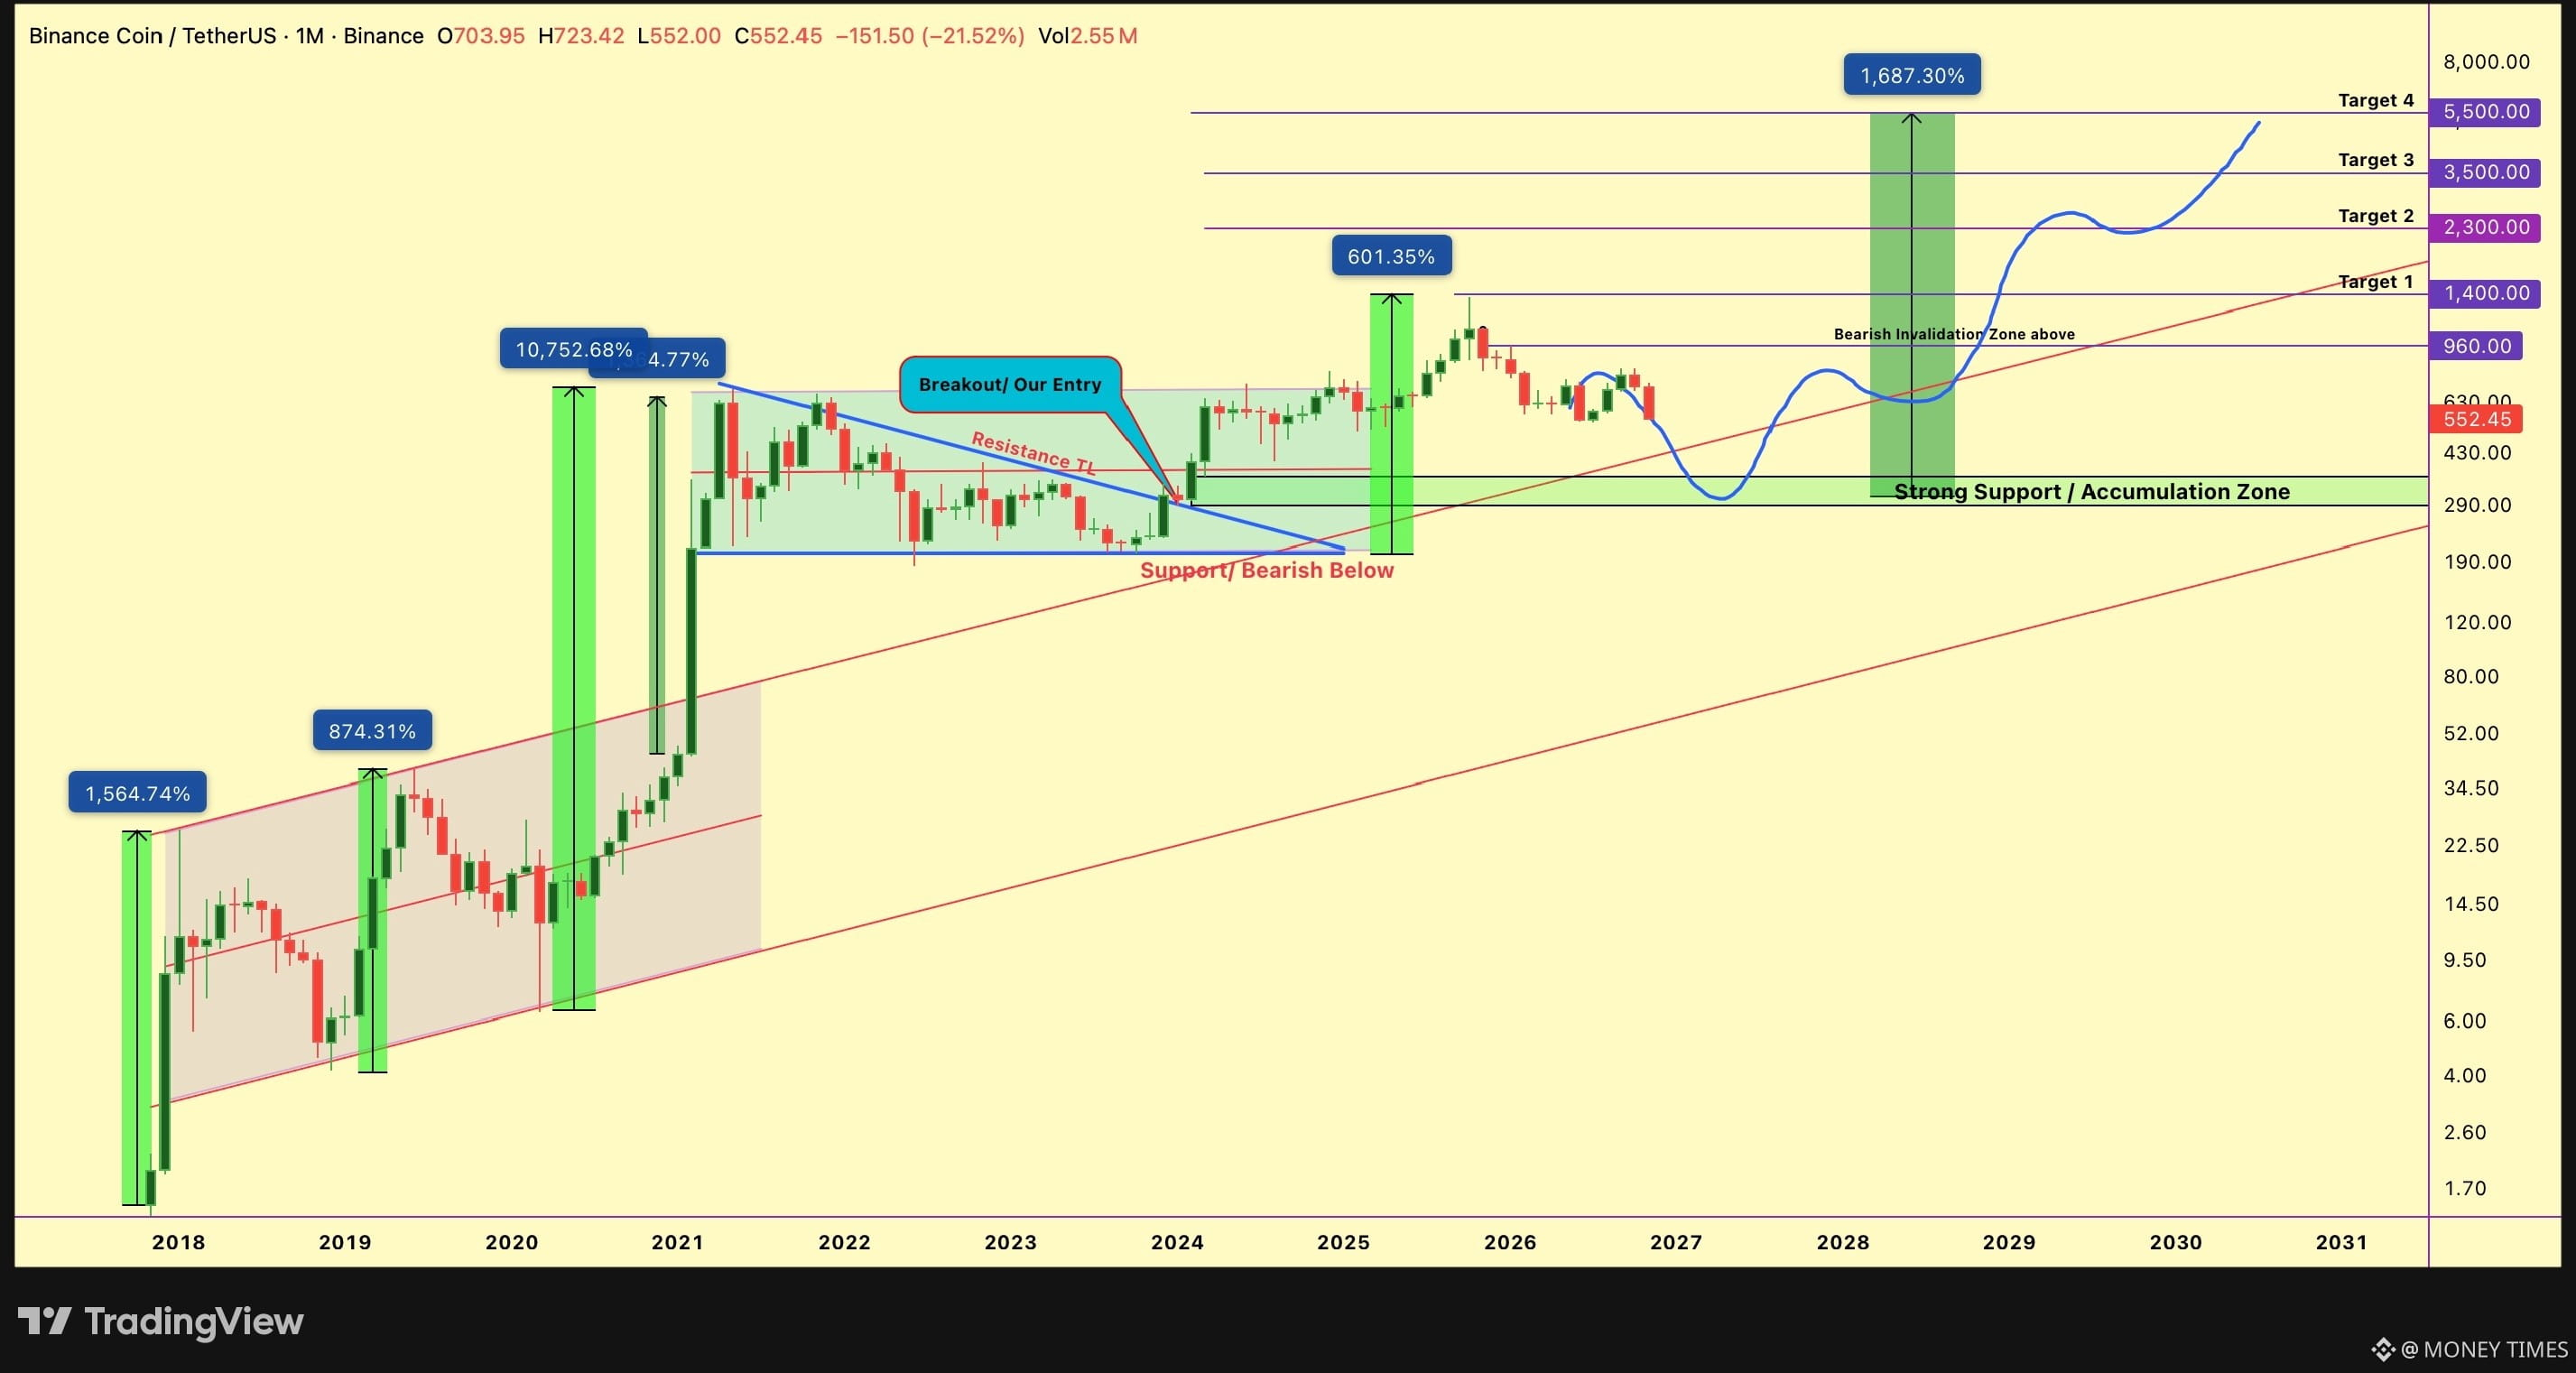
🚀 Can $BNB Really Rise From $350 to $5,500? A Long-Term Macro Outlook
While most traders are focused on short-term corrections, BNB's bigger market structure deserves attention.
Here are the key levels to watch:
🔹 $356–$287: Major higher-timeframe accumulation zone.
🔹 $960: Key structural resistance and potential bullish trend confirmation.
🔹 $1,400: First major macro target.
🔹 $2,300–$3,500: Potential higher expansion zone.
🔹 $5,500: Long-term bullish macro projection.
BNB/USDT has spent years developing a broader ascending structure. If the accumulation zone holds, it could provide a foundation for another significant upward move.
📊 The Bigger Picture:
Short-term price movements don't always reflect the bigger market cycle. Long-term structure, key support zones, and market confirmation matter more than temporary volatility.
Keep an eye on the levels. The next major move could be worth watching.
⚠️ NFA. Always DYOR.
$BNB
#CanBTCReboundAfterFallingBelow60K? #GlobalStocksFaceLongestLosingStreakSince2023
While most traders are focused on short-term corrections, BNB's bigger market structure deserves attention.
Here are the key levels to watch:
🔹 $356–$287: Major higher-timeframe accumulation zone.
🔹 $960: Key structural resistance and potential bullish trend confirmation.
🔹 $1,400: First major macro target.
🔹 $2,300–$3,500: Potential higher expansion zone.
🔹 $5,500: Long-term bullish macro projection.
BNB/USDT has spent years developing a broader ascending structure. If the accumulation zone holds, it could provide a foundation for another significant upward move.
📊 The Bigger Picture:
Short-term price movements don't always reflect the bigger market cycle. Long-term structure, key support zones, and market confirmation matter more than temporary volatility.
Keep an eye on the levels. The next major move could be worth watching.
⚠️ NFA. Always DYOR.
$BNB
#CanBTCReboundAfterFallingBelow60K? #GlobalStocksFaceLongestLosingStreakSince2023