🚨 BITCOIN CRASHES TO $56K! IS $50,000 THE NEXT TARGET?
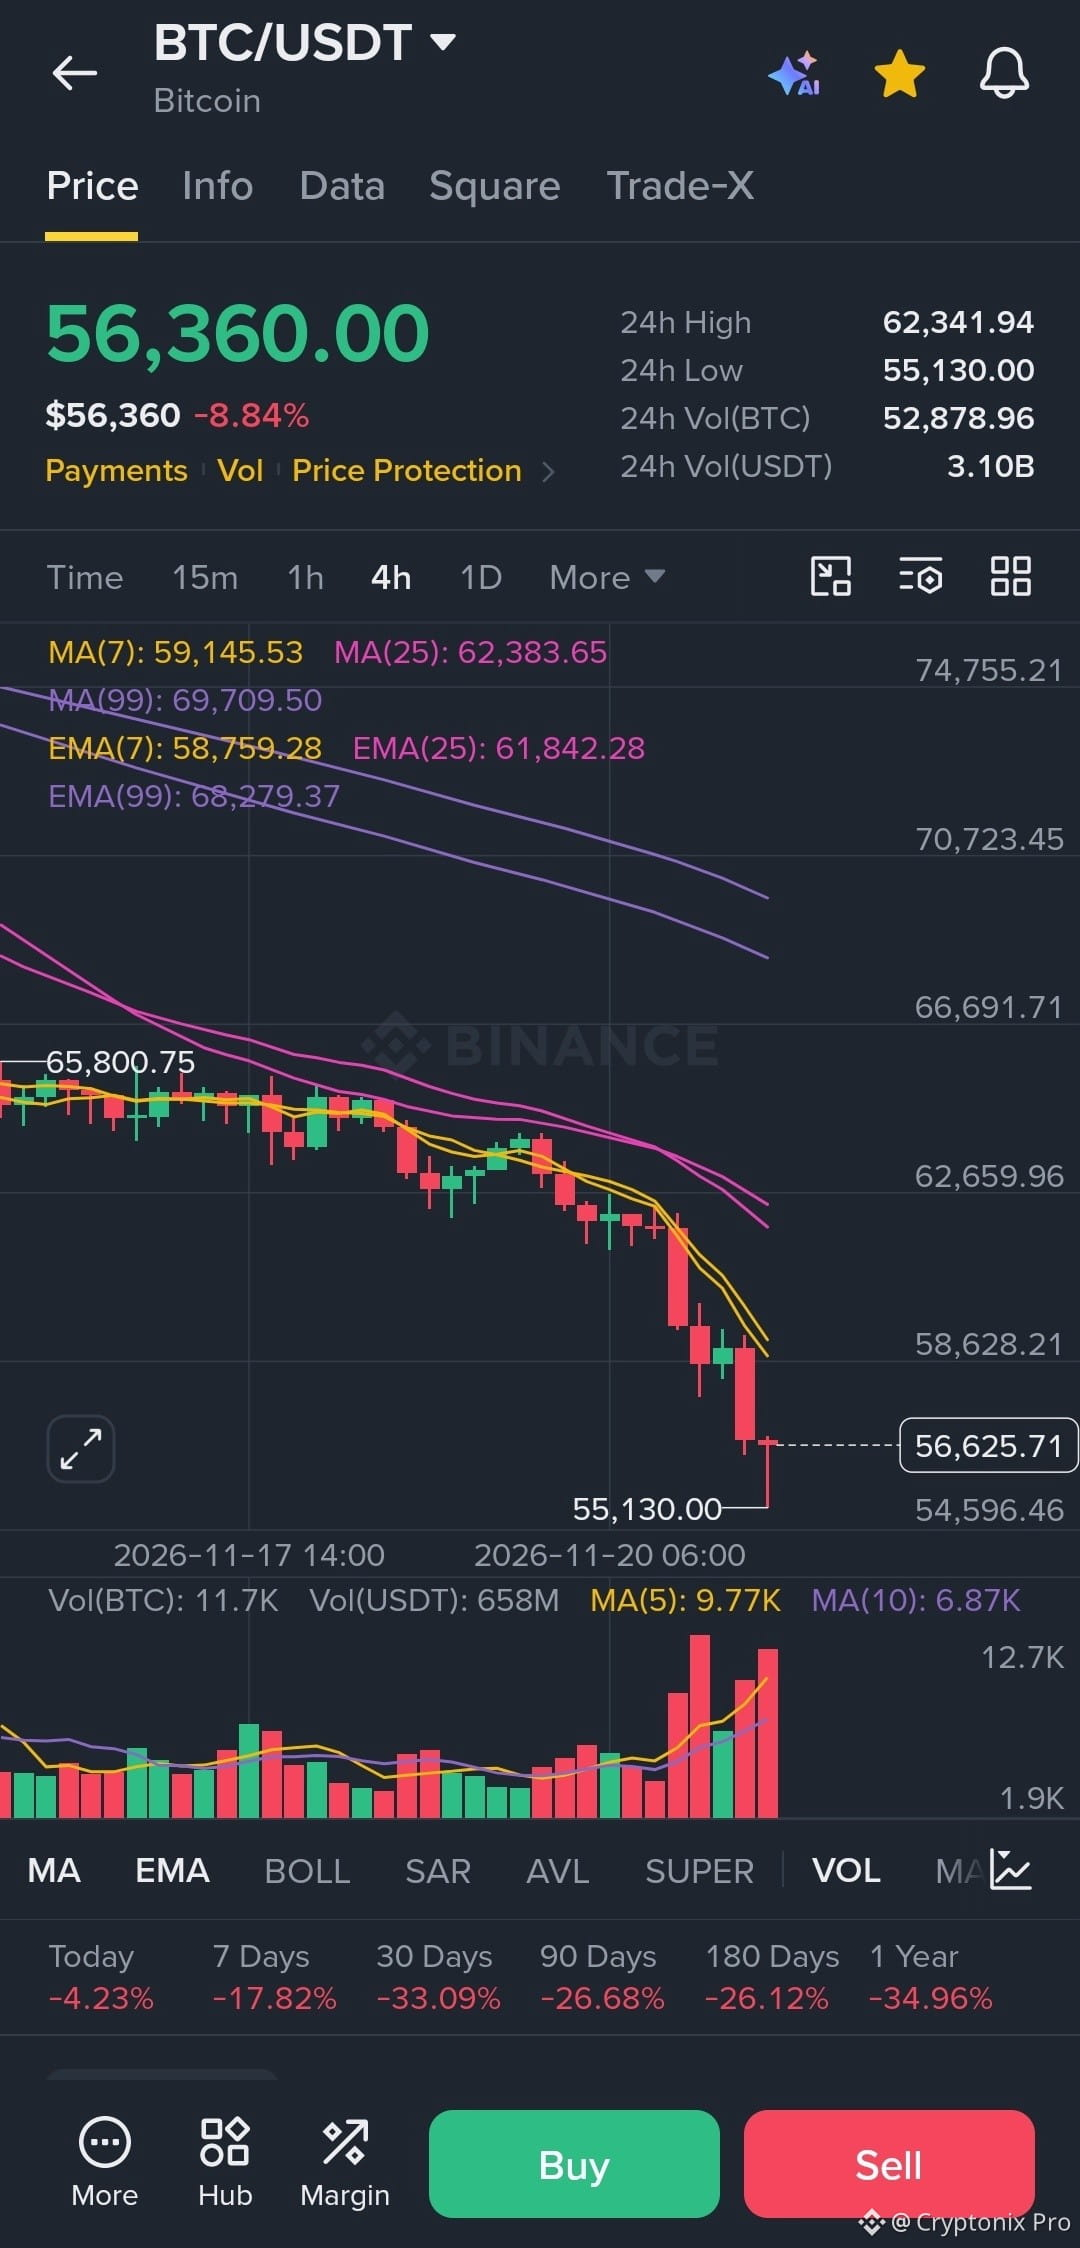
Bitcoin has dropped nearly 9% in 24 hours, while the 4-hour chart shows a clear bearish structure.
📉 What the Binance chart reveals:
Current price: $56,360
24-hour decline: 8.84%
24-hour low: $55,130
7-day decline: 18.26%
30-day decline: 33.45%
🔍 Key Technical Levels
Support:
$55,130 — immediate support.
$50,000 — psychological level and potential downside area if selling pressure continues.
Resistance:
$58,600–$59,100 — first recovery zone.
$61,800–$62,400 — stronger resistance zone.
⚠️ What Makes This Situation Dangerous?
Bitcoin is trading below its MA(7), MA(25), and MA(99).
Meanwhile, selling volume has increased significantly.
This suggests that sellers currently have the upper hand.
🔥 My Market Outlook
If BTC loses the $55,130 support, further downside pressure could develop.
However, a recovery above $59,100 would be an early positive signal.
The $50K level is a possible downside scenario, NOT a confirmed price target.
One Question for the Community:
Are we witnessing a temporary correction, or could Bitcoin be preparing for another major leg down?
Share your analysis below!
#Bitcoin #BTC #CryptoMarket #BTCUSDT #TechnicalAnalysis #CryptoNews #CryptonixPro
$BTC
Bitcoin has dropped nearly 9% in 24 hours, while the 4-hour chart shows a clear bearish structure.
📉 What the Binance chart reveals:
Current price: $56,360
24-hour decline: 8.84%
24-hour low: $55,130
7-day decline: 18.26%
30-day decline: 33.45%
🔍 Key Technical Levels
Support:
$55,130 — immediate support.
$50,000 — psychological level and potential downside area if selling pressure continues.
Resistance:
$58,600–$59,100 — first recovery zone.
$61,800–$62,400 — stronger resistance zone.
⚠️ What Makes This Situation Dangerous?
Bitcoin is trading below its MA(7), MA(25), and MA(99).
Meanwhile, selling volume has increased significantly.
This suggests that sellers currently have the upper hand.
🔥 My Market Outlook
If BTC loses the $55,130 support, further downside pressure could develop.
However, a recovery above $59,100 would be an early positive signal.
The $50K level is a possible downside scenario, NOT a confirmed price target.
One Question for the Community:
Are we witnessing a temporary correction, or could Bitcoin be preparing for another major leg down?
Share your analysis below!
#Bitcoin #BTC #CryptoMarket #BTCUSDT #TechnicalAnalysis #CryptoNews #CryptonixPro
$BTC