BNB Under Heavy Selling Pressure – Is a Market Reversal Near?
$BNB $BTC $ETH
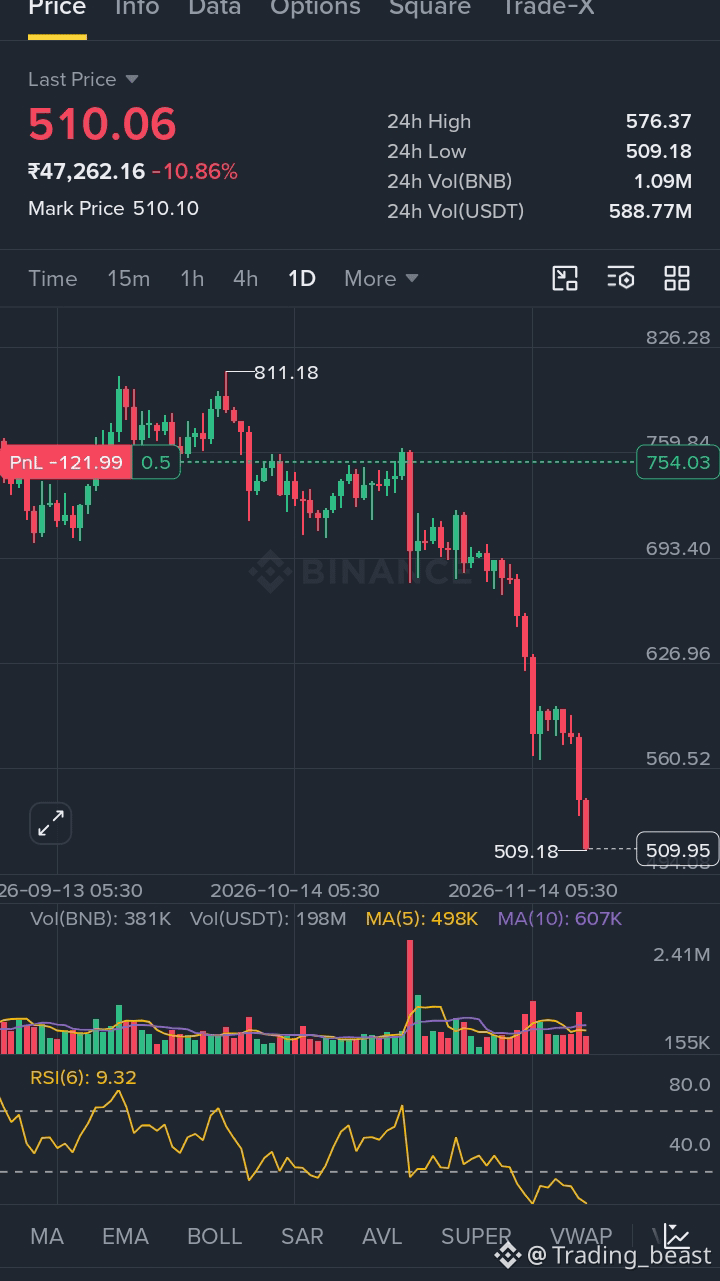
The BNB market is going through a challenging phase right now. Looking at the BNBUSDT 1D chart, sellers appear to be dominating the market, with the price currently trading around $510.06, down approximately 10.86%.
What makes this chart particularly interesting is the strength of the recent selling pressure. BNB has dropped significantly from its previous levels, and the latest candles show that bearish momentum is still strong.
What Does the Chart Tell Us?
One important indicator catching my attention is the RSI (6), currently around 9.32. This is an extremely low reading and suggests that BNB is deeply oversold on this timeframe.
However, an oversold RSI does not automatically mean that the price will reverse immediately. Sometimes, during strong bearish trends, the RSI can remain at low levels for an extended period.
Key Levels to Watch
- $509–$510: An important immediate support area.
- $560: A potential resistance zone if buyers attempt a recovery.
- $626: A higher resistance area to watch in case bullish momentum returns.
My Market Perspective
Personally, I think this is a moment where patience matters more than emotions. A sharp decline can create opportunities, but trying to catch the bottom without confirmation can also be risky.
I would like to see whether buyers can defend the $509 area and bring some strength back into the market. A clear recovery with strong buying volume could be an early sign of a potential change in momentum.
For now, BNB remains under significant bearish pressure, and the next few daily candles could be very important.
What do you think? Is BNB preparing for a recovery, or could we see another leg down?
Share your thoughts below. Let's discuss!
#BNB #BNBUSDT #Binance #CryptoMarket #TechnicalAnalysis #Bitcoin #Altcoins #CryptoTrading
$BNB $BTC $ETH
The BNB market is going through a challenging phase right now. Looking at the BNBUSDT 1D chart, sellers appear to be dominating the market, with the price currently trading around $510.06, down approximately 10.86%.
What makes this chart particularly interesting is the strength of the recent selling pressure. BNB has dropped significantly from its previous levels, and the latest candles show that bearish momentum is still strong.
What Does the Chart Tell Us?
One important indicator catching my attention is the RSI (6), currently around 9.32. This is an extremely low reading and suggests that BNB is deeply oversold on this timeframe.
However, an oversold RSI does not automatically mean that the price will reverse immediately. Sometimes, during strong bearish trends, the RSI can remain at low levels for an extended period.
Key Levels to Watch
- $509–$510: An important immediate support area.
- $560: A potential resistance zone if buyers attempt a recovery.
- $626: A higher resistance area to watch in case bullish momentum returns.
My Market Perspective
Personally, I think this is a moment where patience matters more than emotions. A sharp decline can create opportunities, but trying to catch the bottom without confirmation can also be risky.
I would like to see whether buyers can defend the $509 area and bring some strength back into the market. A clear recovery with strong buying volume could be an early sign of a potential change in momentum.
For now, BNB remains under significant bearish pressure, and the next few daily candles could be very important.
What do you think? Is BNB preparing for a recovery, or could we see another leg down?
Share your thoughts below. Let's discuss!
#BNB #BNBUSDT #Binance #CryptoMarket #TechnicalAnalysis #Bitcoin #Altcoins #CryptoTrading