🚨 SOLANA ($SOL ) KEEPS BLEEDING: SELLERS PRESS THE ADVANTAGE AS SUPPORT THINS OUT 📉🔥
$SOL | SOL/USDT
💰 Price: 67.59
📉 24H Change: -7.40%
📊 24H High: 73.56
📉 24H Low: 67.28
💵 24H Volume (USDT): 262.24M
🪙 24H Volume (SOL): 3.72M
⚠️ Market Breakdown (1H Timeframe):
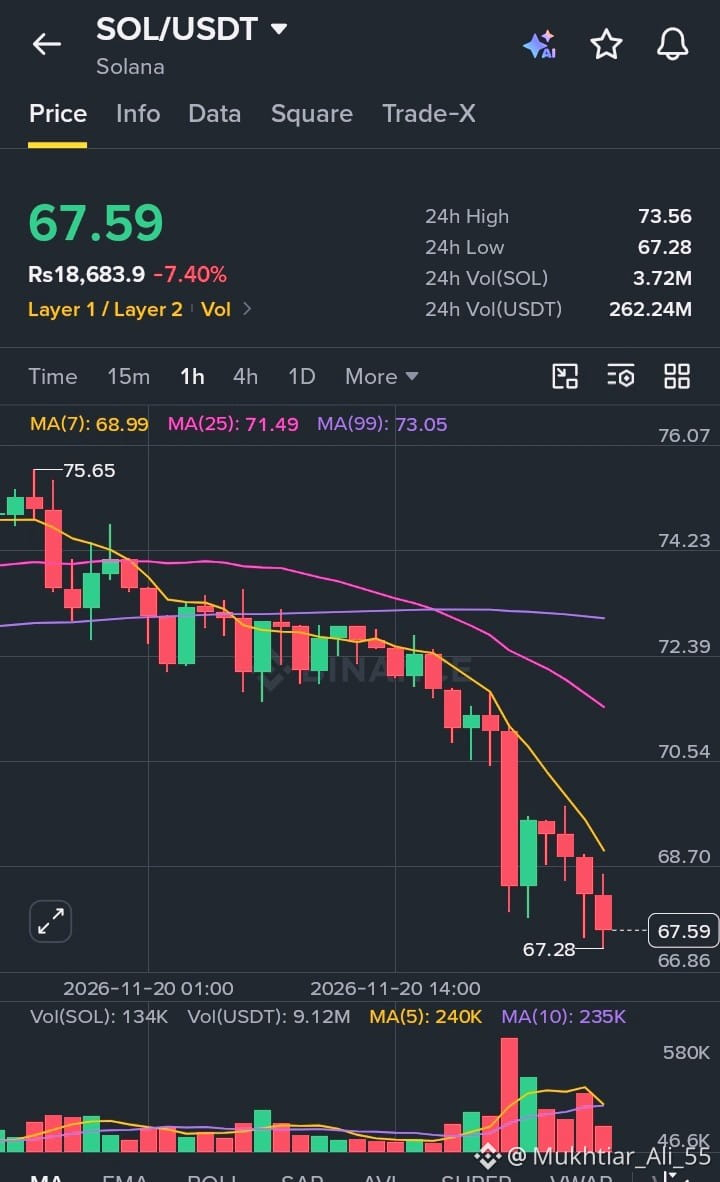
Solana slid steadily from the 75.65 area, then picked up speed once the 72 – 73 zone failed 🧨
🔻 A string of lower highs and lower lows has defined the trend for hours
🔻 One large bearish candle near 70.50 accelerated the drop and flushed out weak hands
🔻 Price is now sitting right at the 24H low, with only a thin wick near 67.28 showing buyers testing the waters 🧲
📉 Moving Averages Tell the Story:
📌 MA(7): 68.99
📌 MA(25): 71.49
📌 MA(99): 73.05
❌ Price is trading below all three major MAs
❌ All of them are sloping downward
❌ The MA(7) keeps rejecting every attempt at a bounce 🐻
📊 Volume Insight:
🔴 Volume spiked heavily on the breakdown candle
💥 This points to aggressive selling and likely forced liquidations
🔴 Recent candles are still red, and the small bounce attempt lacked follow-through
⚠️ Expect volatility to stay elevated
🧠 What This Means:
This move wasn’t random ❌
A steady downtrend followed by a high-volume breakdown usually signals trend continuation with a leverage flush on top.
🔹 Short-term trend: Bearish
🔹 Momentum: Weak, no confirmed reversal yet
🔹 Market sentiment: Fearful 😨
🎯 Key Levels to Watch:
🟢 Support: 66.80 – 67.30 zone
🔴 Resistance: 69 – 71.50 zone
📌 A reclaim of 69 (MA7) would be the first sign of relief
📌 A clean break below 67.28 could open the door to deeper downside ⬇️
💡 Final Take:
SOL is in a high-risk, high-volatility phase where patience beats prediction. Let the chart confirm before acting, manage your position size, and always protect your capital with a stop-loss. 🧘🛡️
Discipline will always outlast impulse 💎
#Solana #SOL #CryptoAnalysis #SOLUSDT #CryptoTrading
$SOL
$SOL | SOL/USDT
💰 Price: 67.59
📉 24H Change: -7.40%
📊 24H High: 73.56
📉 24H Low: 67.28
💵 24H Volume (USDT): 262.24M
🪙 24H Volume (SOL): 3.72M
⚠️ Market Breakdown (1H Timeframe):
Solana slid steadily from the 75.65 area, then picked up speed once the 72 – 73 zone failed 🧨
🔻 A string of lower highs and lower lows has defined the trend for hours
🔻 One large bearish candle near 70.50 accelerated the drop and flushed out weak hands
🔻 Price is now sitting right at the 24H low, with only a thin wick near 67.28 showing buyers testing the waters 🧲
📉 Moving Averages Tell the Story:
📌 MA(7): 68.99
📌 MA(25): 71.49
📌 MA(99): 73.05
❌ Price is trading below all three major MAs
❌ All of them are sloping downward
❌ The MA(7) keeps rejecting every attempt at a bounce 🐻
📊 Volume Insight:
🔴 Volume spiked heavily on the breakdown candle
💥 This points to aggressive selling and likely forced liquidations
🔴 Recent candles are still red, and the small bounce attempt lacked follow-through
⚠️ Expect volatility to stay elevated
🧠 What This Means:
This move wasn’t random ❌
A steady downtrend followed by a high-volume breakdown usually signals trend continuation with a leverage flush on top.
🔹 Short-term trend: Bearish
🔹 Momentum: Weak, no confirmed reversal yet
🔹 Market sentiment: Fearful 😨
🎯 Key Levels to Watch:
🟢 Support: 66.80 – 67.30 zone
🔴 Resistance: 69 – 71.50 zone
📌 A reclaim of 69 (MA7) would be the first sign of relief
📌 A clean break below 67.28 could open the door to deeper downside ⬇️
💡 Final Take:
SOL is in a high-risk, high-volatility phase where patience beats prediction. Let the chart confirm before acting, manage your position size, and always protect your capital with a stop-loss. 🧘🛡️
Discipline will always outlast impulse 💎
#Solana #SOL #CryptoAnalysis #SOLUSDT #CryptoTrading
$SOL