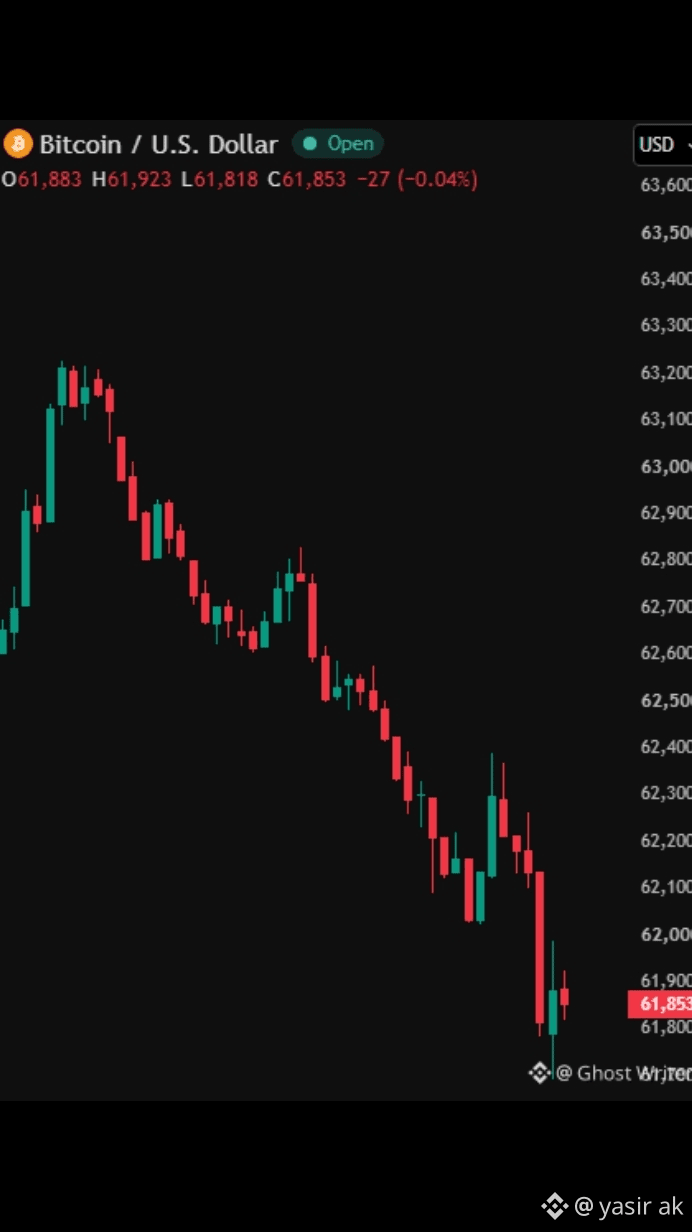
$BTC /USD
Price Now:
61,853 USD
Open: 61,883
High: 61,923
Low: 61,818
Change:27 (-0.04%) Almost flat, but slightly down.
What Chart Is Saying
Look at chart, it is going down like stairs.
1. Start: Price was 63,200 Top.
2. Then it fell to 62,600.
3. Then small bounce to 62,850, but sellers came again.
4. Then it fell more to 62,100.
5. Then small bounce to 62,350, again failed.
6. Now it made a big red fall to 61,800, and now it is at 61,853.
This is called Lower Highs and Lower Lows.
Every time it tries to go up, it goes less up than before.
Every time it falls, it falls more down than before.
That means sellers are stronger than buyers right now. Trend is DOWN / Bearish.
Support and Resistance
Resistance Ceiling:
1. 62,100 62,200 First resistance, where price just fell from.
2. 62,850 Strong resistance.
3. 63,200 Top, very strong.
Support Floor:
1. 61,800 Price is here now. Very important floor.
2. If it breaks 61,800, next floor is 61,500, then 61,000.
#NvidiaBoardReportedlySplitOverHuang’sReturn
Price Now:
61,853 USD
Open: 61,883
High: 61,923
Low: 61,818
Change:27 (-0.04%) Almost flat, but slightly down.
What Chart Is Saying
Look at chart, it is going down like stairs.
1. Start: Price was 63,200 Top.
2. Then it fell to 62,600.
3. Then small bounce to 62,850, but sellers came again.
4. Then it fell more to 62,100.
5. Then small bounce to 62,350, again failed.
6. Now it made a big red fall to 61,800, and now it is at 61,853.
This is called Lower Highs and Lower Lows.
Every time it tries to go up, it goes less up than before.
Every time it falls, it falls more down than before.
That means sellers are stronger than buyers right now. Trend is DOWN / Bearish.
Support and Resistance
Resistance Ceiling:
1. 62,100 62,200 First resistance, where price just fell from.
2. 62,850 Strong resistance.
3. 63,200 Top, very strong.
Support Floor:
1. 61,800 Price is here now. Very important floor.
2. If it breaks 61,800, next floor is 61,500, then 61,000.
#NvidiaBoardReportedlySplitOverHuang’sReturn