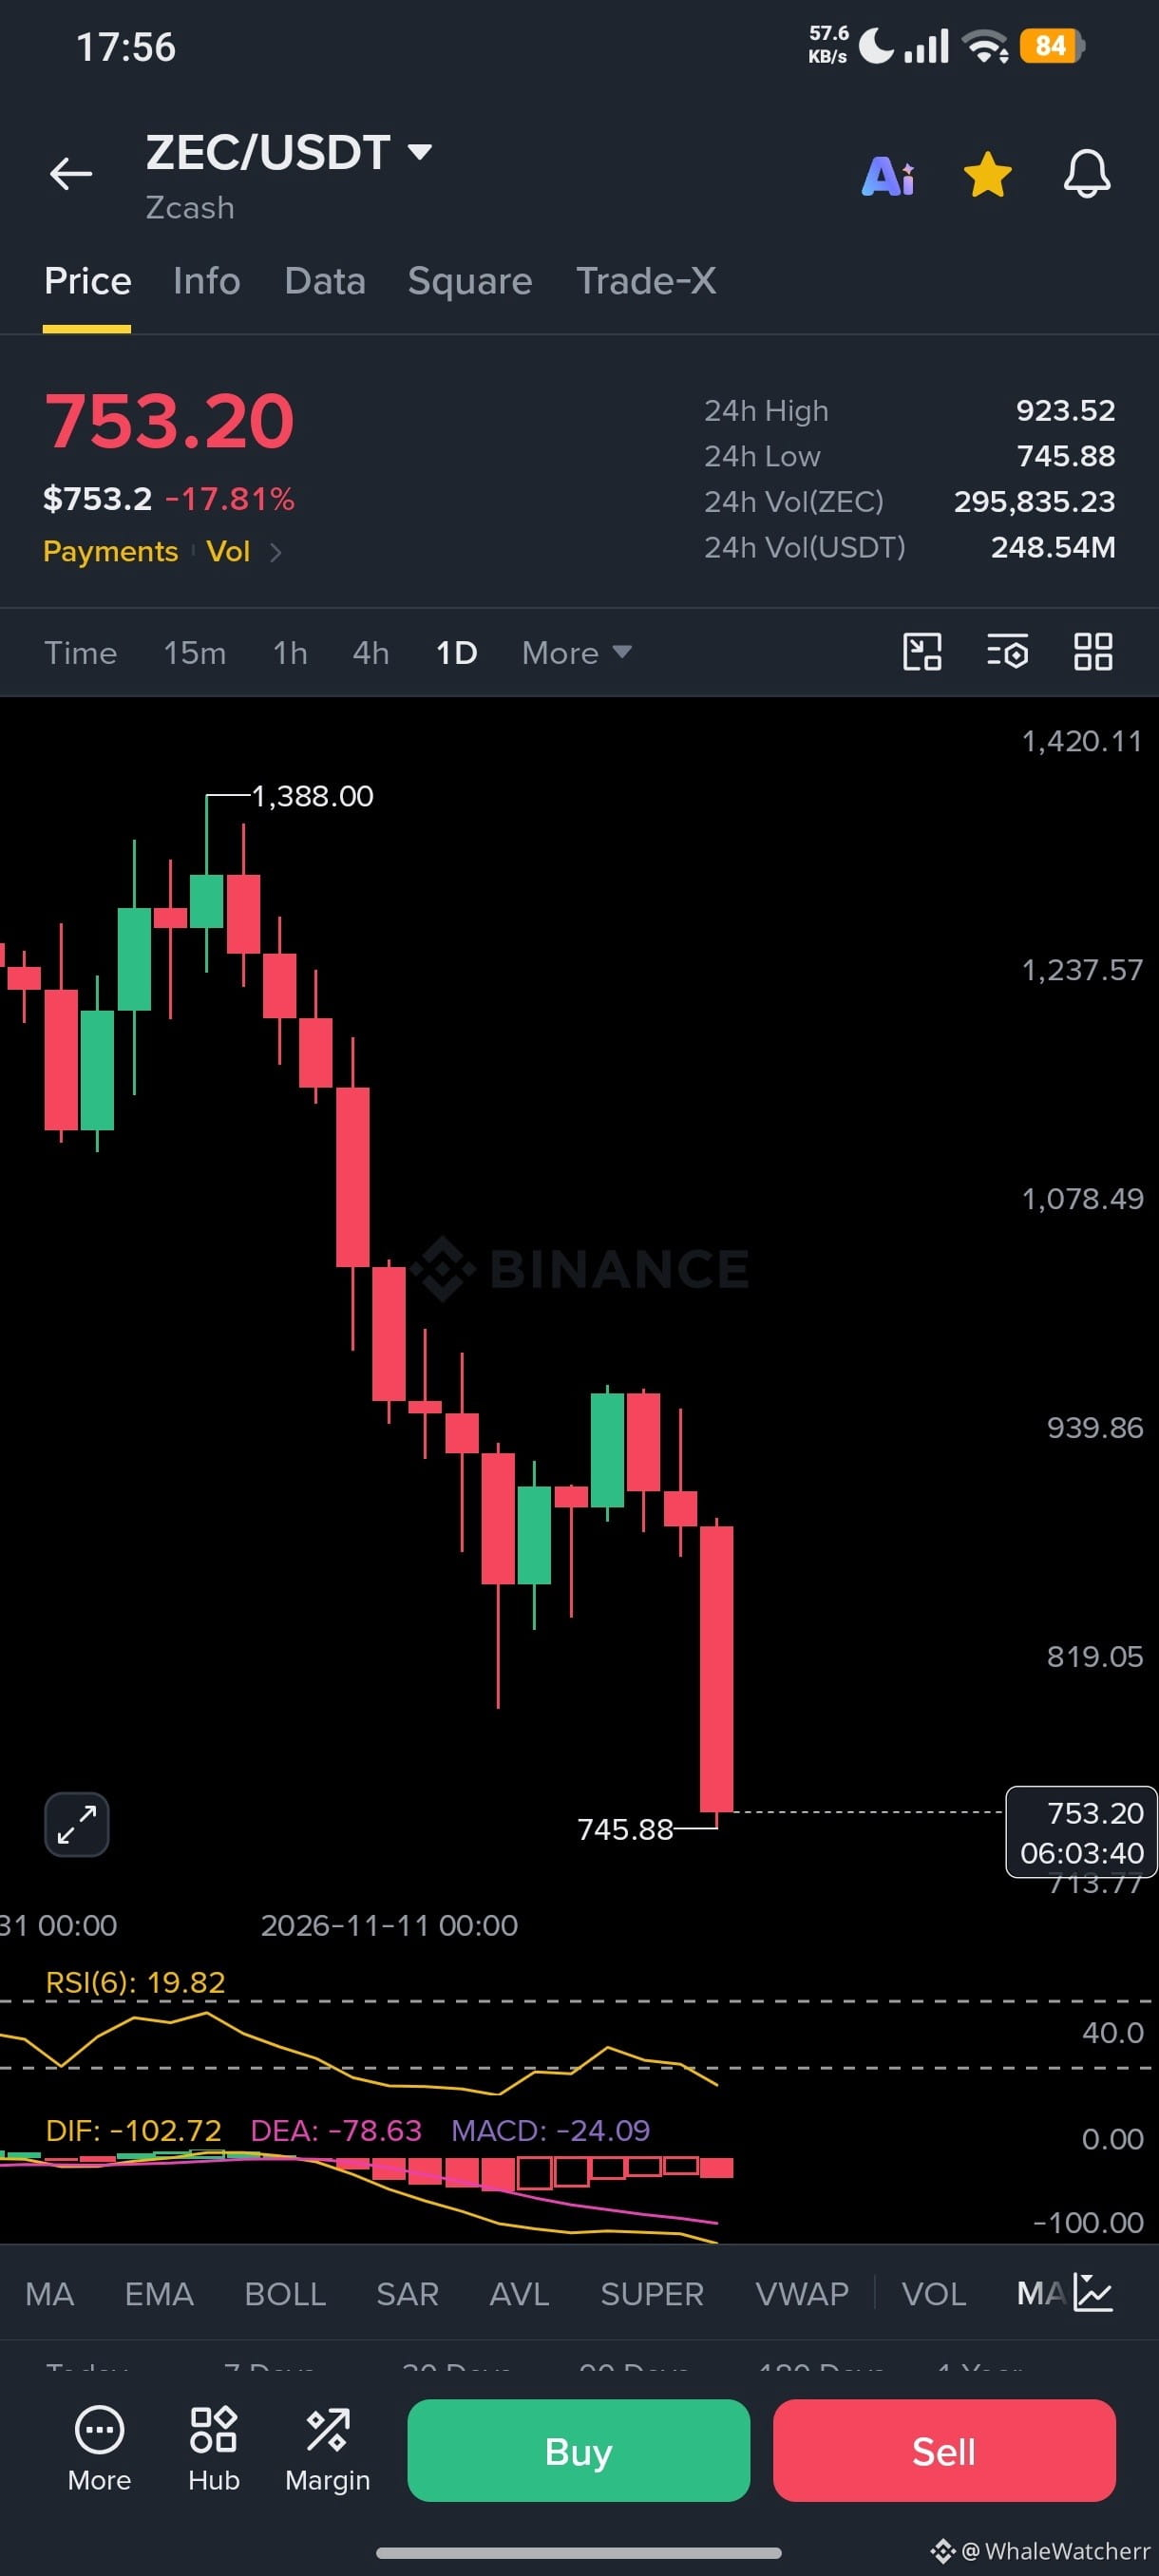
$ZEC is facing another brutal sell-off, with price plunging to $753.20 and down 17.81% over the last 24 hours. Sellers remain firmly in control, and the latest daily candle shows no clear sign of a reversal.
$ZEC
The 1D chart is strongly bearish, with lower highs and lower lows. RSI is at 19.82, indicating oversold conditions and the possibility of a relief bounce, but momentum remains weak. MACD is deeply negative, confirming continued downside pressure. Immediate support is at $745.88, while resistance sits around $819 and $939.86.
$ZEC
⚠️ ZEC is testing the edge of a critical support zone. If $745.88 holds, a recovery attempt could emerge, but a breakdown below this level may trigger further selling. Will buyers step in before the next leg down?
$ZEC
The 1D chart is strongly bearish, with lower highs and lower lows. RSI is at 19.82, indicating oversold conditions and the possibility of a relief bounce, but momentum remains weak. MACD is deeply negative, confirming continued downside pressure. Immediate support is at $745.88, while resistance sits around $819 and $939.86.
$ZEC
⚠️ ZEC is testing the edge of a critical support zone. If $745.88 holds, a recovery attempt could emerge, but a breakdown below this level may trigger further selling. Will buyers step in before the next leg down?