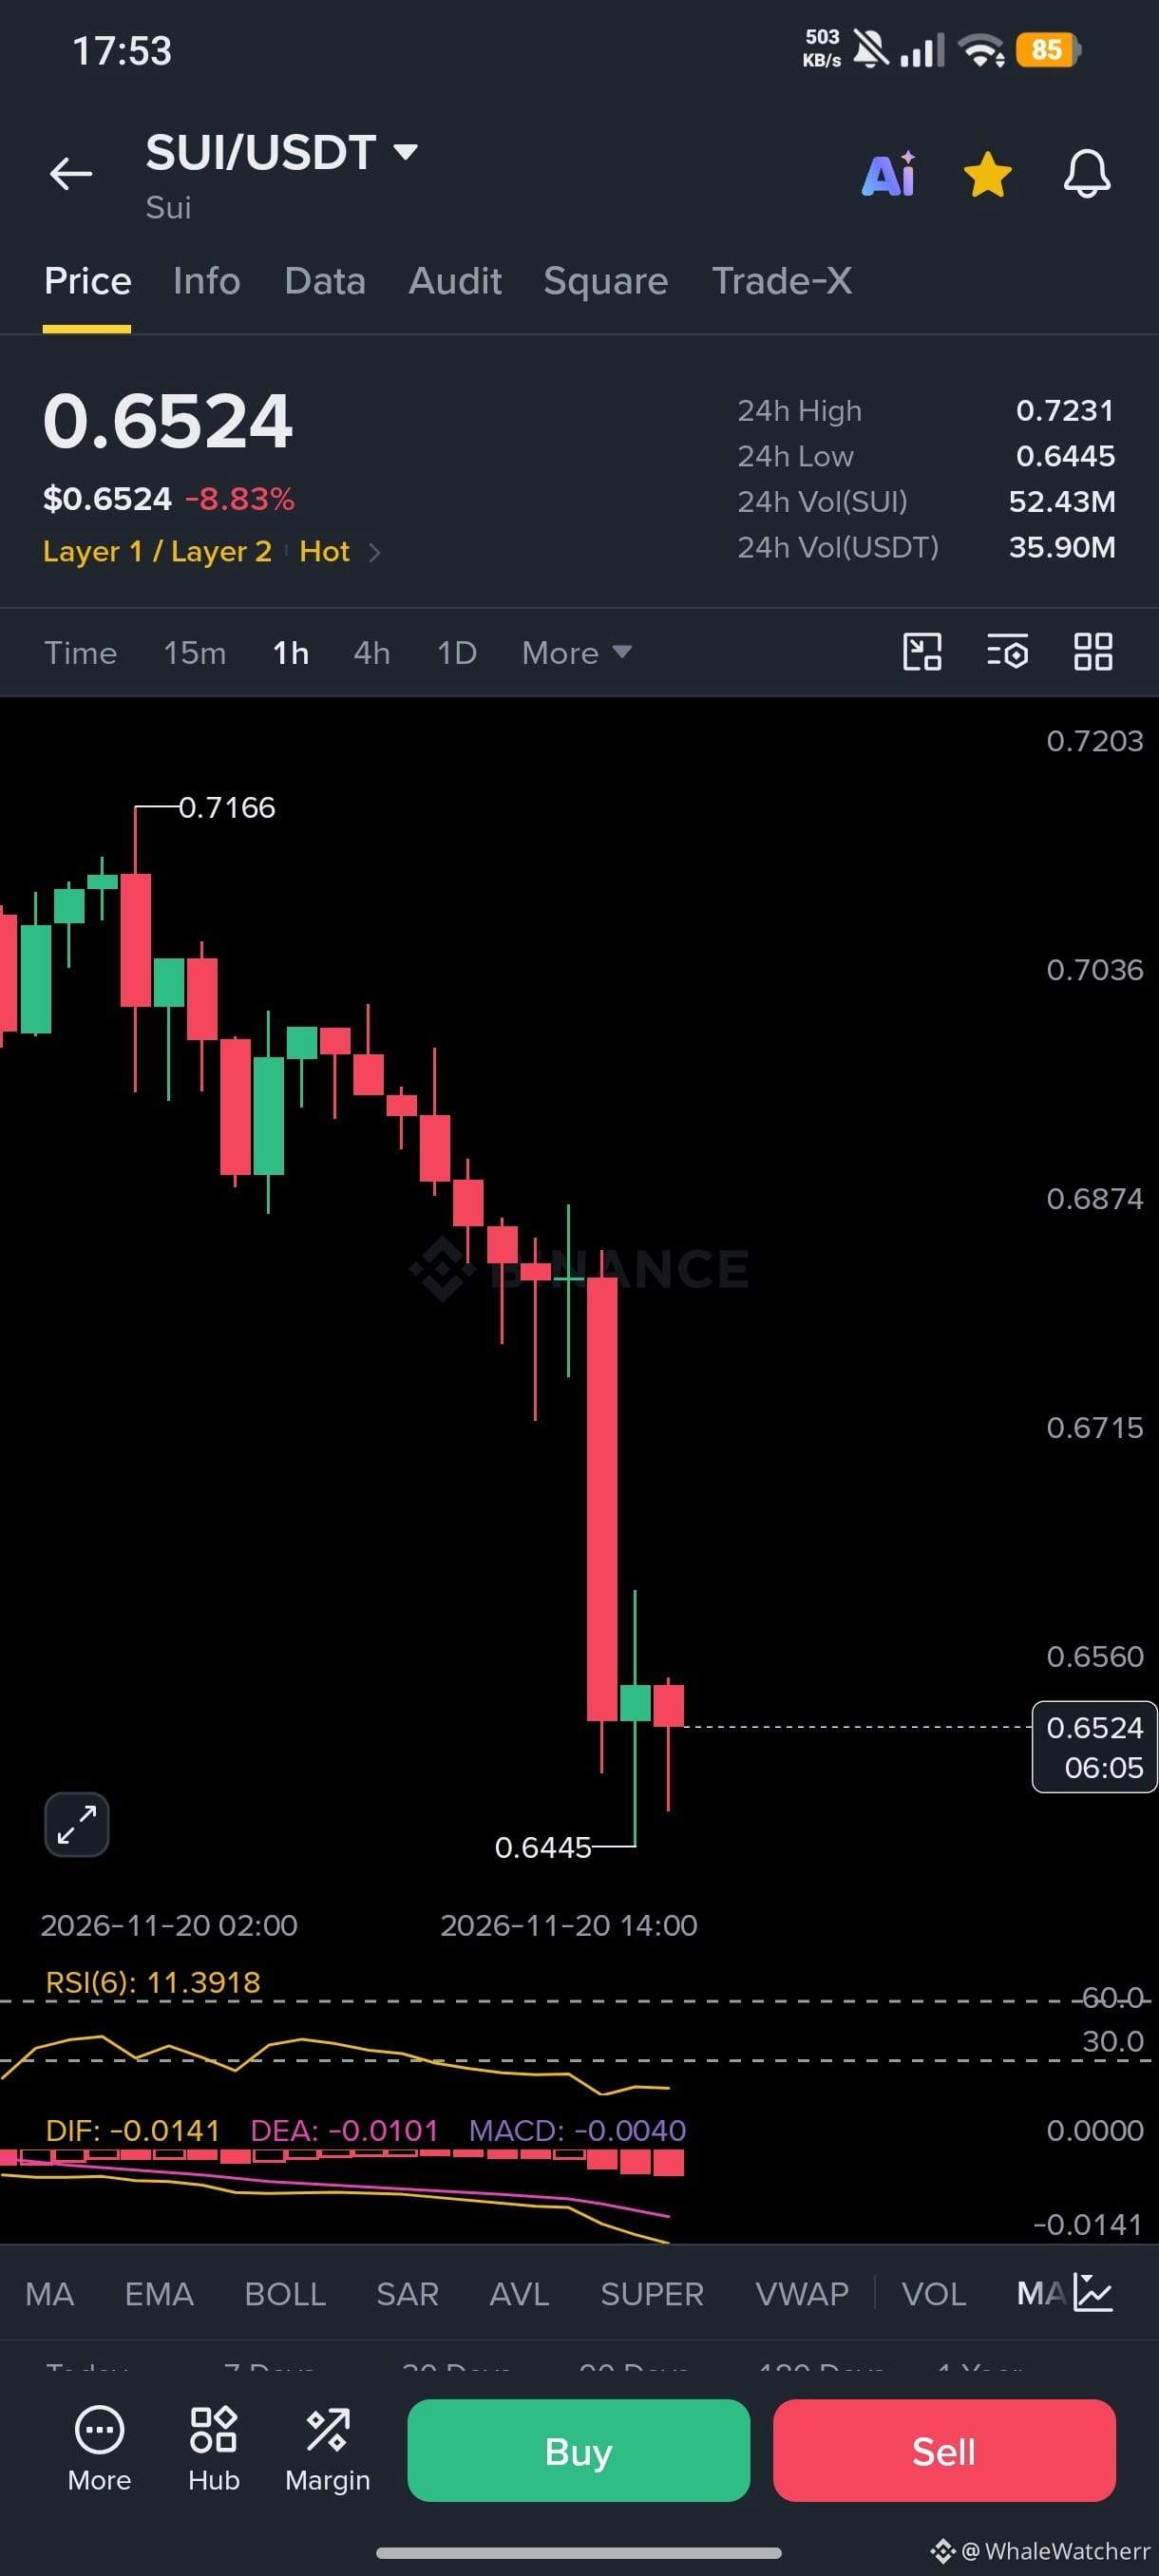
$SUI is under heavy pressure as sellers continue to dominate, with price trading at $0.6524 after an 8.83% drop in the last 24 hours.
$SUI
The 1H chart shows a clear bearish trend, followed by a sharp breakdown toward $0.6445 and a weak recovery. RSI is at 11.39, indicating extremely oversold conditions and the possibility of a short-term bounce. However, MACD remains negative, confirming that bearish momentum is still strong. Immediate support is around $0.6445, while resistance sits near $0.6560 and $0.6715.
$SUI
⚠️ SUI is trying to stabilize after a sharp drop, but buyers need to reclaim $0.6560 to show real strength. If $0.6445 breaks, downside pressure could intensify. Watch the support reaction carefully.
$SUI
The 1H chart shows a clear bearish trend, followed by a sharp breakdown toward $0.6445 and a weak recovery. RSI is at 11.39, indicating extremely oversold conditions and the possibility of a short-term bounce. However, MACD remains negative, confirming that bearish momentum is still strong. Immediate support is around $0.6445, while resistance sits near $0.6560 and $0.6715.
$SUI
⚠️ SUI is trying to stabilize after a sharp drop, but buyers need to reclaim $0.6560 to show real strength. If $0.6445 breaks, downside pressure could intensify. Watch the support reaction carefully.