$SOL
: H1/H4 Bearish Leg vs. Weekly Pullback
Looking across $SOL's timeframes, there is a clear tug-of-war between the short/medium-term bearish leg and the broader weekly structure:
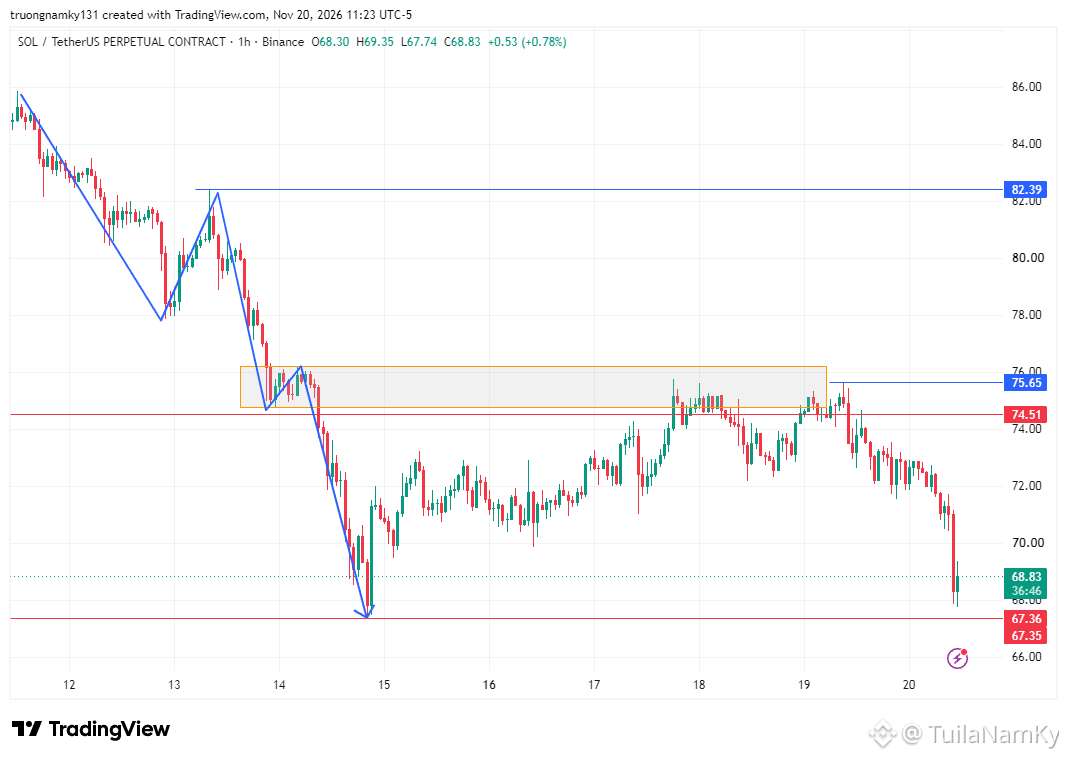
1H & 4H: Price is moving in a bearish structure from the 82.39 high down to the 67.36 low. Along the way, it formed an 8h+ sideways consolidation zone (orange box), pulled back into that consolidation, and dropped further to print 67.36. The reference high for the next bearish leg sits around 75.65. What I am watching closely here is whether sellers break 67.36 for a new lower low, along with how price reacts around the 68–69 zone.
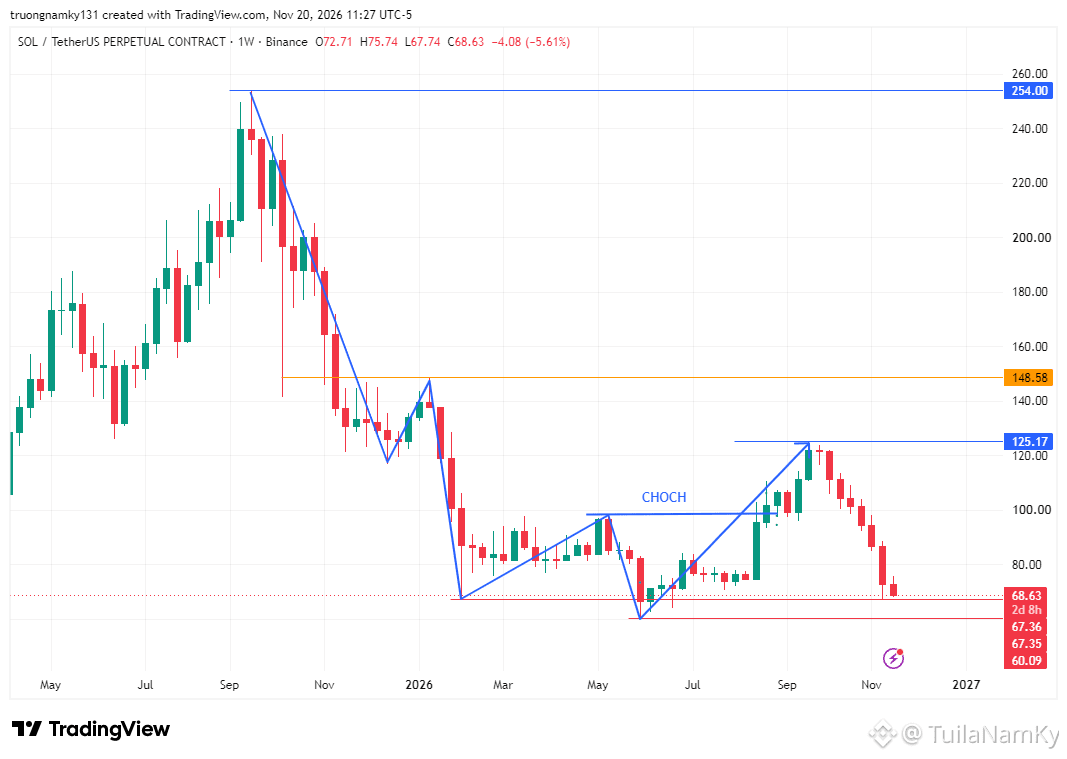
Weekly (1W): The higher timeframe tells a bigger story — the prior drop from 254.00 to 60.09 broke bearish structure around 98.30 (marked at 98.12 on the chart) and pushed up to the 125.17 high. Price is now pulling back: the big question is whether it holds above 60.09 to form a higher low and aim for a new high above 125.17, or breaks below 60.09 to make a lower low.
Reference Scenarios (Not Financial Advice):
Bearish continuation: Price stays below bearish structure and decisively breaks 67.36 (reference high 75.65) → keep risk clearly defined, scale out profits, and watch for downside expansion.
Relief / short-term reversal: Price reacts around 68–69 or holds above 67.36 with a lower-timeframe bullish structure break → keep risk tight, size carefully, and treat moves as relief bounces until key resistance levels are reclaimed.
Weekly context: Watch the 60.09 base and 125.17 level with appropriate sizing given wider higher-timeframe swings.
#SOL #CryptoAnalysis #PriceAction
: H1/H4 Bearish Leg vs. Weekly Pullback
Looking across $SOL's timeframes, there is a clear tug-of-war between the short/medium-term bearish leg and the broader weekly structure:
1H & 4H: Price is moving in a bearish structure from the 82.39 high down to the 67.36 low. Along the way, it formed an 8h+ sideways consolidation zone (orange box), pulled back into that consolidation, and dropped further to print 67.36. The reference high for the next bearish leg sits around 75.65. What I am watching closely here is whether sellers break 67.36 for a new lower low, along with how price reacts around the 68–69 zone.
Weekly (1W): The higher timeframe tells a bigger story — the prior drop from 254.00 to 60.09 broke bearish structure around 98.30 (marked at 98.12 on the chart) and pushed up to the 125.17 high. Price is now pulling back: the big question is whether it holds above 60.09 to form a higher low and aim for a new high above 125.17, or breaks below 60.09 to make a lower low.
Reference Scenarios (Not Financial Advice):
Bearish continuation: Price stays below bearish structure and decisively breaks 67.36 (reference high 75.65) → keep risk clearly defined, scale out profits, and watch for downside expansion.
Relief / short-term reversal: Price reacts around 68–69 or holds above 67.36 with a lower-timeframe bullish structure break → keep risk tight, size carefully, and treat moves as relief bounces until key resistance levels are reclaimed.
Weekly context: Watch the 60.09 base and 125.17 level with appropriate sizing given wider higher-timeframe swings.
#SOL #CryptoAnalysis #PriceAction