$SOXLB : Understanding Short Squeezes and Long Liquidations
Why does $SOXLB move higher on an hourly candle while staying inside its recorded range and showing volume above baseline? This question highlights a common myth that a volume spike automatically signals a breakout.
**The observation**
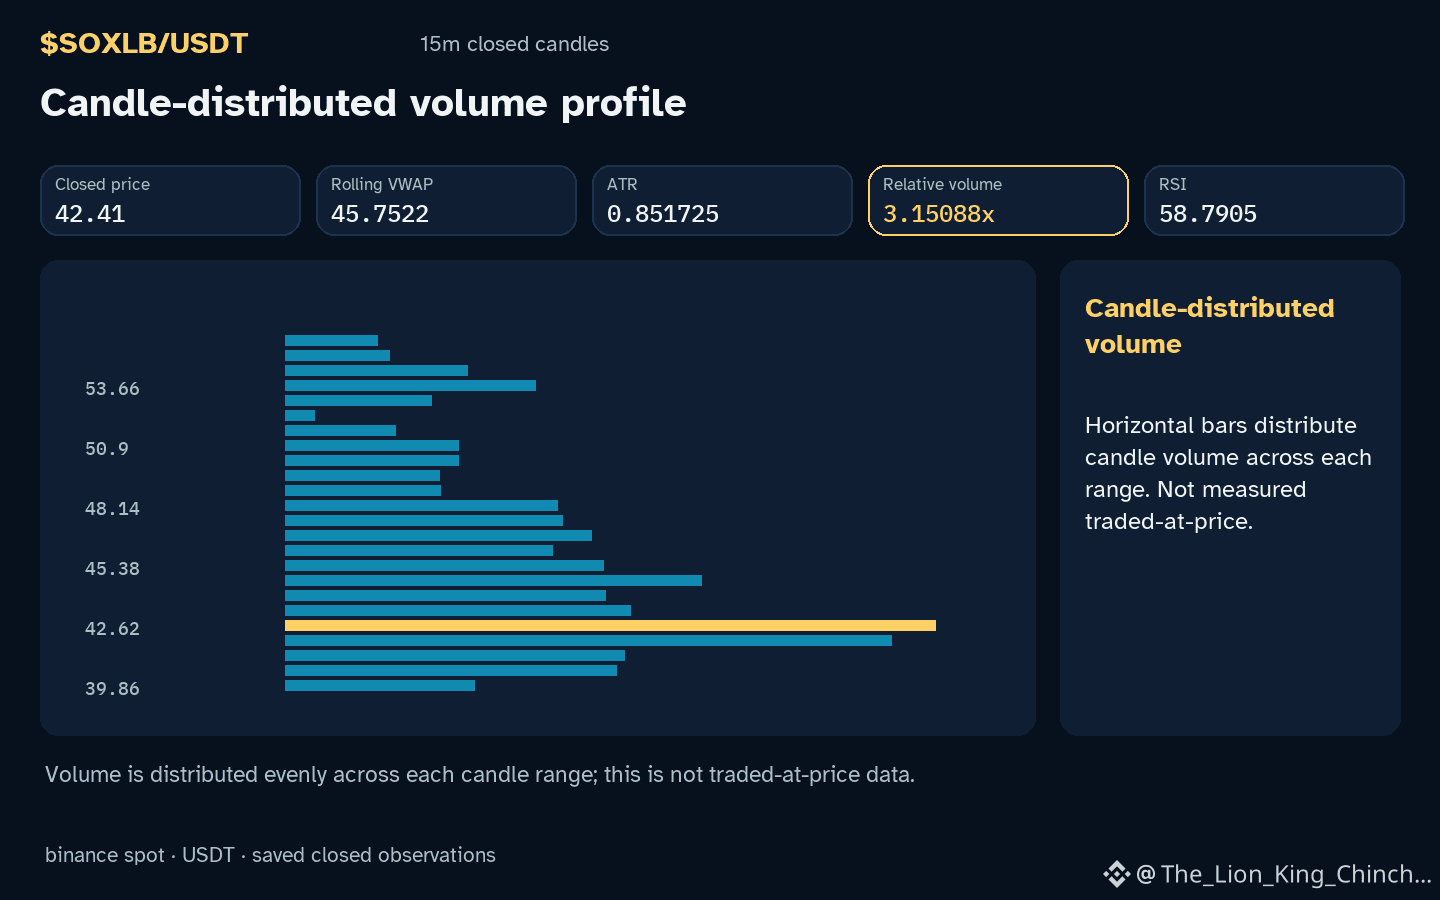
The asset is currently trading inside its recorded range, the hourly direction is up, and relative volume is 3.15x baseline. RSI displays 58.8.
**A conditional explanation**
One explanation links short squeezes to a rapid price rise that forces short positions to cover, while long liquidations occur when leveraged longs are forced to sell as price falls. In a short squeeze scenario, higher buying pressure can push price up, but the effect depends on the size of short exposure and the timing of margin calls. Conversely, long liquidations require a downward move that breaches leverage thresholds. The observed volume increase indicates more participants are active, yet it does not prove that short sellers are being squeezed or that longs are close to liquidation. The price staying within range suggests that buying pressure was insufficient to break the local resistance, and sellers may have stepped in to absorb the demand.
**The limits of the evidence**
The data does not include short interest, open interest or liquidation metrics, so the hypothesis cannot be confirmed. Future closed‑candle evidence that shows a sustained move beyond the recorded resistance together with a drop in relative volume would weaken the short‑squeeze interpretation. Likewise, a sharp decline below support with rising volume could support a long‑liquidation scenario. Until such data appears, the volume spike should be viewed as a neutral signal of heightened activity rather than a definitive breakout cue.
Probabilistic market research, not a recommendation or guaranteed return.
#SOXLB
Why does $SOXLB move higher on an hourly candle while staying inside its recorded range and showing volume above baseline? This question highlights a common myth that a volume spike automatically signals a breakout.
**The observation**
The asset is currently trading inside its recorded range, the hourly direction is up, and relative volume is 3.15x baseline. RSI displays 58.8.
**A conditional explanation**
One explanation links short squeezes to a rapid price rise that forces short positions to cover, while long liquidations occur when leveraged longs are forced to sell as price falls. In a short squeeze scenario, higher buying pressure can push price up, but the effect depends on the size of short exposure and the timing of margin calls. Conversely, long liquidations require a downward move that breaches leverage thresholds. The observed volume increase indicates more participants are active, yet it does not prove that short sellers are being squeezed or that longs are close to liquidation. The price staying within range suggests that buying pressure was insufficient to break the local resistance, and sellers may have stepped in to absorb the demand.
**The limits of the evidence**
The data does not include short interest, open interest or liquidation metrics, so the hypothesis cannot be confirmed. Future closed‑candle evidence that shows a sustained move beyond the recorded resistance together with a drop in relative volume would weaken the short‑squeeze interpretation. Likewise, a sharp decline below support with rising volume could support a long‑liquidation scenario. Until such data appears, the volume spike should be viewed as a neutral signal of heightened activity rather than a definitive breakout cue.
Probabilistic market research, not a recommendation or guaranteed return.
#SOXLB