

CYBER (CYBER) Price Analysis, Technical Outlook, and Market Structure – November 20, 2026
2. Introduction & Market Overview
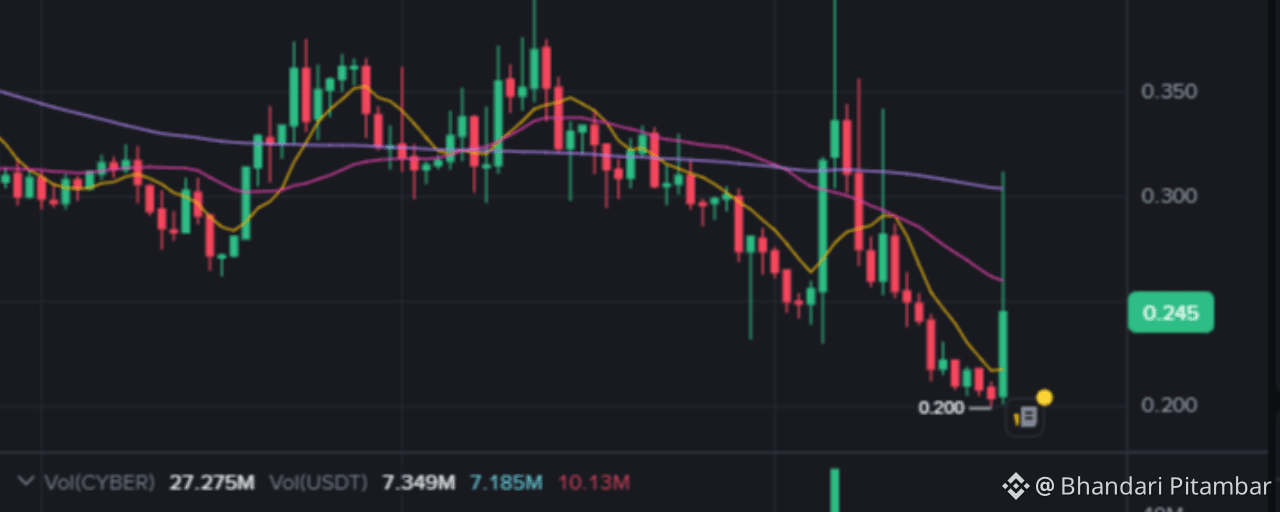
CYBER/USDT is currently exhibiting extreme intraday volatility, posting a +20.09% daily gain. However, retail traders interpreting this as a definitive bullish reversal are misreading the chart. While the daily candle is green, the price action tells a story of severe overhead rejection. The asset spiked to 0.312 before being aggressively sold down to 0.245, leaving a massive upper wick. This is not a sign of unbridled strength; it is a classic liquidity sweep and distribution signal. Understanding the difference between a genuine breakout and a bear trap is critical for CYBER right now, as the broader market structure remains heavily skewed to the downside.
3. Today's Global Crypto Market News
Note: The following reflects the macroeconomic and crypto-market context as of November 20, 2026.
Bitcoin ETF Flows & Institutional Positioning: Institutional flows into Spot Bitcoin ETFs have stabilized after months of volatility. Net inflows remain positive but are heavily concentrated in legacy funds, indicating a "risk-off" institutional preference for BTC over high-beta altcoins. Impact: Capital is not rotating aggressively into mid-cap altcoins like CYBER, limiting sustained upside momentum.
Macroeconomic Updates (Fed & Liquidity): The Federal Reserve’s recent stance on interest rates has maintained a restrictive but stable environment. Global M2 liquidity is expanding slowly, but crypto-specific liquidity remains fragmented. Impact: Altcoin rallies are currently driven by localized catalysts rather than a rising tide of macro liquidity.
Regulatory Clarity in Key Markets: Recent regulatory frameworks in the EU and Asia have provided clearer guidelines for token classifications, reducing the risk of sudden delistings for compliant projects like CyberConnect. Impact: Removes a layer of existential regulatory risk, but does not act as an immediate price catalyst.
4. Selected Cryptocurrency Latest News & Fundamental Analysis
CyberConnect (CYBER) continues to position itself as a foundational social graph protocol, heavily integrated with the Base ecosystem and broader Web3 social applications.
Ecosystem Growth: The CyberConnect protocol has seen steady growth in active wallets and API calls, driven by its integration into various decentralized social media frontends. However, protocol revenue has not yet scaled proportionally to justify a higher token valuation.
Tokenomics & Supply Overhang: A critical fundamental weakness for CYBER remains its tokenomics. The circulating supply is a fraction of the maximum supply. While this provides a low float for volatility, it introduces persistent sell pressure from future token unlocks and venture capital vesting schedules. Traders must account for this dilution risk when evaluating long-term holding periods.
Network Upgrades: Recent protocol updates have focused on reducing gas costs for social interactions on Base, improving user experience. While technically sound, these updates are evolutionary, not revolutionary, and have not triggered a fundamental repricing of the asset.
5. Live Market Analysis (As of November 20, 2026, 14:00 UTC)
Current Price: $0.245
24h Change: +20.09%
24h High / Low: $0.312 / $0.201
24h Range: 54.41%
24h Volume (CYBER): 27.275M
24h Volume (USDT): 7.349M
Moving Averages: MA(7): 0.217 | MA(25): 0.259 | MA(99): 0.303
The 24-hour volume of 27.275M CYBER represents a massive spike compared to the preceding weeks. However, high volume paired with a long upper wick indicates heavy distribution. Sellers are actively absorbing buy orders at the 0.300+ level. The price is currently trading above the short-term MA(7) but remains suppressed below the medium-term MA(25).
6. 24-Hour Candlestick Pattern Analysis
Analyzing the provided 1D chart, the current daily candle is the most critical piece of evidence, and it is fundamentally flawed for bulls.
The "Shooting Star" / Bearish Rejection: The candle opened at 0.205, pushed to a high of 0.312, and is currently closing at 0.245. The upper wick is roughly 0.067 in length, while the body is only 0.040. This means the price rejected nearly 60% of its daily range.
Volume Confirmation: The volume bar for this candle is the highest in months. A massive volume spike that fails to close near the high is a textbook exhaustion and distribution pattern. It shows that smart money used the liquidity of the pump to offload positions.
Lower Timeframes (1H/4H): On the 4H and 1H charts, this price action manifests as a sharp impulse up followed by a sustained, heavy sell-off. The 1H chart likely shows a bearish engulfing or evening star pattern forming at the 0.300 psychological resistance.
7. Complete Technical Indicator Analysis
Trend Indicators:
Moving Averages: The price (0.245) has crossed above the MA(7) at 0.217, signaling a short-term relief bounce. However, it is still trading below the MA(25) at 0.259 and the MA(99) at 0.303. The MA(25) and MA(99) remain sloped downward, confirming the macro trend is bearish.
MACD: The MACD histogram is likely turning positive from deeply negative territory, indicating a short-term momentum shift, but the signal lines remain below the zero axis.
Momentum Indicators:
RSI: The daily RSI has bounced from oversold conditions but is now approaching the 50-60 neutral zone. It lacks the strength to push into overbought territory (>70), which is required for a true trend reversal.
Volatility & Volume:
Bollinger Bands: The price pierced the upper Bollinger Band at 0.312 and was immediately rejected back inside the bands. This is a mean-reversion signal, suggesting the price will gravitate back toward the middle band (around 0.240-0.250).
Volume Profile: The high-volume node is currently at the top of the wick (0.280-0.310). This area is now a massive resistance zone, as all buyers at that level are currently underwater and will look to sell at breakeven.
8. Market Structure, Smart Money & Derivatives Sentiment
Market Structure & SMC:
Trend Direction: The macro structure on the daily timeframe is a clear series of Lower Highs (LH) and Lower Lows (LL). The recent low at 0.200 established a new LL.
Liquidity Sweep: The spike to 0.312 likely swept the liquidity resting above a previous minor resistance level or a Fair Value Gap (FVG) around 0.300-0.310. Smart money algorithms often push price into these zones to trigger retail stop-losses and gather liquidity before reversing the price.
Order Blocks: The bearish order block that initiated the previous drop sits around 0.280-0.300. The price tapped this zone and was rejected.
Derivatives & Sentiment:
Open Interest (OI): A sudden spike in OI accompanied by this price action suggests leveraged longs were trapped at the top. If the price drops below 0.230, a cascade of long liquidations will occur.
Funding Rates: Funding rates likely flipped positive during the pump. If funding remains highly positive while price stalls, it indicates over-leveraged longs, setting the stage for a long squeeze.
9. Bitcoin & Broader Crypto Market Impact
Bitcoin (BTC) is currently dictating the macro rhythm, and its dominance (BTC.D) remains elevated. When BTC.D is high or rising, altcoins like CYBER struggle to maintain independent rallies. The broader altcoin market is experiencing a "bleed" against BTC. CYBER’s 20% move is an anomaly driven by localized liquidity rather than a broad altcoin season. If BTC experiences a 2-3% correction, CYBER’s fragile support at 0.245 will likely collapse, as altcoins typically amplify BTC's downside by 2x to 3x.
10. Key Support & Resistance Levels
Level Type
Price Zone
Significance
Major Resistance
$0.303 - $0.312
MA(99) confluence with the daily high and massive volume rejection wick.
Immediate Resistance
$0.259 - $0.265
MA(25) dynamic resistance and local breakdown level.
Pivot / Current Price
$0.245
Current consolidation zone; acts as immediate support.
Immediate Support
$0.217 - $0.220
MA(7) dynamic support. Must hold to maintain short-term bounce.
Major Support
$0.200 - $0.201
Psychological level and recent swing low. Breakdown triggers macro bearish continuation.
11. Bullish, Bearish & Neutral Price Scenarios
Bullish Scenario:
For CYBER to invalidate the bearish wick, it must reclaim and close a daily candle above the MA(25) at $0.259. If it does, the next target is the liquidity pool at $0.280. This scenario requires a sustained increase in spot buying volume and a drop in BTC dominance. Probability: Low (20%).
Bearish Scenario (Base Case):
The massive upper wick acts as a distribution top. Price fails to hold $0.245, breaks below the MA(7) at $0.217, and retests the recent low at $0.200. If $0.200 breaks, the next structural support lies around $0.170-$0.180. Probability: High (60%).
Neutral Scenario:
Price consolidates between the MA(7) at $0.217 and the MA(25) at $0.259. The market digests the recent volatility, and volume drops significantly as traders wait for a macro catalyst. Probability: Moderate (20%).
12. Trading Strategy & Risk Management
Do not buy the top of a wick. The current price action is a trap for FOMO traders.
Short Setup (Preferred): Wait for a relief bounce back to the $0.255 - $0.260 zone (MA25 resistance). Enter a short position with a stop-loss strictly above the daily high at $0.315. Target 1: $0.220. Target 2: $0.202. Risk/Reward: ~1:2.
Long Setup (Counter-Trend/Scalp): Only consider a long if price retests the $0.215 - $0.220 zone (MA7 support) and prints a bullish reversal candle (e.g., a hammer or bullish engulfing) on the 1H timeframe. Stop-loss below $0.198. Target: $0.245.
Invalidation: If a daily candle closes above $0.265 with high volume, the bearish thesis is invalidated. Stay out of the market if volume drops to average levels, as chop will erode capital.
13. Final Global Market Conclusion & Analyst Outlook
Today's global crypto market remains in a cautious, selective phase where capital favors Bitcoin and high-conviction narratives over broad altcoin exposure. For CYBER, the strongest technical driver is the massive bearish rejection wick at $0.312, which highlights severe selling pressure and a potential smart money distribution event. The fundamental driver remains its utility in the Web3 social stack, but this is currently overshadowed by token unlock dilution risks and a lack of macro liquidity rotation.
Over the next 24–48 hours, traders must watch the $0.259 (MA25) and $0.217 (MA7) levels. A failure to hold $0.217 will likely send the asset back to test the $0.200 lows. The medium-term outlook remains bearish until the asset can establish a higher low and break the descending trendline on the daily chart. The primary risk to the bearish thesis is a sudden, unexpected surge in global crypto liquidity that forces a short squeeze.
OVERALL CRYPTO MARKET BIAS: NEUTRAL to BEARISH — Capital is consolidating in BTC and major caps, leaving mid-cap altcoins vulnerable to liquidity sweeps and mean-reversion sell-offs.
SELECTED COIN MARKET BIAS: BEARISH — The +20% daily pump is structurally weak, characterized by a massive upper wick and volume distribution, indicating that sellers are aggressively defending the 0.300+ zone and the macro downtrend remains intact.


