
Anthropic Tokenized bStocks (ANTB/USDT) Price Analysis, Latest News & Technical Outlook
2. Introduction & Market Overview
Tokenized Real-World Assets (RWAs) sit at the intersection of traditional equity listings and on-chain liquidity as Anthropic's tokenized bStocks (ANTB) trade against USDT following Anthropic's landmark stock market debut. Rather than a standalone native utility coin, ANTB represents tokenized equity exposure (bStocks) on BNB Smart Chain, giving eligible participants on-chain access tied to underlying equity performance.
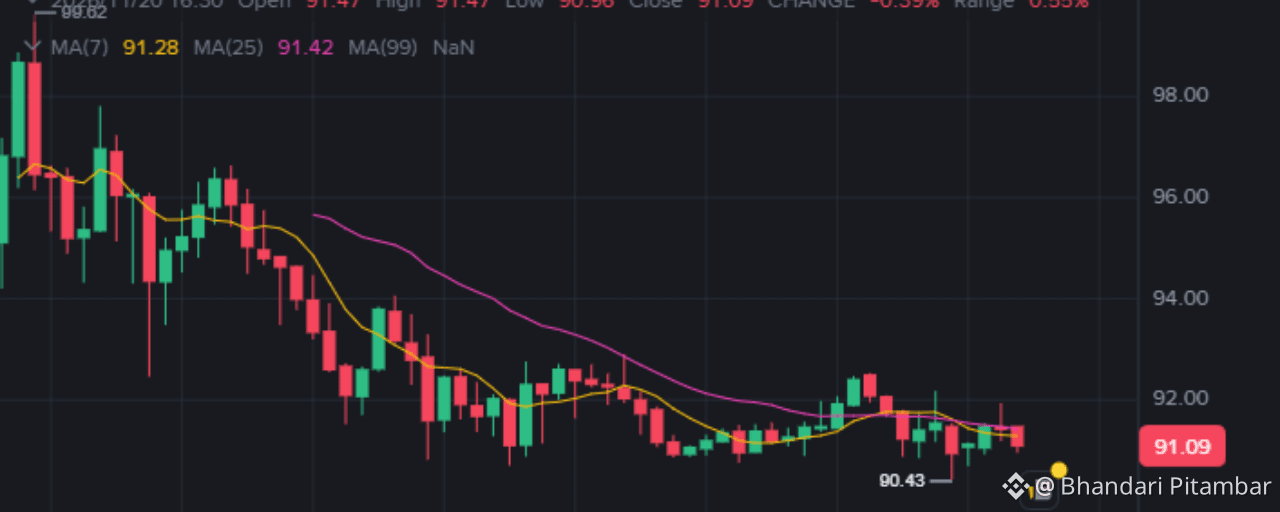
On the 15-minute chart provided for ANTB/USDT, price action reflects post-debut volatility and a downward drift from an upper local swing near 99.62 toward the 91.09 zone, testing short-term support after dipping to 90.43. With broader digital asset sentiment pressured by ETF outflows and equity volatility, traders are closely watching whether ANTB stabilizes above the 90.00–90.43 shelf or extends its corrective leg.
3. Today's Global Crypto Market News
Spot Bitcoin & Ethereum ETF Outflows Weigh on Market: Heavy November redemptions across US-listed spot Bitcoin and Ethereum ETFs—reported approaching roughly $3 billion for BTC ETFs and nearly $1 billion for ETH ETFs—have drained institutional bid support during a seventh consecutive week of broader crypto market weakness.
Publication Date & Source: November 19–20, 2026 — Mitrade / FXStreet and CryptoNews.
Why It Matters & Market Impact: Sustained ETF outflows reduce structural buying pressure and reinforce risk-off positioning across majors and high-beta tokens.
Equity Market Pullback & AI Valuation Scrutiny: US equities experienced broad selling pressure, with the S&P 500 falling 2.02% to 7,175.83 and the Nasdaq Composite dropping 2.25% amid a six-session losing streak, while Anthropic's Nasdaq debut saw initial intraday spikes up to $115 against an $83 IPO price before cooling to a $97.17 close.
Publication Date & Source: November 20, 2026 — CryptoNews.
Why It Matters & Market Impact: Cross-asset risk aversion in tech and AI equities spills over into tokenized equity markets and crypto liquidity, creating tight correlation during sharp macro repricing.
Broader Crypto Market Cap & Risk Sentiment: Total crypto market capitalization has slipped toward the ~$2.15T–$2.22T area with Bitcoin trading near the low-$60,000s (~$62,500–$63,000) and sentiment indicators signaling acute caution.
Publication Date & Source: November 19–20, 2026 — CoinGecko, Mitrade, and CryptoNews.
Why It Matters & Market Impact: Weak macro momentum in BTC and ETH limits sustained altcoin/RWA breakouts unless BTC reclaims higher resistance levels.
4. Selected Cryptocurrency Latest News & Fundamental Analysis
Exchange Listing & Convert Rollout: Binance announced spot trading for ANTB/USDT (scheduled around November 19, 2026 at 18:00 UTC, with deposits/withdrawals at 19:00 UTC and promotional zero maker fees through November 30, 2026, alongside Binance Convert and collateral/perpetual updates).
Airdrop & New-User Promotional Incentives: A $1,000,000 ANTB airdrop campaign distribution was scheduled to be viewable in eligible spot accounts by November 20, 2026, alongside a new-user promotion running from November 19 to December 9, 2026.
Tokenized Equity Structure & Supply Nuances: As tokenized bStocks on BNB Smart Chain (0x38Dd26788Cf2d901E3aBf04efE3007d459d0Fc53), ANTB is structured around underlying equity backing and 1:1 conversion mechanics under specific jurisdictional rules (notably restricted for US persons). Third-party aggregator data shows conflicting or incomplete supply/market-cap figures early in its trading lifecycle (for example, ranging from ~$5.45M reported on a spot quote page to unverified/zero market-cap displays on aggregator trackers), meaning traders must verify live circulating supply and mint/redemption flows directly via official issuer and exchange disclosures rather than assuming a fixed crypto supply cap.
Key Fundamental Drivers & Risks: Strong brand visibility around Anthropic's public listing supports initial retail and liquidity interest, but early post-listing price discovery, promotional reward distribution (which can introduce sell pressure from airdrop recipients), and jurisdictional restrictions are major near-term fundamentals to monitor.
5. Live Market Analysis (As of November 20, 2026, 10:57 UTC)
Note: The current local timestamp is Friday, November 20, 2026 at 16:42 +0545 (Nepal Time), which converts to November 20, 2026, 10:57 UTC.
Last Candle & Price Action (from 15m Chart): The 15-minute candle timestamped 2026/11/20 16:30 (chart time) shows Open: 91.47, High: 91.47, Low: 90.96, Close: 91.09, Change: -0.39%, and Range: 0.55%. Earlier on the visible 15m window, price reached a local peak near 99.62 before stair-stepping lower to a swing low of 90.43.
24h % Change, Volume & Market Cap: Exact real-time 24-hour percentage change, total 24-hour volume, and verified market capitalization are not uniformly confirmed across sources in this snapshot—different listings and trackers display varying figures (for example, ~$94.33 on a CoinMarketCap tracker, ~$92.59 on a spot page, and mixed volume/market-cap readings), and no live API feed was attached. Any figure outside the chart's visible candle (91.09 close) should be treated as indicative rather than a guaranteed live tick.
Liquidity, Volatility & Order Flow: On the 15m volume pane, volume bars show notable activity during the earlier selloff leg from the upper 90s down toward the low 90s, followed by more moderate, choppy volume around the 90.43–92.50 consolidation band. The 91.47 open to 91.09 close candle (-0.39% change, 0.55% intrabar range) indicates controlled, slightly bearish-to-sideways intraday pressure rather than a high-volume breakout.
6. 24-Hour Candlestick Pattern Analysis
Note: Only a 15m chart screenshot was provided; 5m, 1h, 4h, and 1D charts were not attached, so cross-timeframe candlestick specifics outside the 15m view are limited to visible price context and are disclosed as unavailable where not shown.
5m Timeframe: Not provided in the uploaded chart; short-term micro-structure cannot be verified directly.
15m Timeframe (Primary Chart Evidence):
Downtrend & Lower Highs: After printing a prominent upper swing near 99.62, the 15m chart forms a sequence of lower highs and lower lows (sliding through the 96.00, 94.00, and 92.00 handles) accompanied by bearish red candles and intermittent relief bounces.
Wick Rejections & Dip to 90.43: Several candles exhibit upper wicks near resistance zones during minor bounces, while a lower spike pushed down to 90.43 before buyers stepped in to defend the low-91s.
Latest 16:30 Candle: Opens at 91.47 (matching its high, showing immediate overhead supply at the open) and closes lower at 91.09 (-0.39%), with a modest lower shadow down to 90.96.
Volume Confirmation: Earlier sharp drops featured taller red/green volume spikes, whereas recent candles near 91.09 show lighter-to-moderate volume—signaling waning immediate momentum compared to the initial selloff, without yet proving strong accumulation.
1h, 4h & 1D Timeframes: Not provided in the uploaded image; multi-hour and daily candle bodies/wicks cannot be confirmed from visual evidence alone.
7. Complete Technical Indicator Analysis
Note: The uploaded 15m chart displays MA(7) = 91.28, MA(25) = 91.42, MA(99) = NaN (insufficient bars plotted for 99 periods on the visible segment), and Volume (Vol(ANTB) / Vol(USDT)) with moving-average lines. EMA (20, 50, 100, 200), SMA (50, 100, 200), MACD, ADX/DMI, RSI, Stochastic RSI, ROC, Bollinger Bands, ATR, VWAP, OBV, Volume Profile, MFI, Fibonacci levels, and Pivot Points are not plotted on the screenshot and are therefore evaluated qualitatively from price/volume structure or marked as not visible.
Trend Indicators:
Moving Averages on Chart (MA(7) & MA(25)): Price at 91.09 sits slightly below both MA(7) (91.28) and MA(25) (91.42), with MA(7) below MA(25)—a short-term bearish/soft alignment on the 15m chart. MA(99) shows NaN on the visible series.
EMA (20, 50, 100, 200) & SMA (50, 100, 200): Not displayed on the chart; exact values cannot be verified.
MACD & ADX/DMI: Not displayed on the chart. Price structure shows a prior strong downward impulse from 99.62 transitioning into a narrower range near 90.43–92.50, consistent with moderating trend momentum after a prior down-leg.
Momentum Indicators (RSI, Stochastic RSI, ROC):
Not displayed on the screenshot. Visually, the bounce from 90.43 to the low-92s followed by a pullback to 91.09 reflects neutral-to-soft short-term momentum rather than an overextended breakout.
Volatility & Volume Indicators:
Volume & Volume Moving Averages: The latest 15m candle shows Vol(ANTB) 173.30 and Vol(USDT) 15.811K with lower volume averages (768.33 and 609.91 on the displayed legend), indicating quieter participation during consolidation compared to earlier distribution/impulse bars.
Bollinger Bands, ATR, VWAP, OBV, Volume Profile & MFI: Not plotted on the chart. Visually, intrabar range on the latest candle is tight (0.55%, from 90.96 to 91.47), pointing to compressed short-term volatility after a wider multi-point slide from near 99.62.
Levels (Fibonacci Retracement/Extension & Pivot Points):
Not plotted on the screenshot. Using the visible 15m swing high (~99.62) and swing low (90.43) purely as a reference span, the 91.09 level sits very close to the recent swing low, while prior breakdown shelves around 92.00–92.50 and 94.00 act as visual upside reference zones.
8. Market Structure, Smart Money & Derivatives Sentiment
Market Structure & SMC:
Trend & Structure: On the visible 15m chart, price established a series of Lower Highs and Lower Lows (LH/LL) from the ~99.62 peak down to 90.43, followed by a minor higher bounce toward the mid-92s and a retest back toward 91.09.
BOS & CHoCH: Breaking down through the mid-90s and low-92s represented bearish Breaks of Structure (BOS) during the slide. A true bullish Change of Character (CHoCH) on this 15m view would require reclaiming and holding above the recent lower-high swing near 92.50+ rather than merely wicking higher.
Order Blocks, FVGs, Supply/Demand & Liquidity: The prior breakdown leg from roughly 92.50–94.00 leaves overhead supply/bearish order-block interest on rallies, while 90.43 marks an immediate liquidity/stop-hunt reference low just beneath the 91.00 psychological area.
Derivatives & Sentiment:
Open Interest, Funding Rates, Long/Short Ratio & Liquidation Heatmaps: Not provided in the screenshot or verified live feed; do not assume derivatives positioning without live exchange data.
Whale Activity & Fear & Greed Index: Broader market sentiment indicators show elevated fear/caution (with CoinGecko displaying an Extreme Fear reading of 22 alongside multi-week ETF outflows), while early post-listing promotional campaigns can create retail/airdrop flow dynamics on spot order books.
9. Bitcoin & Broader Crypto Market Impact
Bitcoin has been trading around the low-$60,000s (roughly $62,500–$63,800 across recent market snapshots) amid multi-week crypto market pressure and substantial spot ETF outflows, while Ethereum has hovered near the $1,750+ zone and total crypto market cap sits near $2.15T–$2.22T.
For ANTB/USDT, macro and BTC/ETH weakness creates a headwind for sustained risk-on breakouts across digital assets. At the same time, because ANTB is a tokenized equity linked to Anthropic's public listing rather than a pure-play Layer-1 or meme coin, its price action is influenced by a dual dynamic: broader crypto liquidity/risk appetite and equity/AI market sentiment around Anthropic's stock.
10. Key Support & Resistance Levels
TierSupport Levels (Downside)Resistance Levels (Upside)Chart / Structural NotesImmediate90.96 – 91.0991.28 – 91.47Latest 15m low (90.96) and close (91.09) vs. MA(7) (91.28), MA(25) (91.42), and latest open (91.47)Strong90.43 (followed by 90.00 round level)92.00 – 92.50Visible 15m swing low (90.43) below vs. recent bounce highs / 92.00 handle aboveMajorSub-90.00 discovery zone (no lower chart floor visible)94.00 and 96.00 – 99.62Prior 15m breakdown shelves (94.00, 96.00) and visible chart peak (99.62)
Bullish Breakout Trigger: A decisive 15m close and hold above 92.50 (clearing recent minor bounce highs and both short moving averages), opening a push toward 94.00.
Bearish Breakdown Trigger: A clean 15m breakdown below 90.43 (and 90.00), exposing unverified lower price discovery below the chart's visible floor.
11. Bullish, Bearish & Neutral Price Scenarios
Bullish Scenario:
Setup & Triggers: Buyers defend 90.43–91.00, reclaim MA(7) (91.28) and MA(25) (91.42), and break above 92.50 with rising green volume.
Targets & Catalysts: Upside targets at 94.00, then 96.00, supported by stabilizing AI/equity sentiment, easing crypto ETF outflows, and spot/Convert demand.
Bearish Scenario:
Setup & Triggers: Rejection near 91.47–92.50 followed by a breakdown below 90.43 on expanding red volume.
Targets & Catalysts: Downside continuation below 90.00 into lower price discovery, driven by post-airdrop selling, broader equity/tech pullbacks, or continued crypto ETF outflows.
Neutral Scenario:
Setup & Triggers: Range-bound oscillation between 90.43 support and 92.50 resistance as volume remains moderate and moving averages flatten.
Confirmation: Repeated wicks on both sides without a confirmed 15m close outside 90.43–92.50.
12. Trading Strategy & Risk Management
Short-Term Approach (15m Scalping / Intraday Swing):
Range/Breakdown Discipline: Avoid chasing mid-range entries around 91.09 without clear confirmation. Aggressive short setups typically look for rejections near 91.47–92.50 (with stops placed just above the rejection wick/resistance, e.g., above 92.60) or confirmed breakdowns below 90.43 (with stops back above 91.50). Conservative long setups wait for a confirmed reclaim and hold above 92.50 (with stops below 91.30–91.40 or 90.40 depending on volatility), targeting 1:2 or better risk-to-reward toward 94.00+.
Medium-Term Approach (Multi-Day / Position):
Newly listed tokenized equities carry high early volatility, evolving liquidity, and potential promotional/airdrop supply overhang. Size positions conservatively so a single adverse move does not impair portfolio capital, and verify eligibility/jurisdictional rules before trading.
Invalidation & Stand-Aside Conditions:
Invalidate a bullish 15m bounce thesis on a close below 90.43; invalidate a bearish continuation thesis on a sustained close above 92.50–94.00. Stay out of the market during low-liquidity whipsaws around major announcements, thin order-book pockets, or when risk-to-reward is under 1:1.5—and never rely on high leverage in newly listed or volatile assets.
13. Final Global Market Conclusion & Analyst Outlook
Global Crypto Market & Bias: Broader crypto markets are navigating heavy headwinds—including substantial November spot BTC and ETH ETF outflows, equity/AI market volatility, and BTC trading in the low-$60,000s—keeping the immediate macro backdrop cautious/bearish until inflows and key resistance levels stabilize.
Strongest Drivers for ANTB: High profile around Anthropic's public listing, spot/Convert accessibility, and promotional campaigns drive attention, while on the 15m chart 90.43 support versus 91.28–92.50 overhead resistance and moving averages defines the immediate battleground.
Key 24–48 Hour Levels: Watch 90.43 (and 90.00) on the downside and 91.47 followed by 92.50 (and 94.00) on the upside.
Medium-Term Outlook & Key Risks: Medium-term direction depends on sustained demand for tokenized equity exposure, underlying equity performance, and healthier crypto liquidity. Key risks include deeper equity/tech drawdowns, continued ETF outflows, post-airdrop token selling, liquidity gaps, and regulatory/jurisdictional restrictions.
OVERALL CRYPTO MARKET BIAS: BEARISH — (Persistent November spot BTC and ETH ETF outflows alongside equity/AI volatility and BTC trading in the low-$60,000s keep broader market momentum pressured.)
SELECTED COIN MARKET BIAS: BEARISH — (The 15m chart reflects a broader slide from near 99.62 with price at 91.09 below MA(7) and MA(25) and testing above the 90.43 low amid cautious market conditions.)