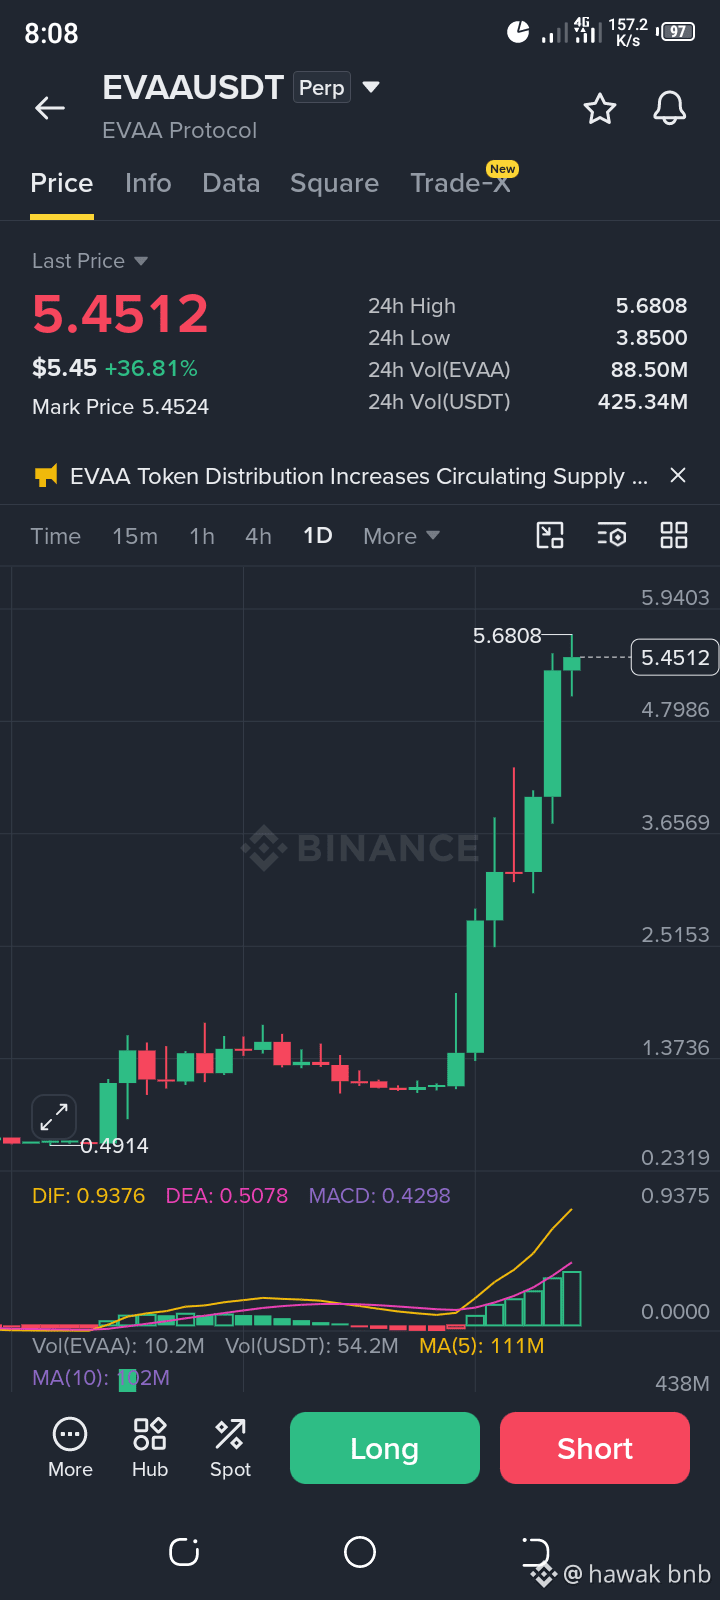
Technical Analysis of EVAAUSDT (1D Chart):
EVAAUSDT is currently trading around $5.4512, reflecting a strong +36.81% gain over the last 24 hours. On the daily (1D) chart, a powerful bullish rally from the $0.4914 low has pushed price action up to a $5.6808 high.
The MACD indicator confirms strong upward momentum (DIF: 0.9376, MACD: 0.4298), backed by a 24-hour trading volume of $425.34M USDT. However, the on-screen notice regarding "increased circulating supply" combined with an extended vertical move raises the chance of short-term profit-taking or pullbacks.@evaa- Key immediate resistance sits near $5.6808, with support around $4.80. #EVAAUSDT🔻 #NvidiaBoardReportedlySplitOverHuang’sReturn #CanGTA6'sLaunchLiftTTWOShares? #LedgerProbesTamperedWalletsInBerlinAndDubai #BTCRemainsUnderPressureAfterHawkishFOMCMinutes $EVAA
EVAAUSDT is currently trading around $5.4512, reflecting a strong +36.81% gain over the last 24 hours. On the daily (1D) chart, a powerful bullish rally from the $0.4914 low has pushed price action up to a $5.6808 high.
The MACD indicator confirms strong upward momentum (DIF: 0.9376, MACD: 0.4298), backed by a 24-hour trading volume of $425.34M USDT. However, the on-screen notice regarding "increased circulating supply" combined with an extended vertical move raises the chance of short-term profit-taking or pullbacks.@evaa- Key immediate resistance sits near $5.6808, with support around $4.80. #EVAAUSDT🔻 #NvidiaBoardReportedlySplitOverHuang’sReturn #CanGTA6'sLaunchLiftTTWOShares? #LedgerProbesTamperedWalletsInBerlinAndDubai #BTCRemainsUnderPressureAfterHawkishFOMCMinutes $EVAA