

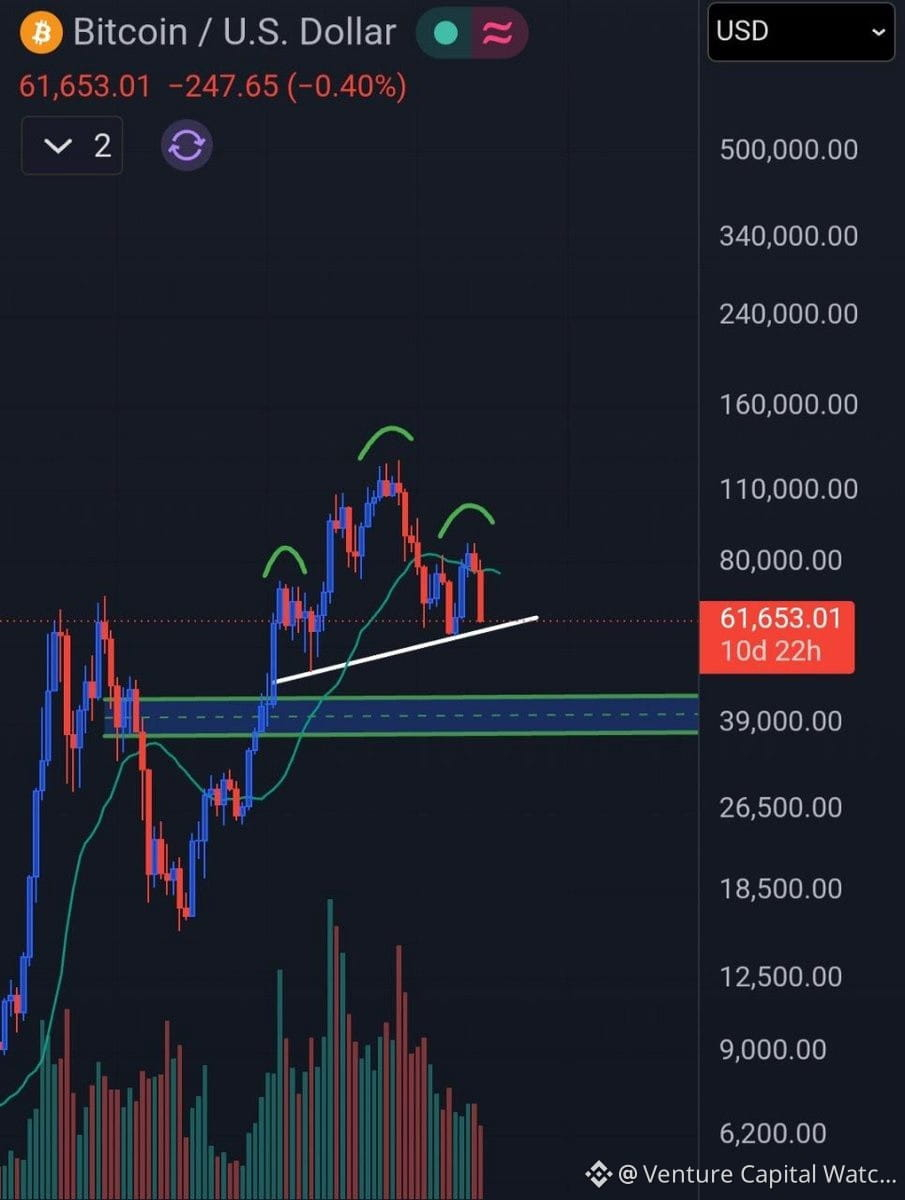
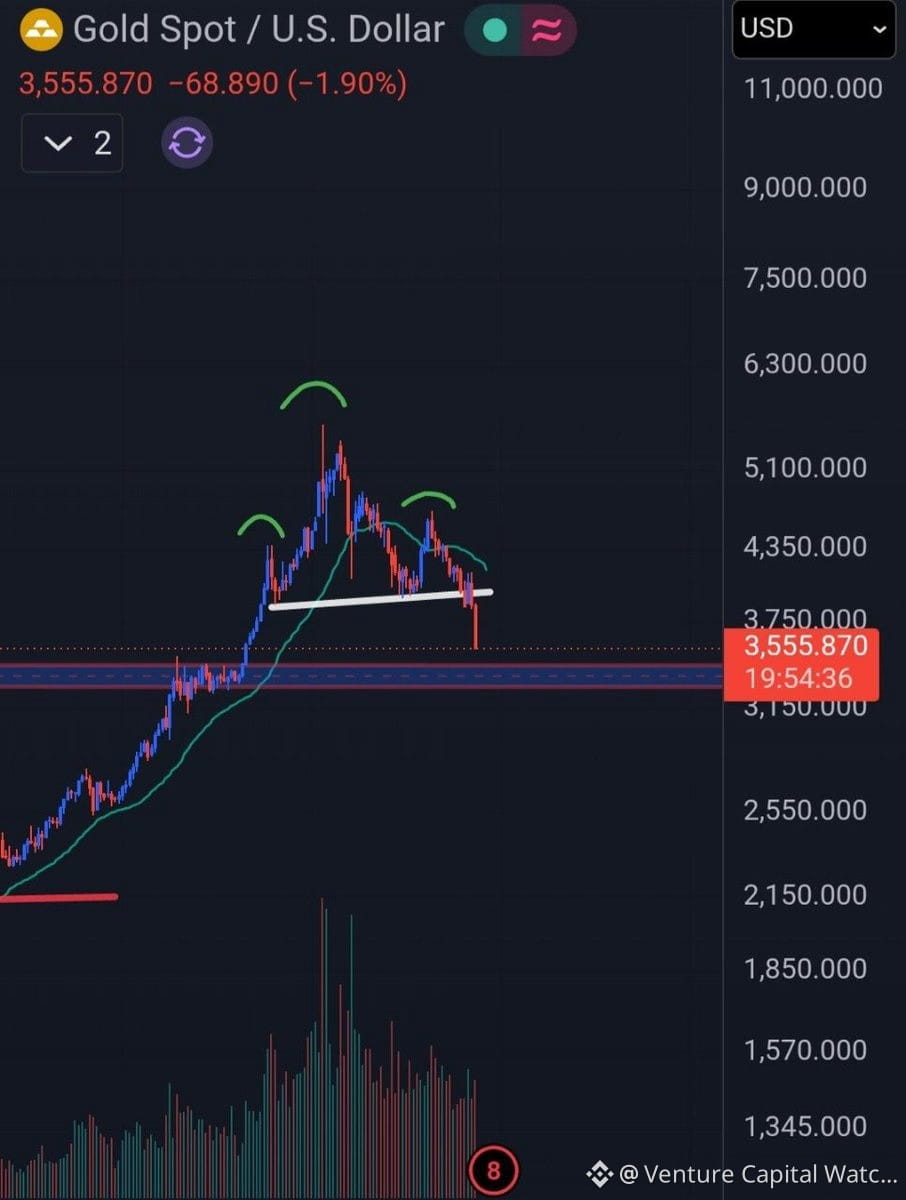
Comparing gold's weekly performance against $BTC monthly shows diverging macro narratives. Gold typically tracks real rates and geopolitical risk premiums on shorter timeframes. $BTC monthly charts reflect broader liquidity cycles and institutional positioning shifts. If gold's weekly volatility is compressing while $BTC monthly consolidates, watch for liquidity rotation signals. Gold strength often precedes risk-off moves that initially hit crypto harder before institutional buyers step in. The key question: is this correlation breakdown or just timing mismatch? Monitor DXY and real yields for directional confirmation.
Krypto-Nutzer weltweit auf Binance Square kennenlernen
⚡️ Bleib in Sachen Krypto stets am Puls.
💬 Die weltgrößte Kryptobörse vertraut darauf.
👍 Erhalte verlässliche Einblicke von verifizierten Creators.
E-Mail-Adresse/Telefonnummer