
LTC's lower high caps a bounce on fading participation
🔴 $LTC - SHORT
Trade Plan:
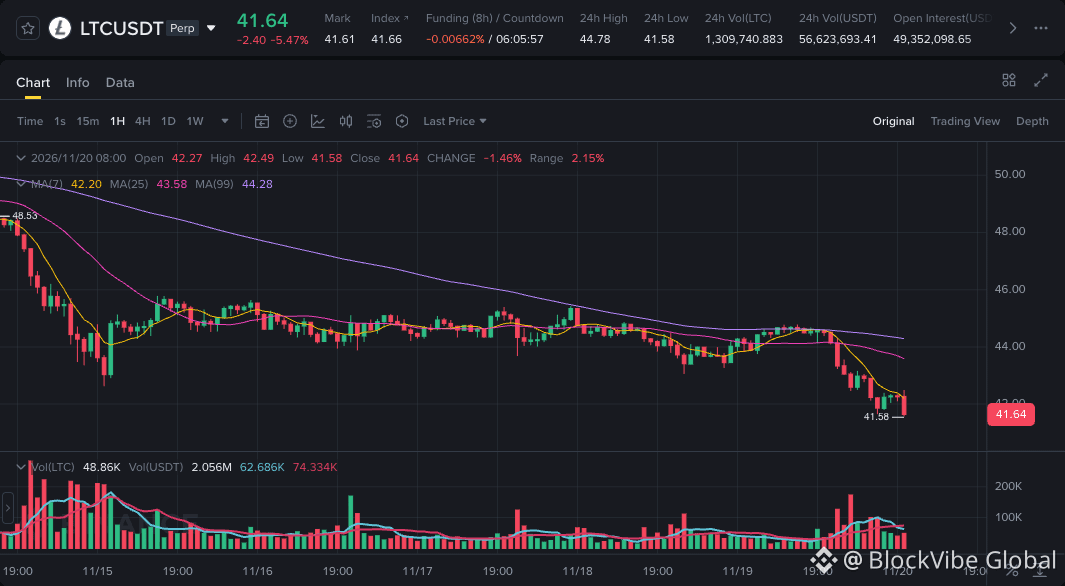
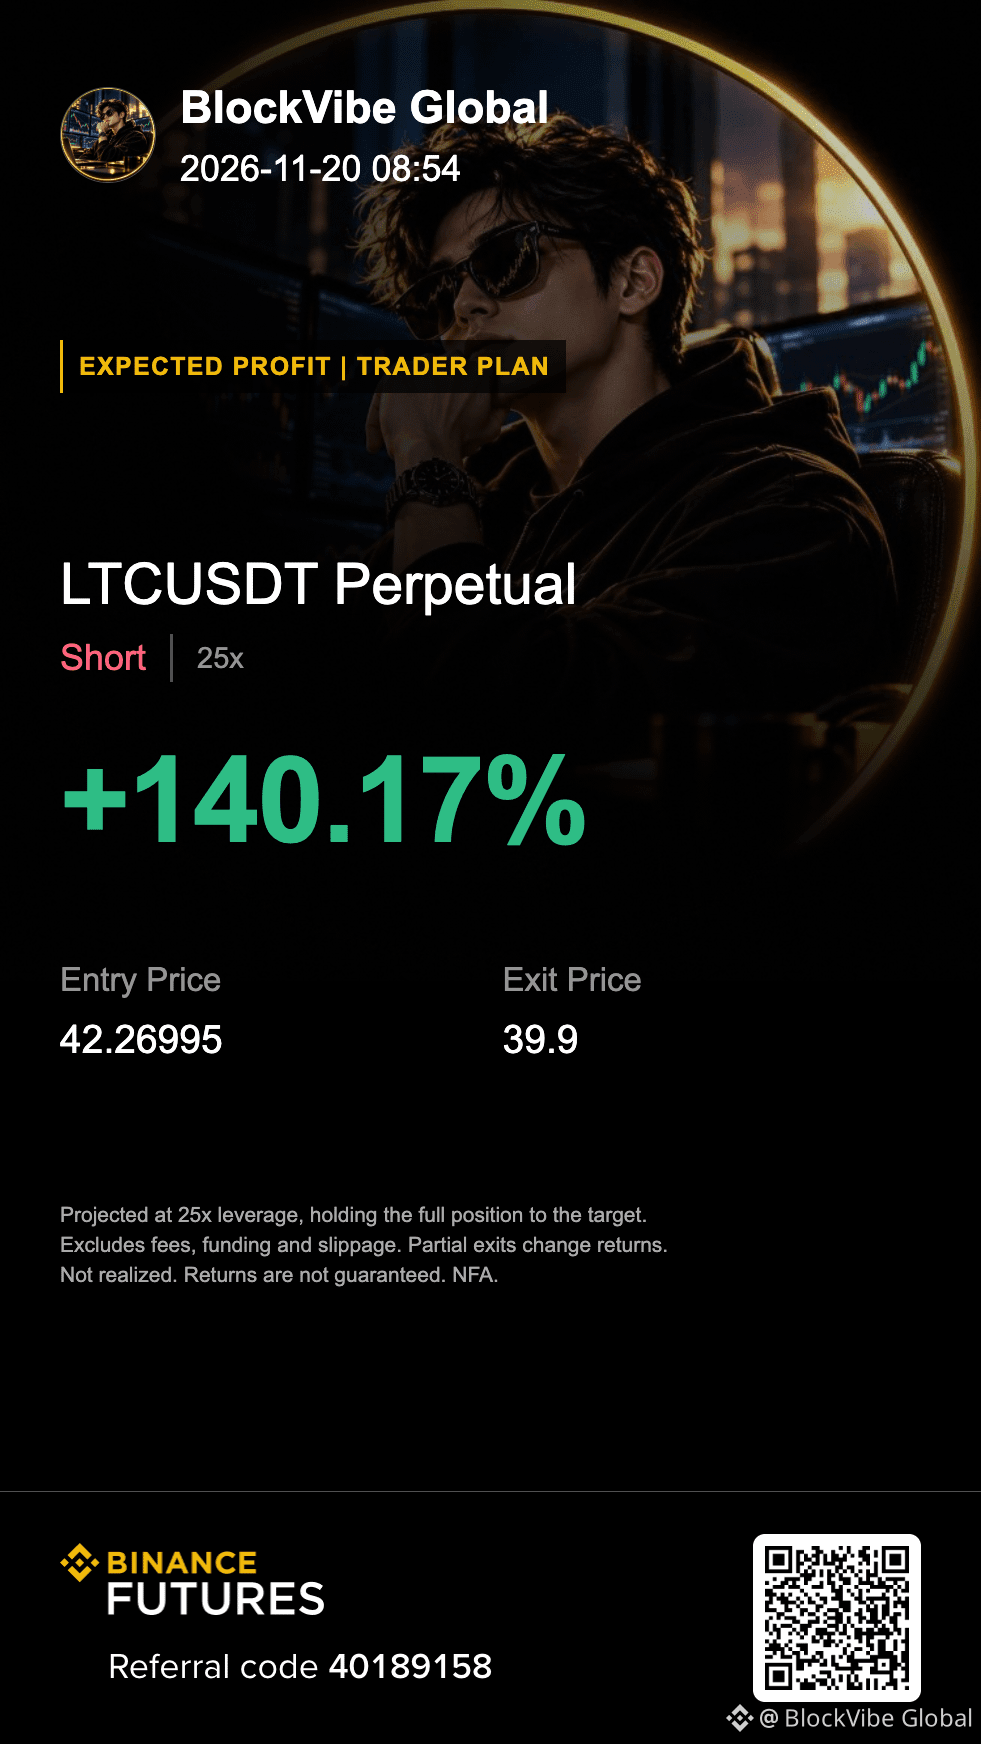
Entry Zone: 41.8111 – 42.7288
SL: 43.2000
TP1: 41.2000 | TP2: 40.6000 | TP3: 39.9000
Why this setup?
- The last two closed 4h candles printed a lower high and lower low, so the 41.8111–42.7288 band reads as supply overhead.
- 15m RSI(14) at 41.7 is soft but not oversold, so a lift into the band can still meet sellers rather than a reversal.
- The last closed 15m candle was 0.49x its twenty-candle mean, thin participation that undercuts any bounce case.
Funding at -0.0063% is mildly negative and open interest fell 0.30%, so positions are unwinding without a clear long build behind the dip.
Risk: A 4h close back above 42.7288 with expanding volume would invalidate the lower-high read.
Is the thin tape a sign of exhaustion, or just a pause before buyers step in?
DYOR & manage risk!
$LTC
🔴 $LTC - SHORT
Trade Plan:
Entry Zone: 41.8111 – 42.7288
SL: 43.2000
TP1: 41.2000 | TP2: 40.6000 | TP3: 39.9000
Why this setup?
- The last two closed 4h candles printed a lower high and lower low, so the 41.8111–42.7288 band reads as supply overhead.
- 15m RSI(14) at 41.7 is soft but not oversold, so a lift into the band can still meet sellers rather than a reversal.
- The last closed 15m candle was 0.49x its twenty-candle mean, thin participation that undercuts any bounce case.
Funding at -0.0063% is mildly negative and open interest fell 0.30%, so positions are unwinding without a clear long build behind the dip.
Risk: A 4h close back above 42.7288 with expanding volume would invalidate the lower-high read.
Is the thin tape a sign of exhaustion, or just a pause before buyers step in?
DYOR & manage risk!
$LTC