

Disclosure: It is not financial advice.
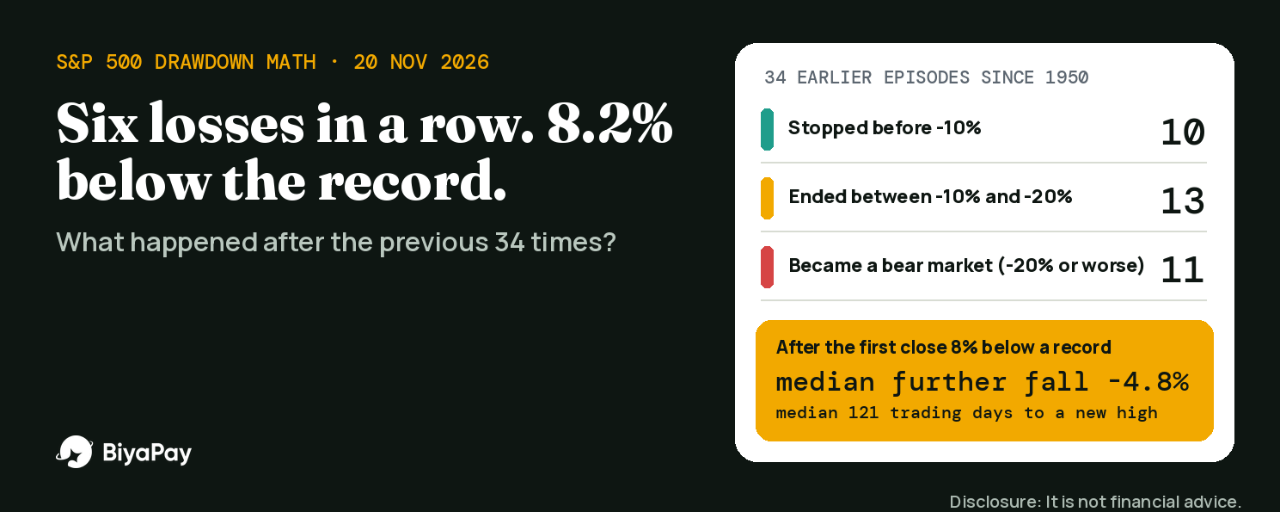
On Thursday 19 November 2026 the S&P 500 fell 2.02% to 7,175.83, its sixth straight loss, according to CNBC. AP described it as the longest losing streak in two and a half years and put the index 8.2% below the all-time high set last month.
A line like that makes people ask two things: "how bad can it get?" and "how long until it is back?" I did not want to answer from feeling, so I pulled the index history and counted.
What the last six days look like
I used Yahoo Finance daily closes for the S&P 500 (the price index, so dividends are excluded). The record close is 7,818.93 on 6 October 2026. The last close, 7,175.83, is 8.22% below it.
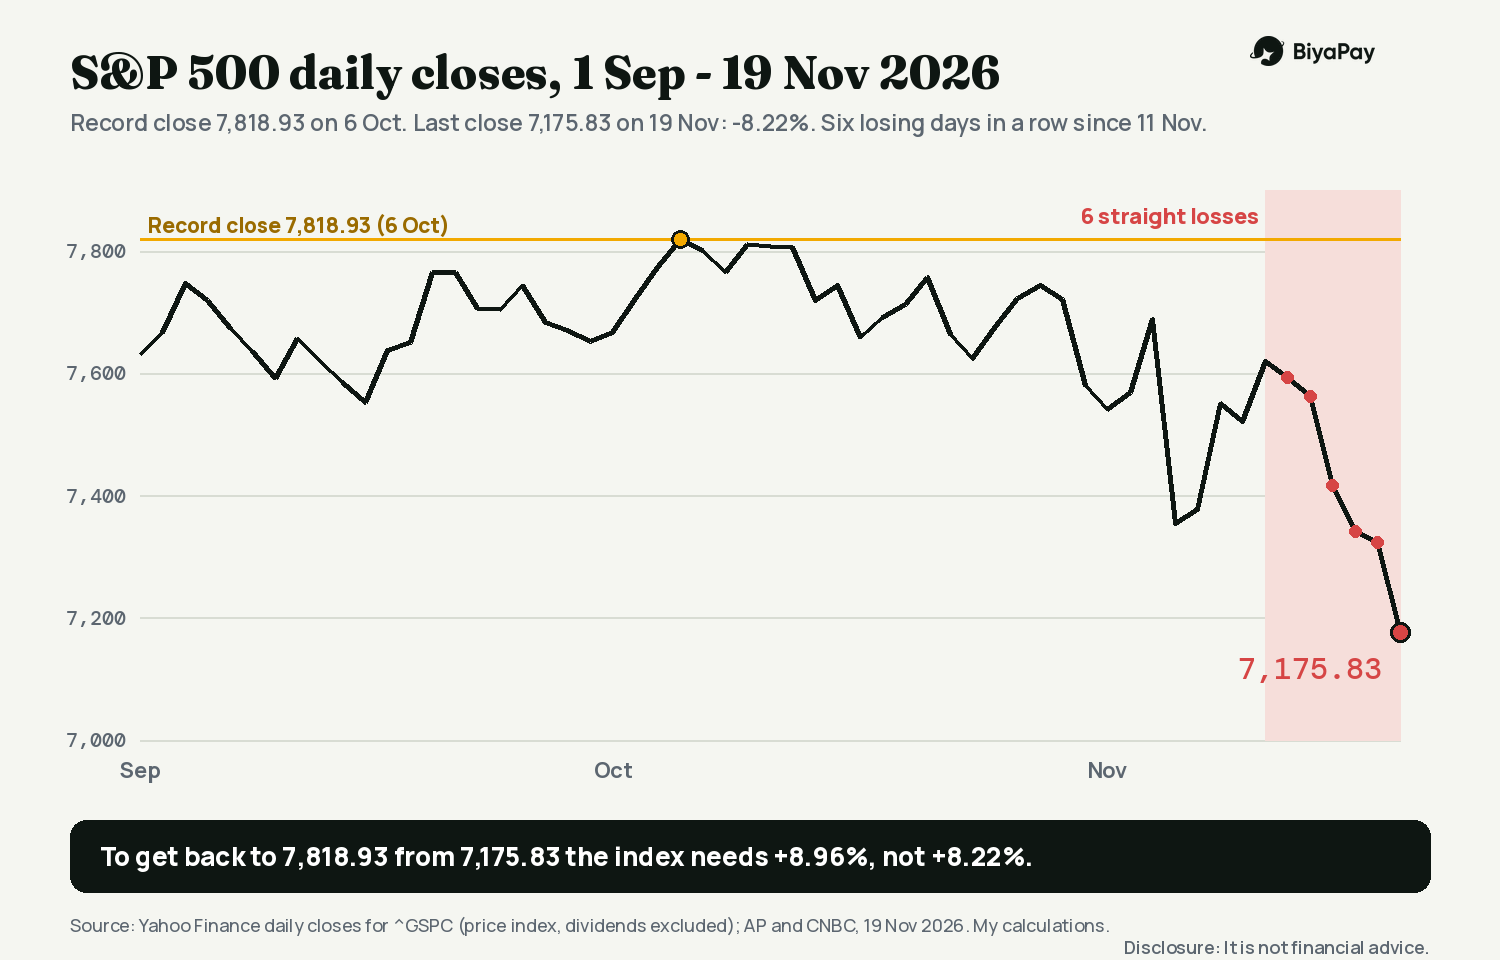
The six losing days are 12 to 19 November. Together they took the index from 7,619.38 (11 November) to 7,175.83, a fall of 5.82%. The other 2.5% came earlier, between the record and 11 November.
The first piece of arithmetic: why recovery needs more than 8.22%
Losses and gains are not symmetric. If $10,000 was invested at the record close, it is $9,177.51 today. To get back to $10,000 it needs to gain $822.49, which is +8.96% on the smaller base.
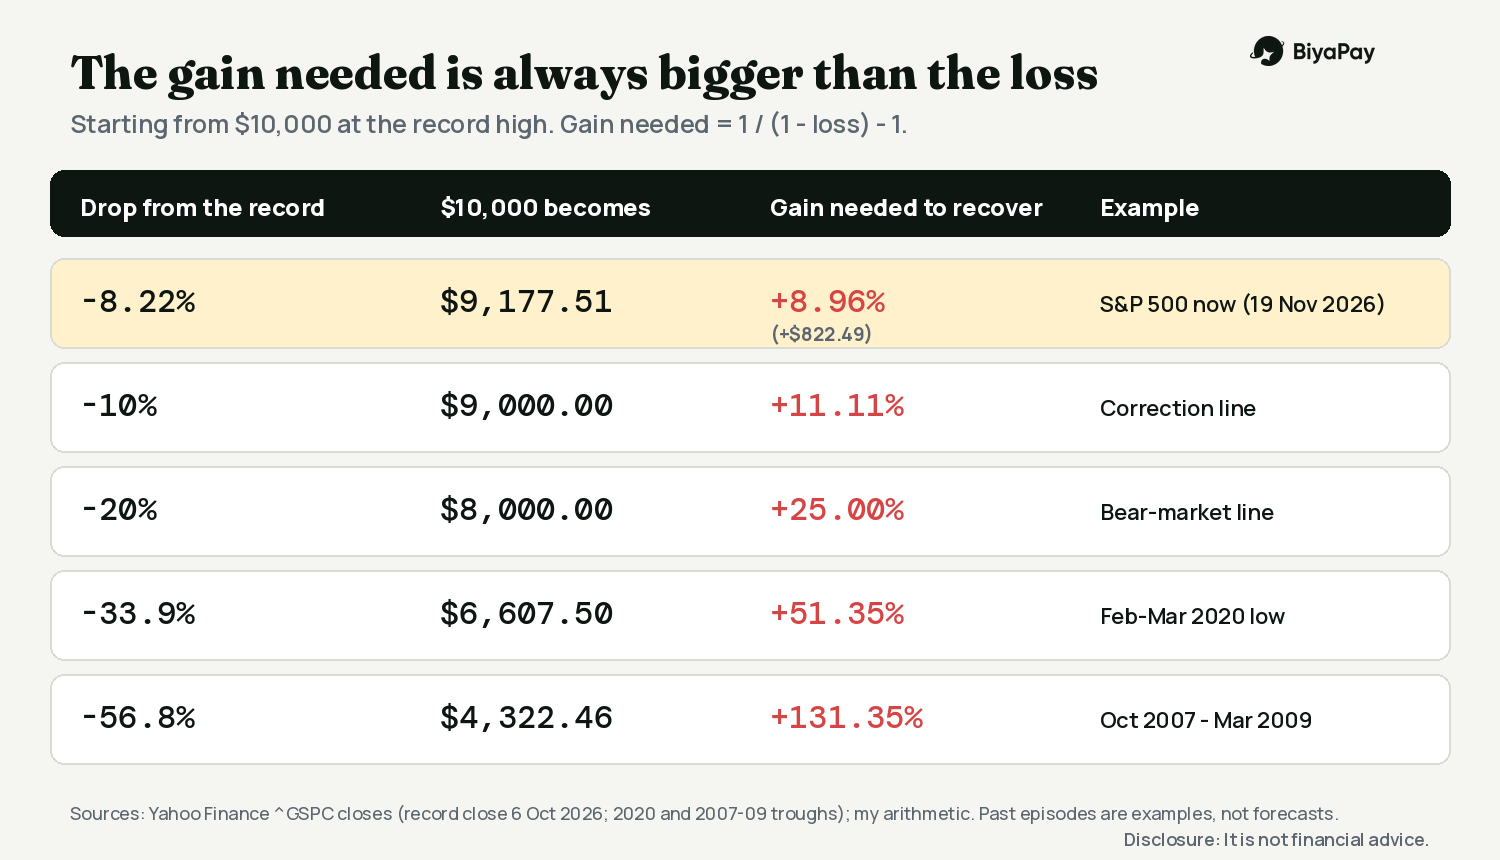
The same formula gets steep fast. A 20% fall needs a 25% gain. The 2020 low, 33.9% below the peak, needed 51.35%. The 2007 to 2009 low, 56.8% below, needed about 131%. I am not saying that is where we are going. I am saying the cost of a deeper fall is not linear.
What happened after the previous 34 times
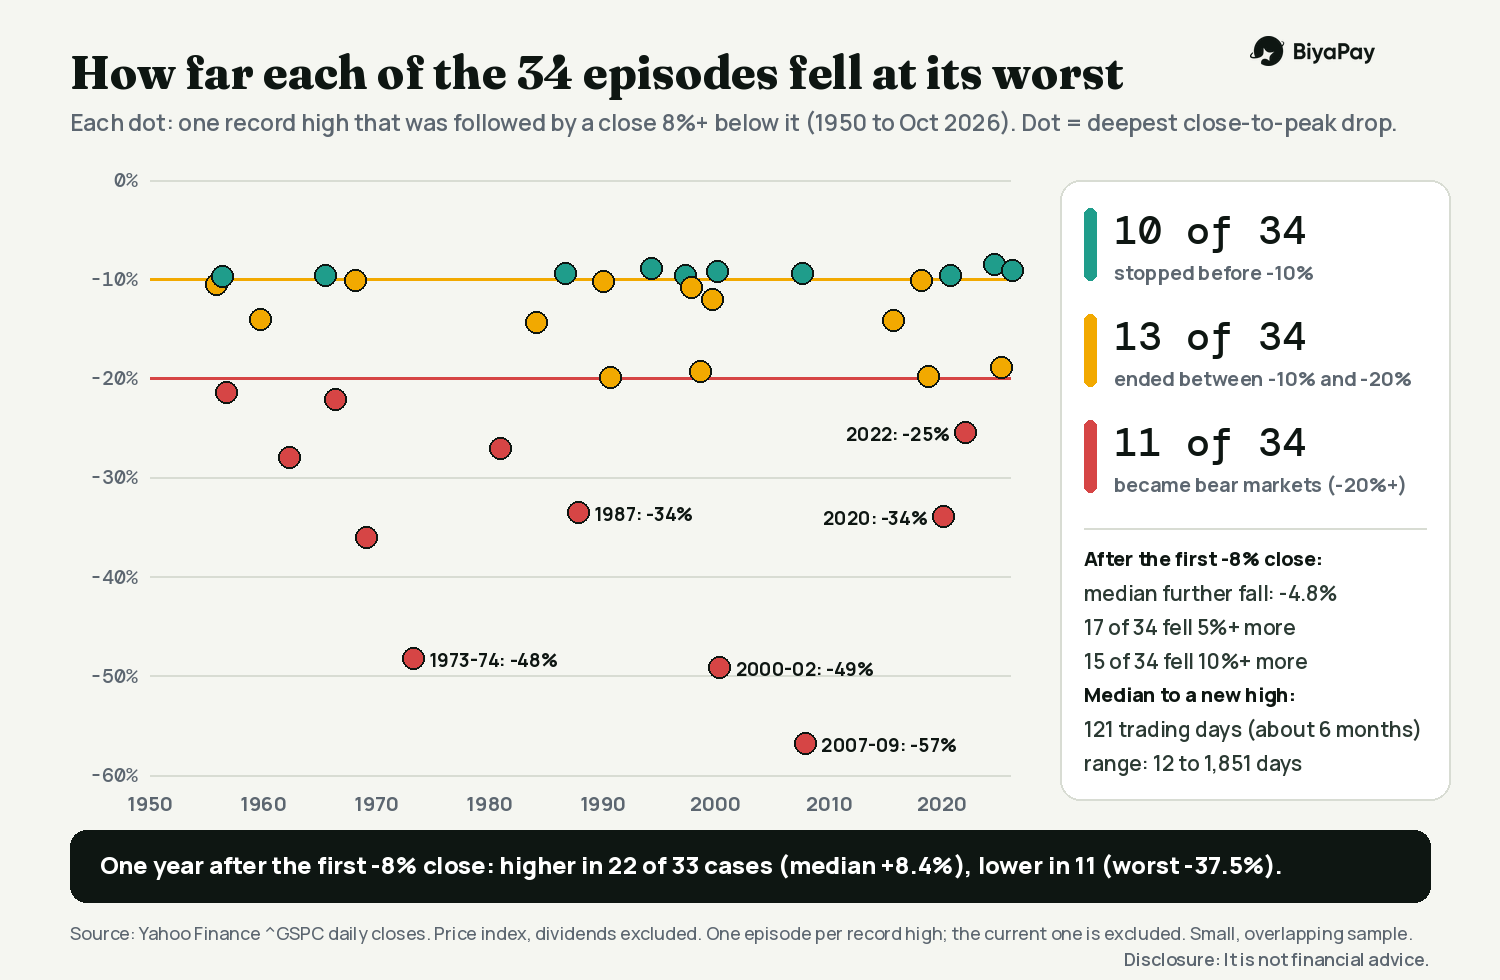
Next I counted every time since 1950 that the S&P 500 first closed at least 8% below a record high. I counted one episode per record high and left out the current one. That gives 34 episodes, and all 34 have since made a new closing high.
How they ended:
- 10 of 34 stopped before reaching -10%
- 13 of 34 ended between -10% and -20%
- 11 of 34 became bear markets of -20% or worse (with troughs in 1957, 1962, 1966, 1970, 1974, 1982, 1987, 2002, 2009, 2020 and 2022)
After that first close 8% below a record, the median further fall was 4.8%. In 17 of the 34 cases the index fell at least another 5%, in 15 at least another 10%, and in 8 at least another 20%.
On the other side, the median time from the first -8% close to a new closing high was 121 trading days, about six months. The range is wide: 12 days in March-April 2026, 32 days in 2024, and 1,851 days after 1973.
One year after that first close, the index was higher in 22 of the 33 episodes that have a full year of data behind them, with a median change of +8.4%. It was lower in 11, and the worst was -37.5% from November 2007.
Reading it honestly: this is close to a coin flip on whether the first -8% is the worst of it. The sample is small, the episodes overlap with very different backdrops, and price-only data understates recoveries because dividends are left out.
What this is not telling you
It covers the broad US index, not a single stock. AMD lost nearly 8% on Thursday after Hunterbrook Capital disclosed a short position (CNBC), which is a different kind of risk from an index drifting lower.
It also says nothing about this exact cycle. The Fed's October minutes showed officials open to more rate hikes, and futures were pricing a 25 basis point hike for December (Straits Times, 19 November). The 10-year Treasury yield was about 5.05% on Thursday (CoinDesk). Many of the 34 episodes came with different rate backdrops, so I treat them as a range of outcomes, not a forecast.
What you can do with BiyaPay: the S&P 500 through an ETF
If someone wants S&P 500 exposure without picking stocks, the usual route is an ETF. BiyaPay's public pages list the three biggest S&P 500 funds: VOO, SPY and IVV. I checked them signed out on 20 November 2026 at about 05:17 to 05:19 WIB.
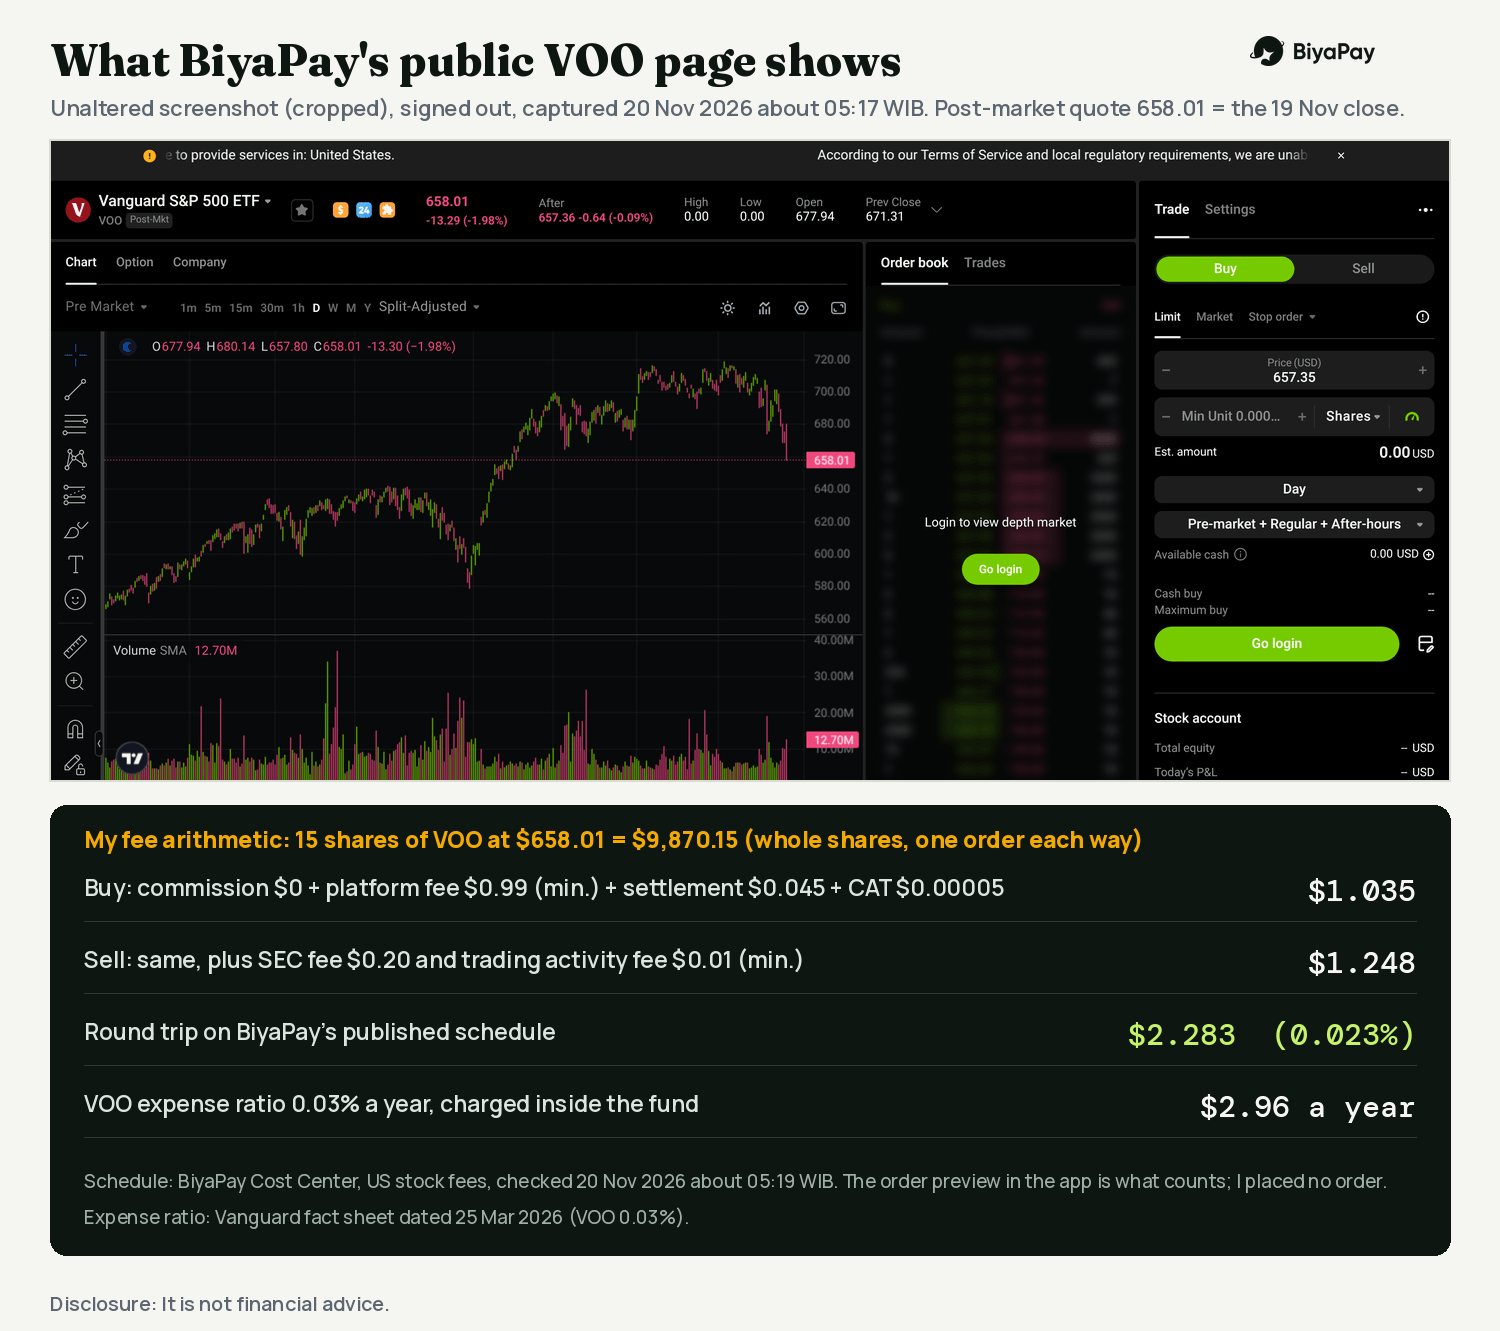
- What is shown: VOO showed a post-market price of 658.01, equal to its 19 November close in Yahoo's data. SPY showed 715.87 and IVV 719.05, which also match. The order panel shows Buy and Sell, Limit, Market and Stop order, and a session choice of pre-market, regular and after-hours
- Requirements: the page says BiyaPay cannot provide services in the United States. Trading needs a sign-in; I stopped at the login and did not open an account for this article
- Fees: on BiyaPay's Cost Center, US stock commission is $0, platform fee is $0.005 per share with a $0.99 minimum per order and a 1% cap, settlement is $0.003 per share, and SEC and trading activity fees apply to sells. On 15 whole shares of VOO ($9,870.15) my arithmetic gives $1.035 to buy and $1.248 to sell, $2.283 in total, or 0.023%
- Fund cost: VOO and IVV charge a 0.03% expense ratio and SPY 0.0945%, according to their fund documents. On $9,870 that is about $2.96 a year for VOO
- Not verified: minimum deposit, deposit methods and limits sit behind the login, and I have not checked whether any of these ETFs allows fractional orders. I would check both in the app before planning around them
Fees are not the reason to buy or not buy. At this size they are tiny next to the market moving 2% in a day, which is why I would spend my effort on position size instead.
My opinion
I do not know if 7,175.83 is the low, and the 34 episodes say nobody should be confident either way. What I take from them is simpler.
First, size matters more than timing. If a 20% fall, which would turn $10,000 into $8,000, would force me to sell something I need, the position is too big already.
Second, if I add, I would add in steps decided in advance, not all at once because of a headline. On an account this size, splitting into a few whole-share orders costs about $1 in fees per order.
Third, I would not use leverage into a streak like this. A drawdown that history says can run another 5% to 10% is exactly when forced selling hurts.
When this applies, and when it does not
This applies to a broad US stock index and to someone who can hold for years. It does not apply to single stocks, to leveraged or short-term products, to money needed within a year, or to anyone who cannot sleep at -20%. The statistics are from price data, and a different definition of an episode would give slightly different counts.
Checklist I use
- Write down the drop I could accept before I buy, in dollars, not in percent
- Remember that recovery math is not symmetric: -20% needs +25%
- Check whether I am looking at an index, an ETF or a single stock
- Decide the buying steps in advance, with a date or a level, not in the middle of a red day
- Read the order preview for fees before confirming, and the fund's expense ratio once
- Confirm the service is available in my country and what the deposit route costs
- Do not borrow to buy a falling market
Sources (all checked 20 November 2026, Asia/Jakarta): CNBC, "Stock market news for Nov. 19, 2026"; AP, "Wall Street tumbles to its longest losing streak since 2024 as the Dow drops 1,100 points" (19 November 2026); Straits Times, "Wall Street ends mixed after Nvidia earnings and Fed minutes" (19 November 2026); CoinDesk live updates, 19 November 2026; Yahoo Finance daily closes for ^GSPC (1950 to 19 November 2026), VOO, SPY and IVV; BiyaPay VOO, SPY and IVV pages and Cost Center US stock fees (20 November 2026); Vanguard VOO fact sheet (25 March 2026); iShares IVV prospectus (31 July 2026); State Street SPY prospectus (0.0945%). Episode counts, streak sums and fee arithmetic are my own calculations.