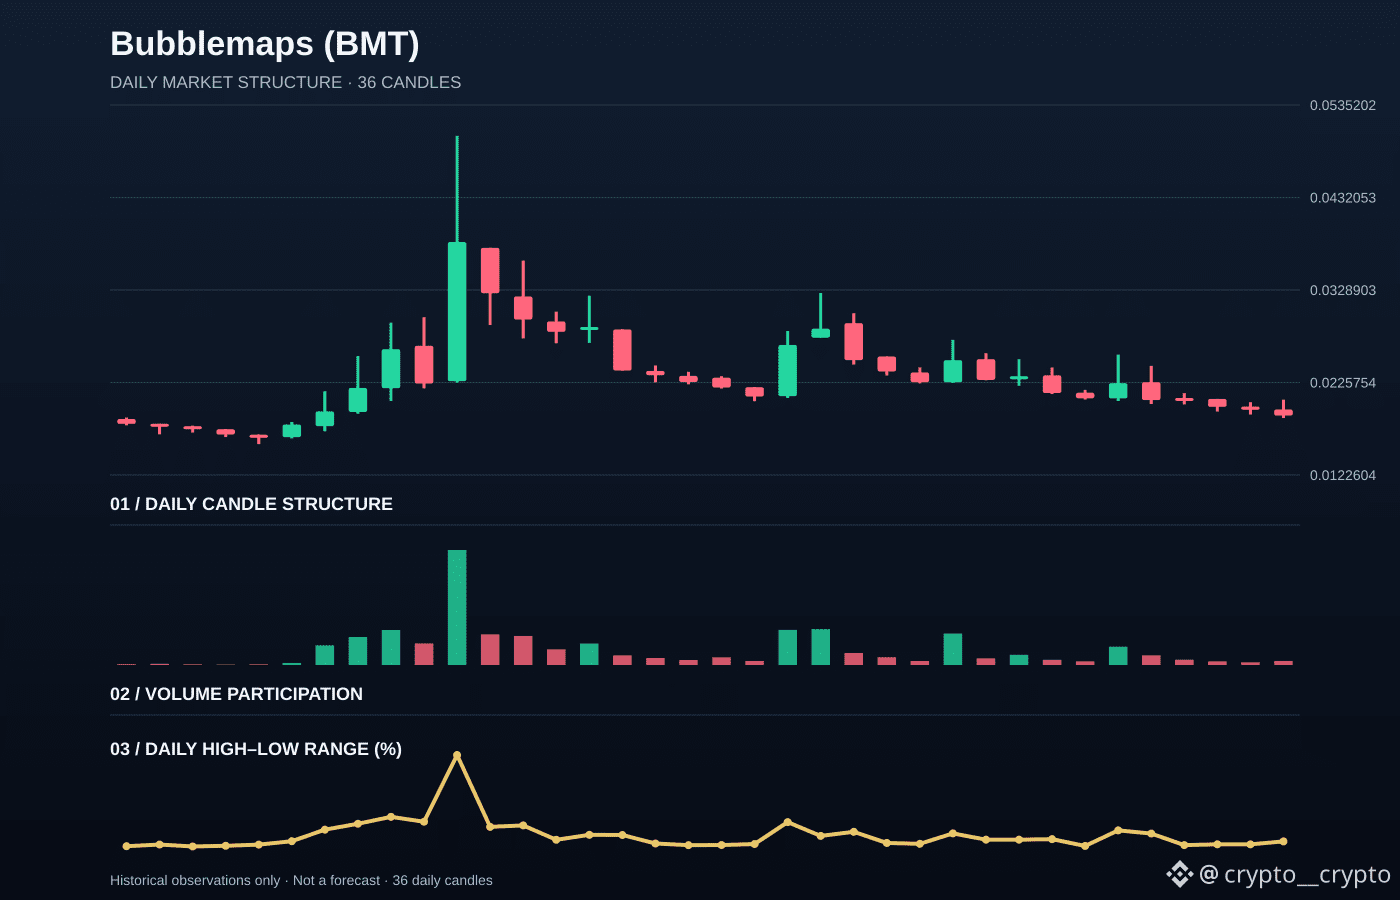
Bubblemaps (BMT) declined 3.36% between the last two available daily closes. The detail I am watching is how that move finished, not just the headline percentage.
The daily close sat in the lower part of its range, showing sellers retained more of the session move. A recovery close would suggest supply is easing; another weak close would keep downside pressure in focus.
BMT is worth tracking at the next daily close: does the market accept the latest price area, or reject it? The latest candle covered 11.04% from low to high, with OHLC: 0.019559416 / 0.020666296 / 0.018610926 / 0.018883247.
For context, the 24-hour market move is +6.44%, while reported turnover is approximately 41.22M USD. CoinMarketCap rank: #698. Benchmark snapshot: BTC +0.96% · ETH +1.52%.
Are you reading BMT as continuation or a pause? Explain the price level behind your view.
Data note: CMC listings market quote and CoinLore daily candles. These are observed market figures, not a price prediction or a trade instruction.
$BMT $BTC $ETH
The daily close sat in the lower part of its range, showing sellers retained more of the session move. A recovery close would suggest supply is easing; another weak close would keep downside pressure in focus.
BMT is worth tracking at the next daily close: does the market accept the latest price area, or reject it? The latest candle covered 11.04% from low to high, with OHLC: 0.019559416 / 0.020666296 / 0.018610926 / 0.018883247.
For context, the 24-hour market move is +6.44%, while reported turnover is approximately 41.22M USD. CoinMarketCap rank: #698. Benchmark snapshot: BTC +0.96% · ETH +1.52%.
Are you reading BMT as continuation or a pause? Explain the price level behind your view.
Data note: CMC listings market quote and CoinLore daily candles. These are observed market figures, not a price prediction or a trade instruction.
$BMT $BTC $ETH