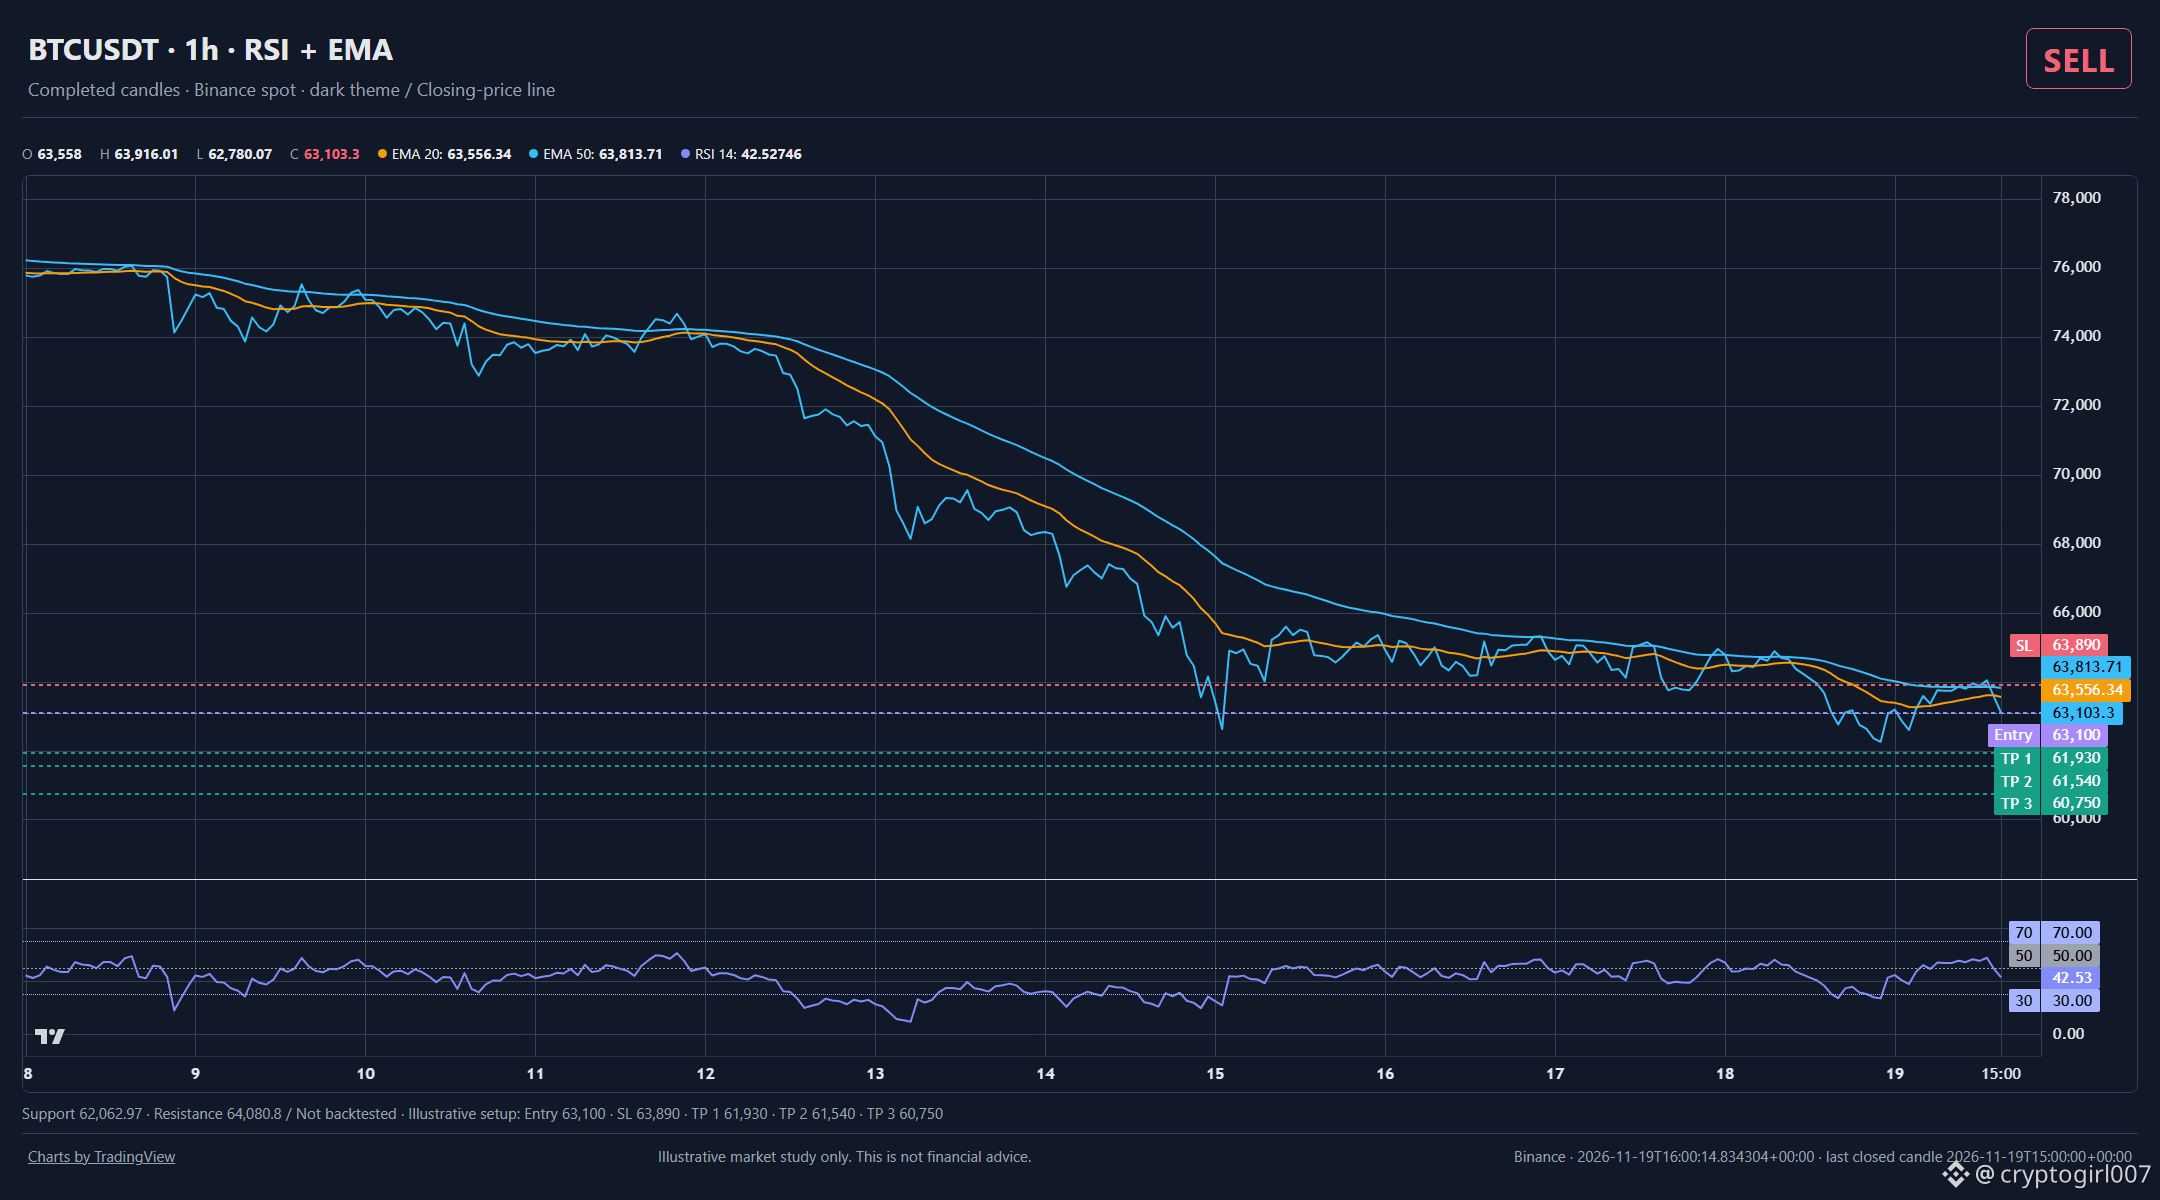
The faster moving average crossing below the slower one confirms downward momentum, making this structural relationship critical for validating the bearish bias.
$BTC is showing a bearish setup on the hourly chart.
RSI supports the bearish reading. Price is below both EMAs, with the faster average below the slower one. This supports the Sell signal. The last closed candle was around 63,100 USDT. Support sits near 62,060, with resistance around 64,080.
The illustrative short setup uses an entry near 63,100, a stop near 63,890 and targets around 61,930, 61,540, 60,750.
Closed-candle analysis, not a live quote or trade instruction; not backtested.
#MarketStructure #ChartAnalysis
Illustrative market study only. This is not financial advice.
$BTC is showing a bearish setup on the hourly chart.
RSI supports the bearish reading. Price is below both EMAs, with the faster average below the slower one. This supports the Sell signal. The last closed candle was around 63,100 USDT. Support sits near 62,060, with resistance around 64,080.
The illustrative short setup uses an entry near 63,100, a stop near 63,890 and targets around 61,930, 61,540, 60,750.
Closed-candle analysis, not a live quote or trade instruction; not backtested.
#MarketStructure #ChartAnalysis
Illustrative market study only. This is not financial advice.