#bitcoin #CryptoQuant
📉 $BTC in the "value zone" — is it time to buy the dip, or is it too early?
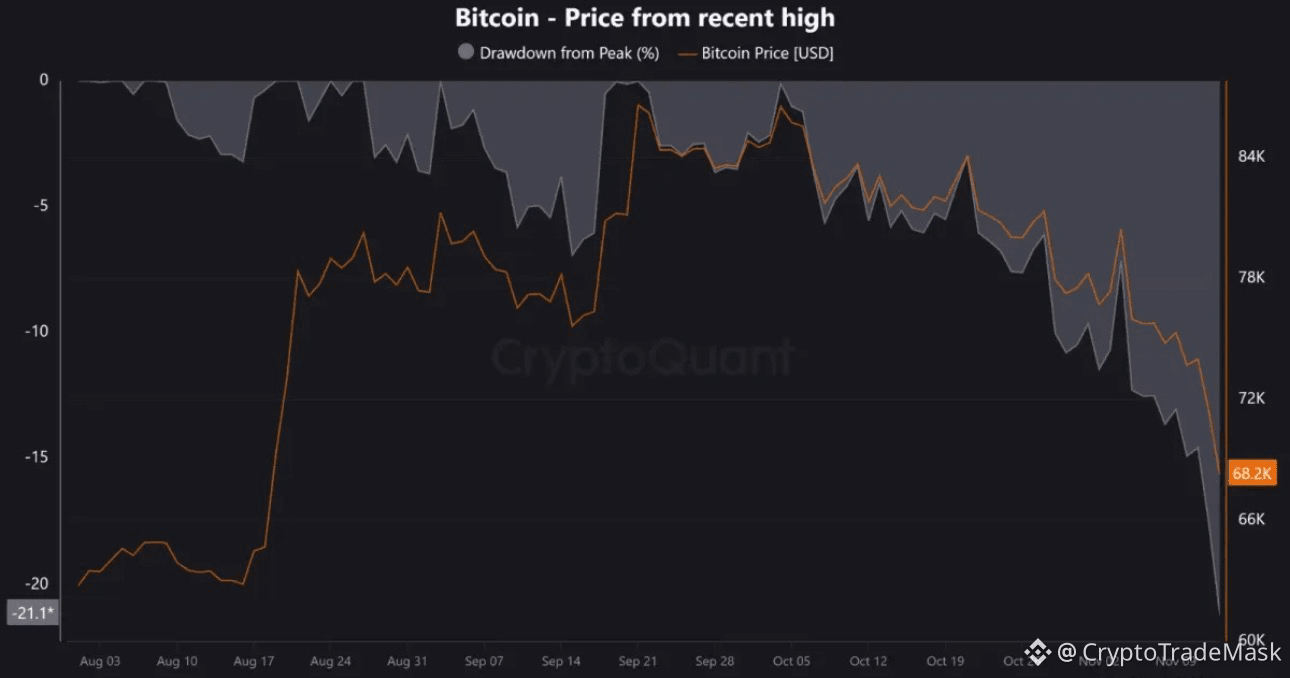
After falling to $61,000 (a 4-month low), BTC has stabilized around $63,700 (-21.8% for the month). According to analysts at CryptoQuant, the market has officially entered a bearish phase, having lost key moving averages-the 200-day ($72,900) and the 365-day ($75,900)-which now act as significant resistance levels.
📊However, the situation is not entirely clear-cut. Here are the key takeaways from the latest report:
🔴 Factors weighing on the price (bearish signals):
Institutional outflows: U.S. spot Bitcoin ETFs saw $2.89 billion in outflows during November (with outflows recorded in 11 out of 13 trading sessions).
Capitulation and losses: Over the last 30 days, investors have realized $8.4 billion in net losses, with $5.4 billion occurring in just the last few days.
Declining liquidity: Market depth has shrunk by 38% following the disruption on Binance in October, and the "Bull Score" sentiment index has dropped to 10 out of 100 (indicating extreme pessimism).
🟢 Where the hope lies (bullish signals):
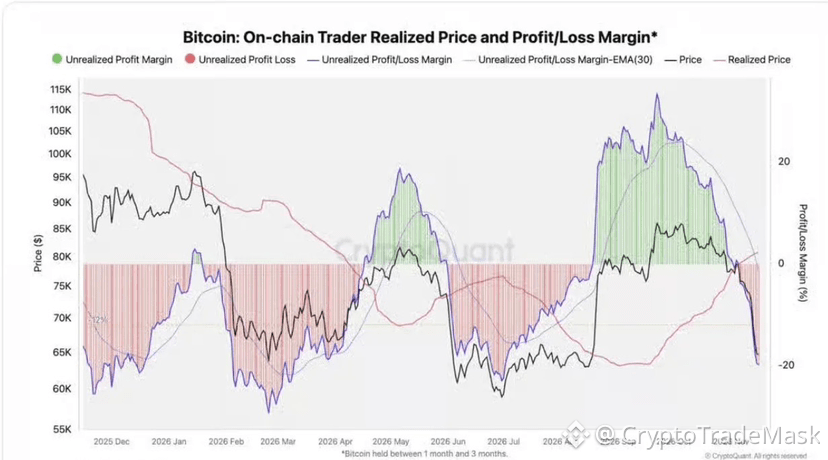
Entering the "value zone": Traders' unrealized margin has fallen to -20%-historically, major price "bottoms" have begun to form at these levels. Indicator: New Buyers - Despite sell-offs by long-term holders, new investors are actively buying up coins in the $62,000–$66,000 range (approximately 66,000 BTC accumulated over two days).
⚠️ What to expect next?
Currently, the key support zone is $62,000. If the daily candle closes below this level, the path opens toward $58,500 (the June low), while in a worst-case scenario, it could drop to the $50,000–$53,700 range.
📉 $BTC in the "value zone" — is it time to buy the dip, or is it too early?
After falling to $61,000 (a 4-month low), BTC has stabilized around $63,700 (-21.8% for the month). According to analysts at CryptoQuant, the market has officially entered a bearish phase, having lost key moving averages-the 200-day ($72,900) and the 365-day ($75,900)-which now act as significant resistance levels.
📊However, the situation is not entirely clear-cut. Here are the key takeaways from the latest report:
🔴 Factors weighing on the price (bearish signals):
Institutional outflows: U.S. spot Bitcoin ETFs saw $2.89 billion in outflows during November (with outflows recorded in 11 out of 13 trading sessions).
Capitulation and losses: Over the last 30 days, investors have realized $8.4 billion in net losses, with $5.4 billion occurring in just the last few days.
Declining liquidity: Market depth has shrunk by 38% following the disruption on Binance in October, and the "Bull Score" sentiment index has dropped to 10 out of 100 (indicating extreme pessimism).
🟢 Where the hope lies (bullish signals):
Entering the "value zone": Traders' unrealized margin has fallen to -20%-historically, major price "bottoms" have begun to form at these levels. Indicator: New Buyers - Despite sell-offs by long-term holders, new investors are actively buying up coins in the $62,000–$66,000 range (approximately 66,000 BTC accumulated over two days).
⚠️ What to expect next?
Currently, the key support zone is $62,000. If the daily candle closes below this level, the path opens toward $58,500 (the June low), while in a worst-case scenario, it could drop to the $50,000–$53,700 range.