
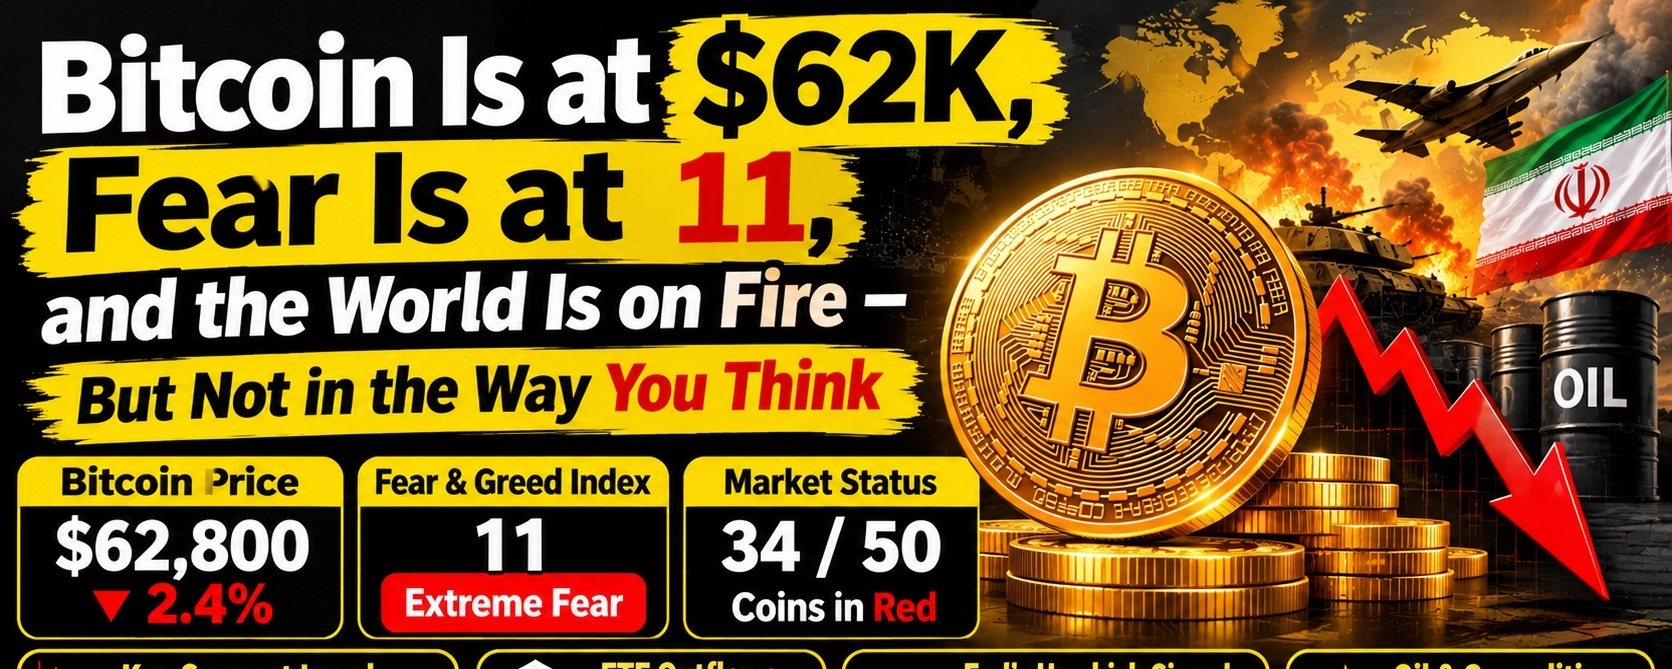


Bitcoin is hanging by a thread near $62,000, and the mood around it has moved from bad to something closer to surrender. The Fear and Greed Index sits at 11 — extreme fear — down from 49 just a month ago. Price touched an intraday low of $62,062 and was last trading around $62,800, down another 2.4% on the day. The whole crypto market is bleeding, with 34 of 50 major coins in the red. But the story behind this selloff isn't the one most people are telling.
The technical picture is ugly, and the market knows it. Bitcoin is trading below its 200-day moving average of $72,900 and its 365-day average of $75,900. both long-term benchmarks that tell you the trend has flipped. The Investing.com technical summary is a clean "Strong Sell," with 11 of 12 moving averages flashing sell signals and the RSI sitting at 40. The critical line right now is $62,000. If that breaks, the next stops are $58,500 and $53,700. Why? Because there's a dense cluster of investor cost bases between $62,000 and $66,000, and leveraged longs are stacked just below $62,000. If support fails, that becomes a liquidity gap. And gaps don't glide. they accelerate.
Here's where the conventional narrative gets it wrong. The Middle East is genuinely on fire. A US-Iran war that began in late February is still grinding on. Three American aircraft carriers are now converging on the region. Iran has launched drone attacks on Bahrain. The Strait of Hormuz is seeing tanker attacks. Brent crude is holding above $90 a barrel. The instinctive read is that this should push capital into Bitcoin as a safe haven. That's not what's happening, and the reason is the transmission chain.
Conflict pushes oil prices up. Higher oil feeds inflation expectations. Inflation expectations squeeze the Fed's room to cut. and right now, the market is pricing an 80% chance of a December rate hike. Fed Governor Christopher Waller even floated the possibility of a 50-basis-point hike in December if inflation doesn't send a credible signal. When real yields rise and the dollar strengthens, non-yielding assets like Bitcoin and gold get hit together, not bid together. The geopolitical crisis isn't acting as a safe-haven catalyst. It's acting as a rate-hike catalyst.
The selling pressure isn't just sentiment. It's mechanical. US spot Bitcoin ETFs recorded $239.9 million in net outflows on November 17 alone, with BlackRock's IBIT accounting for $209.5 million. about 87% of the damage. The previous day's $7.9 million inflow briefly broke a seven-session outflow streak, but it lasted exactly one day before redemptions resumed. For the month of November, spot Bitcoin ETFs have bled roughly $2.58 billion, and year-to-date flows have flipped negative at nearly $2 billion. Citigroup responded by cutting its 12-month Bitcoin target by about 12%, from $113,000 to $99,532, citing the break below the 200-day moving average, weakening ETF demand, a stronger dollar, and rising real rates. The bank also noted something important: Bitcoin's correlation with the S&P 500 has now risen above its correlation with gold. It's trading like a risk asset, not a hedge.
So where does that leave things? Bitcoin is caught in a pincer. On one side, the war is keeping oil elevated, which keeps inflation sticky, which keeps the Fed hawkish, which pressures all risk assets. On the other side, the ETF bid that carried the market through 2024 and 2025 has turned into a seller. The $62,000 line is the immediate test. A recovery above $66,000 could open the door toward $70,000, but that requires the macro pressure to ease. Until then, extreme fear at 11 isn't a contrarian buy signal by itself, it's a reflection of a market being squeezed from both the geopolitical and the monetary side at the same time. The war is real. The crisis is real. But the way it reaches Bitcoin is through the oil-inflation-rate chain, not through a flight to safety. That's the part most people are still getting wrong. $BTC $BNB $NVDAB