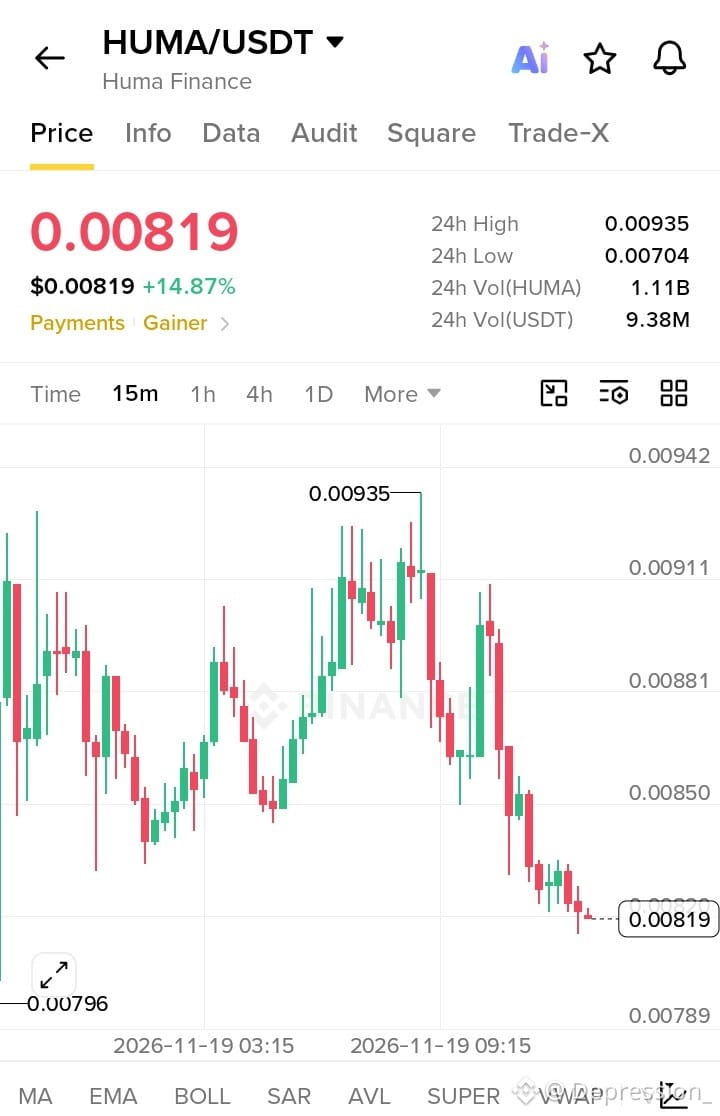
I’m honestly excited to see how $HUMA reacts around its current price zone. After an impressive 14.87% gain over the last 24 hours, the 15-minute chart is showing a noticeable pullback from the 0.00935 high. But I don't want to mistake a falling price for an automatic buying opportunity.
Chart Analysis
HUMA is currently trading around 0.00819. Recent candles show selling pressure and a sequence of lower highs and lower lows. Buyers need to step in and prove their strength before a bullish continuation becomes convincing.
The key is to watch whether price can stabilize and reclaim nearby levels.
Potential Trade Setup – LONG
Entry Zone: 0.00810 – 0.00825
TP1: 0.00850
TP2: 0.00881
TP3: 0.00911
Stop Loss: 0.00789
Important Levels to Watch
0.00850: First upside recovery level.
0.00881: Next potential resistance.
0.00911: Higher recovery target.
0.00935: Previous visible swing high.
My Pro Tips
Don't rush into a position while 15m candles are still making lower lows.
Look for a strong bullish candle and confirmation around the entry zone.
Consider securing partial profits at TP1 and TP2.
If price breaks below the stop-loss level, respect your risk management.
Avoid chasing green candles after a sudden pump.
My Take
HUMA has already delivered a strong 24-hour move, but the short-term chart needs a convincing recovery before I become bullish again. I'm watching the 0.00850 level closely because reclaiming it could be an encouraging first sign for buyers.
Patience over FOMO. Let the chart confirm the move.
$HUMA
$LAB
#CanGTA6'sLaunchLiftTTWOShares?
#SouthKoreaPlansToLet3500ListedFirmsBuyBitcoin
Chart Analysis
HUMA is currently trading around 0.00819. Recent candles show selling pressure and a sequence of lower highs and lower lows. Buyers need to step in and prove their strength before a bullish continuation becomes convincing.
The key is to watch whether price can stabilize and reclaim nearby levels.
Potential Trade Setup – LONG
Entry Zone: 0.00810 – 0.00825
TP1: 0.00850
TP2: 0.00881
TP3: 0.00911
Stop Loss: 0.00789
Important Levels to Watch
0.00850: First upside recovery level.
0.00881: Next potential resistance.
0.00911: Higher recovery target.
0.00935: Previous visible swing high.
My Pro Tips
Don't rush into a position while 15m candles are still making lower lows.
Look for a strong bullish candle and confirmation around the entry zone.
Consider securing partial profits at TP1 and TP2.
If price breaks below the stop-loss level, respect your risk management.
Avoid chasing green candles after a sudden pump.
My Take
HUMA has already delivered a strong 24-hour move, but the short-term chart needs a convincing recovery before I become bullish again. I'm watching the 0.00850 level closely because reclaiming it could be an encouraging first sign for buyers.
Patience over FOMO. Let the chart confirm the move.
$HUMA
$LAB
#CanGTA6'sLaunchLiftTTWOShares?
#SouthKoreaPlansToLet3500ListedFirmsBuyBitcoin