$ANT / USDT Perpetual: Bullish Momentum Testing Key Intraday Resistance Ahead of Nasdaq Debut
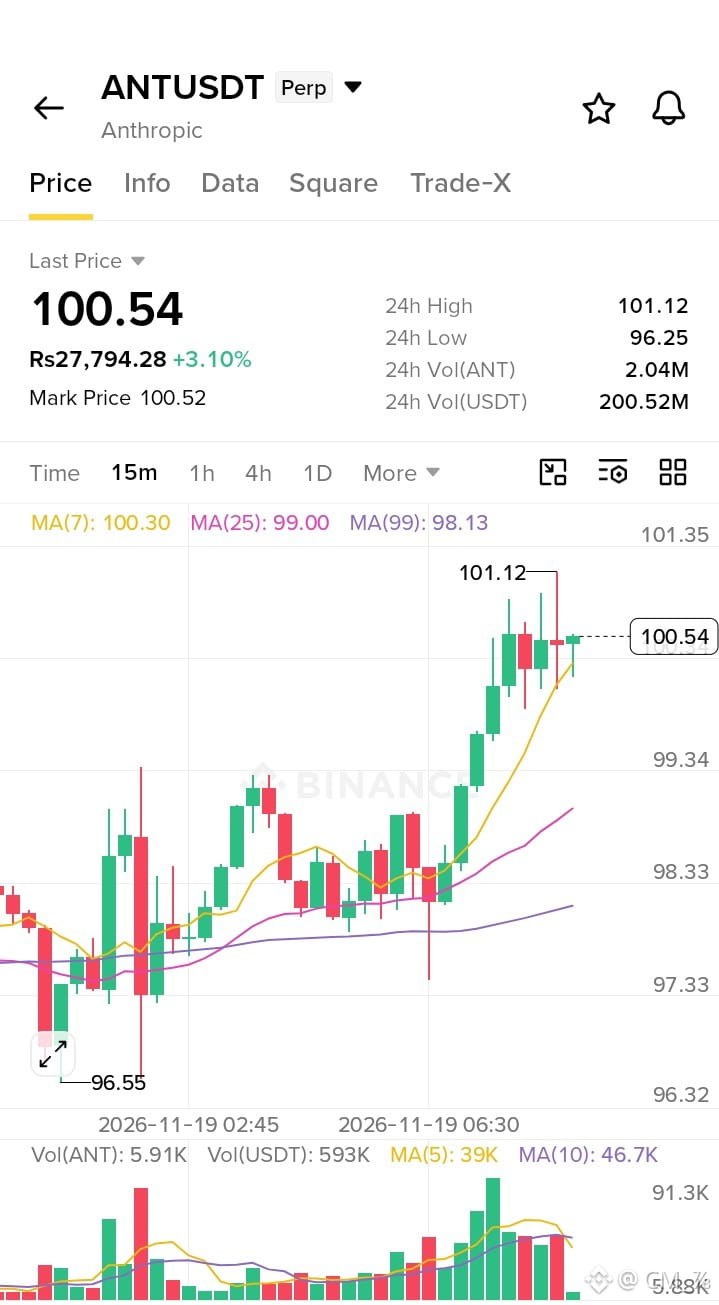
The 15m chart on $ANT shows strong upside momentum after bouncing cleanly off the $96.55 swing low and pushing to a 24h high of $101.12, currently hovering around $100.54 (+3.10%) with $200.52M in 24h USDT volume.
Market & Technical Breakdown
* Trend Structure:
Short-term trend is bullish on the 15m timeframe, with price trading above the MA(7) at 100.30, MA(25) at 99.00, and MA(99) at 98.13—confirming upward alignment across short-to-medium moving averages.
* Immediate Resistance: $101.12 is the immediate intraday ceiling (24h high), with minor chart resistance noted near $101.35. A clean break and hold above this zone opens room for price discovery.
* Key Support Levels:
* 100.00 – 100.30: Psychological round level and MA(7) dynamic support.
* 99.00: MA(25) pullback zone; losing this could signal short-term exhaustion after the vertical push.
* 96.25 – 96.55: Major 24h low / local swing base.
* Catalyst & What to Watch: With Anthropic's Nasdaq listing scheduled around this window, perpetual volatility and liquidity shifts around equity market open can trigger sharp wicks or spreads. Watch whether buyers defend the $99.00–$100.00 area on any pullback or get rejected below $101.12.
Do you think $ANT breaks cleanly above $101.12 on listing momentum, or does it pull back to retest $99.00 first?
Not financial advice. Always manage risk and do your own research before trading.
The 15m chart on $ANT shows strong upside momentum after bouncing cleanly off the $96.55 swing low and pushing to a 24h high of $101.12, currently hovering around $100.54 (+3.10%) with $200.52M in 24h USDT volume.
Market & Technical Breakdown
* Trend Structure:
Short-term trend is bullish on the 15m timeframe, with price trading above the MA(7) at 100.30, MA(25) at 99.00, and MA(99) at 98.13—confirming upward alignment across short-to-medium moving averages.
* Immediate Resistance: $101.12 is the immediate intraday ceiling (24h high), with minor chart resistance noted near $101.35. A clean break and hold above this zone opens room for price discovery.
* Key Support Levels:
* 100.00 – 100.30: Psychological round level and MA(7) dynamic support.
* 99.00: MA(25) pullback zone; losing this could signal short-term exhaustion after the vertical push.
* 96.25 – 96.55: Major 24h low / local swing base.
* Catalyst & What to Watch: With Anthropic's Nasdaq listing scheduled around this window, perpetual volatility and liquidity shifts around equity market open can trigger sharp wicks or spreads. Watch whether buyers defend the $99.00–$100.00 area on any pullback or get rejected below $101.12.
Do you think $ANT breaks cleanly above $101.12 on listing momentum, or does it pull back to retest $99.00 first?
Not financial advice. Always manage risk and do your own research before trading.