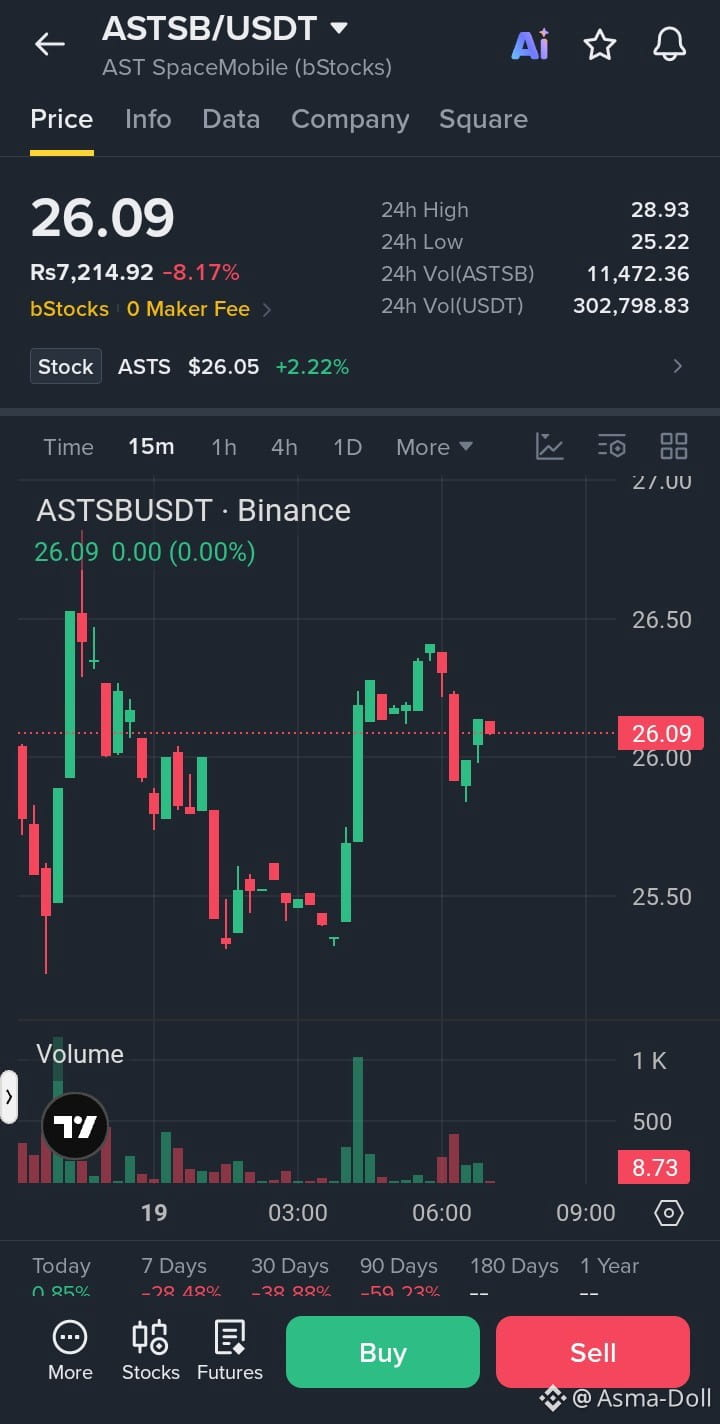
### $ASTSB /USDT – SHORT SIGNAL 📉
AST SpaceMobile (Binance bStocks)
Market analysis based on your supplied chart and price data
Current Price
### 26.09 USDT
24h Change
-8.17%
24h High
28.93
24h Low
25.22
Trade Plan
* Direction: SHORT
* Entry Zone: 26.30 – 26.80
* Stop Loss: 27.60
Take Profit Targets
* TP1: 25.80
* TP2: 25.30
* TP3: 24.50
Trade here $ASTSB
Market Analysis:
* ASTSB is showing a sharp 8.17% decline, indicating strong selling pressure.
* Price has dropped from the 28.93 high toward the 25.22 support zone.
* Buyers have not yet demonstrated a convincing recovery.
* Weak price structure increases the possibility of another downward move.
* A breakdown below 25.22 could trigger further selling.
* A temporary relief bounce toward resistance is also possible before continuation.
Important Confirmation Levels
Breakdown confirmation
* Below 25.22: bearish continuation signal.
* Below 25.00: stronger downside momentum.
* Above 26.80: short setup weakens.
* Above 27.60: stop-loss invalidation.
Risk-to-Reward Summary
| Target | Approx. R:R |
| ------ | ----------- |
| TP1 | 0.25:1 |
| TP2 | 0.75:1 |
| TP3 | 1.8:1 |
These ratios use the midpoint entry of 26.55 and SL 27.60. TP1 and TP2 offer relatively low reward versus risk.
Fundamental Risk: Recent reports also highlight renewed share-dilution concerns, adding pressure to ASTS sentiment. Yahoo Finance +1
My Trading View: Bearish bias, but don't chase the dump. Prefer a rejection near 26.30–26.80 or a confirmed breakdown below 25.22.
#ASTSB #ASTS #StockTrading #ShortSignal #BinanceSquare
Educational technical setup, not a guaranteed trade. bStocks and underlying ASTS prices may differ.
AST SpaceMobile (Binance bStocks)
Market analysis based on your supplied chart and price data
Current Price
### 26.09 USDT
24h Change
-8.17%
24h High
28.93
24h Low
25.22
Trade Plan
* Direction: SHORT
* Entry Zone: 26.30 – 26.80
* Stop Loss: 27.60
Take Profit Targets
* TP1: 25.80
* TP2: 25.30
* TP3: 24.50
Trade here $ASTSB
Market Analysis:
* ASTSB is showing a sharp 8.17% decline, indicating strong selling pressure.
* Price has dropped from the 28.93 high toward the 25.22 support zone.
* Buyers have not yet demonstrated a convincing recovery.
* Weak price structure increases the possibility of another downward move.
* A breakdown below 25.22 could trigger further selling.
* A temporary relief bounce toward resistance is also possible before continuation.
Important Confirmation Levels
Breakdown confirmation
* Below 25.22: bearish continuation signal.
* Below 25.00: stronger downside momentum.
* Above 26.80: short setup weakens.
* Above 27.60: stop-loss invalidation.
Risk-to-Reward Summary
| Target | Approx. R:R |
| ------ | ----------- |
| TP1 | 0.25:1 |
| TP2 | 0.75:1 |
| TP3 | 1.8:1 |
These ratios use the midpoint entry of 26.55 and SL 27.60. TP1 and TP2 offer relatively low reward versus risk.
Fundamental Risk: Recent reports also highlight renewed share-dilution concerns, adding pressure to ASTS sentiment. Yahoo Finance +1
My Trading View: Bearish bias, but don't chase the dump. Prefer a rejection near 26.30–26.80 or a confirmed breakdown below 25.22.
#ASTSB #ASTS #StockTrading #ShortSignal #BinanceSquare
Educational technical setup, not a guaranteed trade. bStocks and underlying ASTS prices may differ.