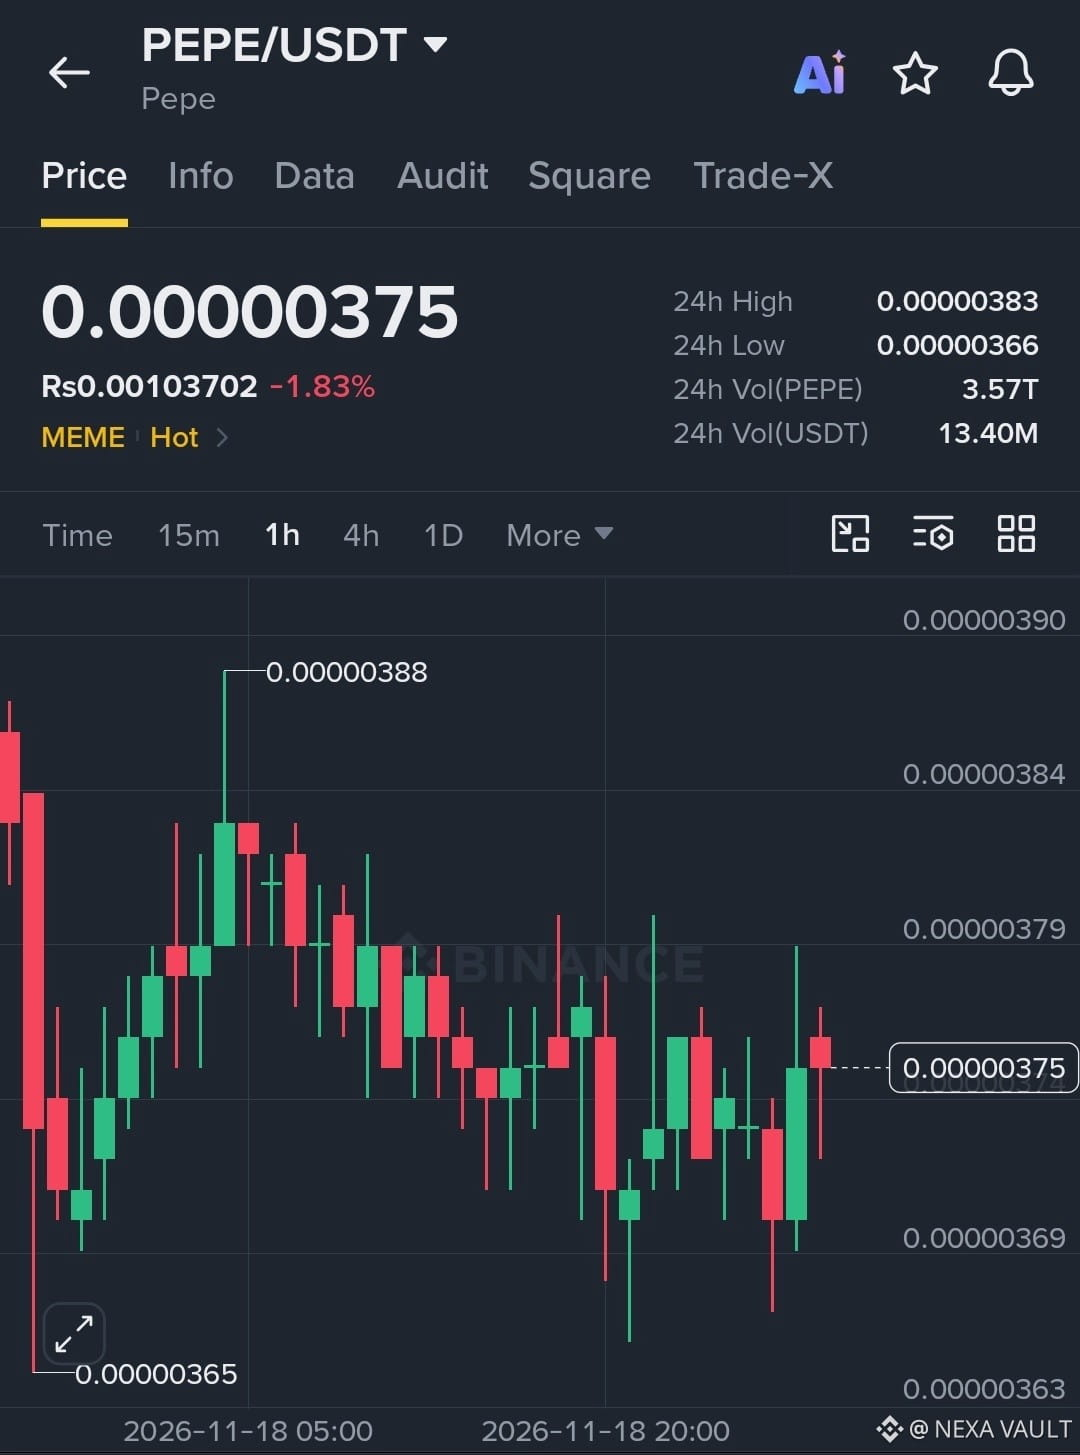
$PEPE is trading around $0.00000375, down 1.83% in the last 24 hours, but the chart is showing an interesting battle between buyers and sellers.
Here’s what matters:
* Current Price: $0.00000375
* 24H High: $0.00000383
* 24H Low: $0.00000366
* 24H Volume: 3.57T PEPE
* Trading Volume: $13.40M USDT
* Recent Chart High: $0.00000388
* Recent Chart Low: $0.00000365
On the 1-hour chart, PEPE is moving sideways after facing selling pressure. Buyers have stepped in around the $0.00000366–$0.00000369 zone, while $0.00000379 remains a nearby resistance.
A break above $0.00000379 could open the door toward $0.00000383 and possibly $0.00000388. But if sellers take control, $0.00000369 and $0.00000366 are important support levels to watch.
Here’s what matters:
* Current Price: $0.00000375
* 24H High: $0.00000383
* 24H Low: $0.00000366
* 24H Volume: 3.57T PEPE
* Trading Volume: $13.40M USDT
* Recent Chart High: $0.00000388
* Recent Chart Low: $0.00000365
On the 1-hour chart, PEPE is moving sideways after facing selling pressure. Buyers have stepped in around the $0.00000366–$0.00000369 zone, while $0.00000379 remains a nearby resistance.
A break above $0.00000379 could open the door toward $0.00000383 and possibly $0.00000388. But if sellers take control, $0.00000369 and $0.00000366 are important support levels to watch.